Lesson 4b: Global and Regional Effects of Secondary Pollutants
Introduction to Global and Regional Effects of Secondary Pollutants
The Earth is continuously receiving energy from the sun. Energy also leaves the Earth in the nighttime (of course in the form of invisible infrared energy!). Otherwise, the Earth would be continuously warming up. This delicate balance between the energy coming in and leaving due to natural greenhouse effect is what keeps the planet warm enough for us to live on.
It is very obvious that if more energy comes in than the energy that leaves, the planet will become warm. Similarly, if the energy that leaves is more than the energy that comes in, the planet will become cool. The atmospheric temperature fluctuates over centuries due to certain natural causes.
Go to the next screen to view an animation of the greenhouse effect.
Greenhouse Effect
In the first lesson, we saw that energy can be transformed from one form to another, and during this conversion, all the energy that we put into a device comes out. However, all the energy that we put in may not come out in the desired form. Please watch the following 4:17 presentation:
This diagram explains to us about the greenhouse effect. Basically what greenhouse effect is, is the sun, which emits mostly long radiation and shortwave radiation, all this radiation comes in in the morning or during daytime without any problem. The atmosphere, which has various kinds of gases like oxygen, nitrogen, little bit of carbon dioxide, et cetera, these radiations basically pass through. And the solar radiation, part of it actually gets reflected back out into the space from these clouds. Whatever reaches the Earth, here down below, part of it heats up the atmosphere or the Earth's surface, some of it is used for growing plants, some of it evaporates waters and runs the hydrological cycle. And during nighttime, all this energy that has come in during daytime generally will go back into the space as longwave radiation, which is infrared radiation. So it comes in shortwave and longwave, but all of it tries to go back or will go back in longwave radiation. Now, the gases, like CO2, in the atmosphere generally have the unique capability to trap this infrared radiation that is going out. And these gases absorb the infrared radiation, keeping a part of the radiation that would've otherwise gone out within the atmosphere. So this is called greenhouse effect, and due to this effect, because of these gases, the atmosphere right now is at an average temperature of 59 degrees Fahrenheit. Without this effect, for example if there was no CO2 in the atmosphere, no greenhouse gases, it's totally of oxygen and nitrogen, all the energy that would come in in the daytime if it had gone out in the nighttime, the Earth would be freezing at 0 degrees Fahrenheit. So at this temperature, nothing can grow on this planet, and the planet would be uninhabitable. So this greenhouse effect is what is turning this planet into a habitable planet by keeping the average temperature at about 59 degrees Fahrenheit. This temperature is the temperature that we normally see averaged over entire year at all places, including North Pole, South Pole, equator, day, night, various seasons, et cetera. So greenhouse effect is what is actually making this planet habitable by warming up little bit. Unfortunately, if we emit more and more greenhouse gases into the atmosphere like what we have been doing-- the CO2 concentration has gone up from 275 parts per million to now about 370 parts per million--if we keep on doing these kinds of things, more and more thermal energy will be trapped inside the atmosphere, and this 59 degrees temperature is likely to increase. And that's what we call global warming, or climate change, or increase in this temperature is detrimental. So the question is whether we should blame greenhouse effect for this or global warming as a bad phenomenon.
Current levels of CO2 in the atmosphere - 392 ppm in 2011. (Data shown in Excel Sheet)
Greenhouse Gases
Based on the animation of the Greenhouse Effect on the previous screen, respond to the question below:
The concentration of greenhouse gases in the atmosphere has been changing over the past 150 years. Since pre-industrial times atmospheric concentrations of the gases have increased:
- CO2 has climbed over 31 percent.
- CH4 has climbed over 151 percent.
- N2O has climbed 17 percent.
Scientists have confirmed that this is primarily due to human activities, which include burning coal, oil, and gas, and cutting down forests.

Check this out!
Instructions: Click on the greenhouse gas in the left column below to see:
- What percentage of that gas accounts for the total greenhouse emissions in the United States.
- Its source of emission
As you can see, energy related CO2 and CH4 accounts for 90 percent of the total greenhouse gas emissions in the United States. This highlights the impact of energy use on the environment.
How Has CO2 Concentration Changed?
The table below shows the change in greenhouse gas concentration between Pre-Industrial times and 2010, as well as the Atmospheric Lifetime and Global Warming Potential.
| Greenhouse Gases | Pre-Industrial Concentration (PPBV) | Concentration (2010 (PPBV) | Atmospheric Lifetime (years) | Global Warming Potential (GWP) |
|---|---|---|---|---|
| Carbon dioxide (CO2) | 278,000 | 390,000* | Variable | 1 |
| Methane (CH4 | 715 | 1810.5 | 12 | 25 |
| Nitrous oxide (N2O) | 270 | 322.5 | 114 | 298 |
| CFC-12 | 0 | 0.533 | 100 | 10900 |
| HCFC-22 | 0 | 0.208 | 12 | 1810 |
| Perfluoromethane (CF4)** | 0 | 0.07 | 50,000 | 6,500 |
| Sulfur hexa-floride (SF6) | 0 | 0.007 | 3,200 | 22,800 |
*Recent CO2 concentration (390.5 ppm) is the 2011 average taken from globally averaged marine surface data given by the National Oceanic and Atmospheric Administration Earth System Research Laboratory.
**2005 data
Source: CDIAC.org [6]

Atmospheric lifetime is the period of time during which a gas changes and is either transformed or removed from the atmosphere.
GWP is an index defined as the cumulative radiative forcing (infrared radiation absorption) between the present and some chosen time horizon caused by a unit mass of gas emitted now, expressed relative to a reference gas such as CO2, as is used here. GWP is an attempt to provide a simple measure of the relative radiative effects of different greenhouse gases.
Try This!
Instructions: In the graph below, observe how CO2 concentration in the atmosphere has changed over the past 50 years. Based on your observations, answer the questions that follow.
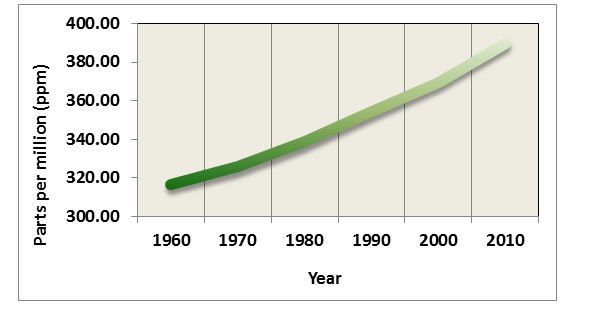
Data from the graph above was obtained from ice core samples of trapped air. More specifically, ice in the Polar Regions traps air from that particular time period, and then new ice is deposited over the previously deposited ice, trapping more air from the past. Thus, the analysis of ice core samples provides the composition of past air, which can be used to determine the past temperatures.
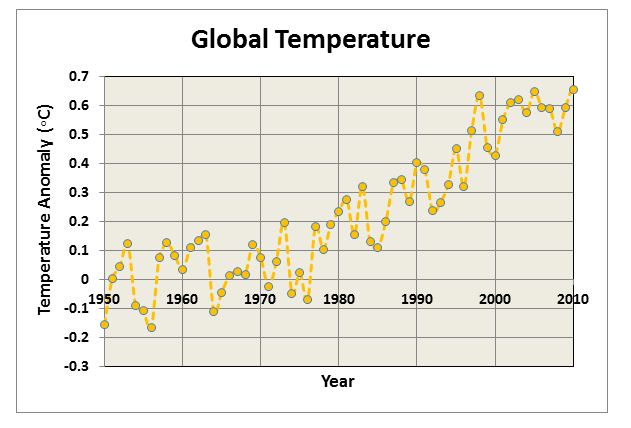
The increase in the greenhouse gases between 1950 and 2010 is believed to have caused an increase in the global temperature. The mean increase in the global temperature over the past one century is about 1 degree Fahrenheit.
Instructions: Review the graph below, showing the Annual mean for the Global surface temperature between years 1960 and 2010. The annual mean will show the detailed fluctuations.

Since 1880, about when the industrial age first started, the average increase in global temperature has been 1 degree Fahrenheit.
Not only has there been an increase in temperatures with the increase of greenhouse gasses, there has also been an increase in CO2 emissions from fossil fuels – this has been apparent over the last 150 years (since about 1850).
The graph below depicts data from ice core samples showing temperature and CO2 concentrations in the atmosphere from 400,000 years ago to about the year 2000.
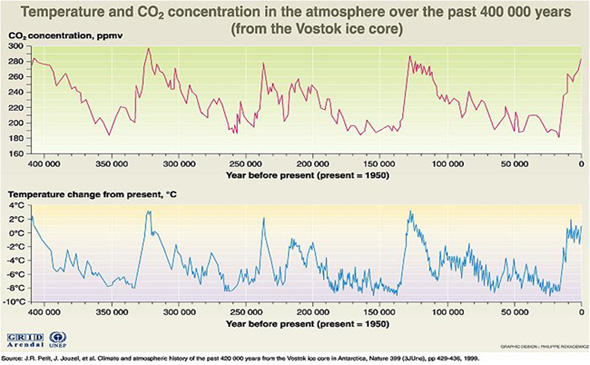
Based on the graph above, it can be determined that during periods of time where there was no human activity:
- The average global temperature increase was 2 degrees Celsius or 4 degrees Fahrenheit.
- The average temperature decrease was 8 degrees Celsius or 17 degrees Fahrenheit.
CO2 and Temperature Fluctuations
Unanswered Question
We have seen that there have been fluctuations in both temperature and CO2 emissions in the past 400,000 years. This leads to an important question:
- Did the atmospheric CO2 concentrations and temperatures change prior to the pre-industrial period or only after it?
Or more specifically:
- If we attribute the mean global temperature increase of 1ºF over the past century to human activities, how do we explain the mean global temperature fluctuations between +4ºF to -17ºF that occurred thousands of years ago, when there was no human activity?
Possible Answer
Some argue that temperature change is natural and cyclical. Thus, since it is cyclical, we, the humans, might not be influencing the current change in the climate.
The most important difference between now and then that we have to keep in mind is the human species. More than six billion people live on this planet now, who were not there during those earlier natural temperature cycles, and any chances that jeopardize the existence of this humankind must be taken seriously. The reasons for concern are discussed next.
More than 6 billion people live on this planet now who were not here during the earlier natural temperature cycles, and any chances that jeopardize the existence (land and food supply) of this humankind must be taken seriously.
The significant temperature fluctuations shown in the earlier graph of the ice core samples led to the glacial and inter-glacial ice ages. The temperature increase over the last 150 years, however, is not significant compared to the changes in the past known history. Let’s take a closer examination of the CO2 profile.
Instructions: Click on the buttons below to graph and compare CO2 and temperature on one graph, and then respond to the question that follows:
From the graph above, we know that CO2 concentration did not rise above 310 ppmv at any time from 400,000 years ago to the year 1950, even though the temperatures continued to increase. Based on this information, we can conclude that this increase is something that the atmosphere did not experience earlier, which means that the increase is the result of human activity.
Now let’s look at how CO2 concentration and temperature have changed in the last 50 years, since 1960.

Based on your observations of the above graph, reflect on the questions discussed below:
- In the past, 310 ppm of CO2 increased the temperature by about 4 degrees F, so how do you think the current CO2 concentration of 370 ppm is impacting the temperature?
- How long will it take for the temperature to come to a level that corresponds to the CO2 concentration of 370 ppm? Or are we already there?
- What will the consequences be if the concentration of CO2 increases to 550 ppm (double the pre-industrial concentration), or even to 70 ppm (both of which are proposed to be likely scenarios with the increased fossil fuel consumption?)
If the temperature already reached the maximum temperature corresponding to 370 ppm, then some other factors are cooling the planet that were absent in the previous cycles.
Now, let’s examine the reasons or causes for the natural fluctuations.
Global Warming
The sun is the main source of energy and, as we discussed earlier, it is the net balance between the incoming solar energy and the outgoing energy that causes the temperature changes.
The Earth is continuously moving around the sun. Based on its position, the incoming energy changes. The Earth’s axis of rotation is tilted at an angle of 23.5°, and this tilt goes from one side to the other and back over in 40,000-year cycles. Earth’s axis of rotation takes about 21,000 years to complete a cycle.
Instructions: Click the play button below to view the earth’s movement around the sun.
The Earth’s orbit around the sun changes from a circular path to an elliptical path and back to a circular path over 100,000 years. These are long-term changes. On a much shorter term, the radiation from the sun can be affected by the activity on the surface of the sun. Sun spots (intense flares on the surface) can increase the radiation from the sun. The increase in the solar activity occurs over an 11-year cycle.
Like many fields of scientific study, there are uncertainties associated with the science of global warming. This does not imply that all things are equally uncertain. Some aspects of the science are based on well-known physical laws and documented trends, while other aspects range from 'near certainty' to 'big unknowns.'
On the following pages, we will discuss the following:
- What is known for certain? Human activities change the Earth's Atmosphere.
- What is likely? Greenhouse gases contribute to global warming. Several factors impact temperature (clouds, fine particles, oceans). Global Warming affects health, water resources, polar regions, coastal zones and forests.
- What is uncertain? The long term effects of global warming, especially for smaller areas.
What is Known for Certain
Human activities change the earth's atmosphere.
Scientists know for certain that human activities are changing the composition of Earth's atmosphere. Increasing levels of greenhouse gases in the atmosphere, like carbon dioxide (CO2), have been well documented since pre-industrial times. There is no doubt this atmospheric buildup of carbon dioxide and other greenhouse gases is largely the result of human activities.
It's well accepted by scientists that greenhouse gases trap heat in the Earth's atmosphere and tend to warm the planet. By increasing the levels of greenhouse gases in the atmosphere, human activities are strengthening Earth's natural greenhouse effect. The key greenhouse gases emitted by human activities remain in the atmosphere for periods ranging from decades to centuries.
A warming trend of about 1oF has been recorded since the late 19th century. Warming has occurred in both the northern and southern hemispheres, and over the oceans. Confirmation of twentieth-century global warming is further substantiated by melting glaciers, decreased snow cover in the northern hemisphere, and even warming below ground.
What is Likely but Uncertain: Greenhouse Gases Contribute to Global Warming
Greenhouse gases contribute to global warming.
Determining to what extent the human-induced accumulation of greenhouse gases since pre-industrial times is responsible for the global warming trend is not easy. This is because other factors, both natural and human, affect our planet's temperature. Scientific understanding of these other factors—most notably natural climatic variations, changes in the sun's energy, and the cooling effects of pollutant aerosols—remains incomplete or uncertain; however…
- The Intergovernmental Panel on Climate Change (IPCC) stated there was a "discernible" human influence on climate; and that the observed warming trend is "unlikely to be entirely natural in origin."
- In the most recent Third Assessment Report (2001), IPCC wrote "There is new and stronger evidence that most of the warming observed over the last 50 years is attributable to human activities."
In short, scientists think rising levels of greenhouse gases in the atmosphere are contributing to global warming, as would be expected; but to what extent is difficult to determine at the present time.
As atmospheric levels of greenhouse gases continue to rise, scientists estimate average global temperatures will continue to rise as a result. By how much and how fast remain uncertain. IPCC projects further global warming of 2.2 - 10oF (1.4 - 5.8oC) by the year 2100.
What is Likely but Uncertain: Factors Affecting Temperature
Some factors that affect the Earth's temperatures include clouds, fine particles, and oceans.
Clouds
- Low, thick clouds primarily reflect solar radiation and cool the surface of the Earth.
- High, thin clouds primarily transmit incoming solar radiation; at the same time, they trap some of the outgoing infrared radiation emitted by the Earth and radiate it back downward, thereby warming the surface of the Earth.
- Whether a given cloud will heat or cool the surface depends on several factors, including the cloud's height, its size, and the make-up of the particles that form the cloud.
- The balance between the cooling and warming actions of clouds is very close - although, overall, cooling predominates.
Fine Particles (aerosols) in the atmosphere
The amount of fine particles or aerosols in the air has a direct effect on the amount of solar radiation hitting the Earth's surface. Aerosols may have significant local or regional impact on temperature.
Atmospheric factors shown in the image below include natural factors such as clouds, volcanic eruptions, natural biomass (forest) burning, and dust from storms. In addition, human-induced factors such as biomass burning (forest and agricultural fires) and sulfate aerosols from burning coal add tiny particles that contribute to cooling. Please watch the following 2:41 presentation: "The Cooling Factors."
There are several factors that have an influence on the earth's climatic change. Some of these happen to be clouds, fine particles, et cetera. Low, thick clouds primarily reflect solar radiation and cool the surface of the earth. High, thin clouds primarily transmit incoming solar radiation. At the same time, they trap some of the outgoing infrared radiation emitted by the earth's surface and radiate it back downward, thereby warming the surface of the earth. Whether a given cloud will heat or cool the surface depends on several factors, including the cloud's height, size, and the make of the particles that form the cloud. there in the atmosphere also change. As we talked about, the fine particles are coming into the atmosphere from volcanic eruptions, for example, or biomass burning, including natural forest fires, and also dust from the storms, sandstorms, et cetera. And we have very fine sulfate aerosols from burning coal and oil that come into the atmosphere. And these fine particles sometimes contribute to cooling. This is well known. For example, when Mount Pinatubo erupted in Philippines in 1991, there were a lot of fine particles that were spewed into the atmosphere which covered the surface, and it caused, basically, cooling. So again, at this point we do not know exactly how these factors will affect in future. Forest fires release carbon dioxide into the atmosphere, and, as we all know, carbon dioxide traps heat. And volcanic eruptions, these particles can cool sometimes-- oceans, clouds. And prediction of these kinds of things for future is a difficult task, and that is the reason predicting what is likely to happen is not so certain at this point in time.
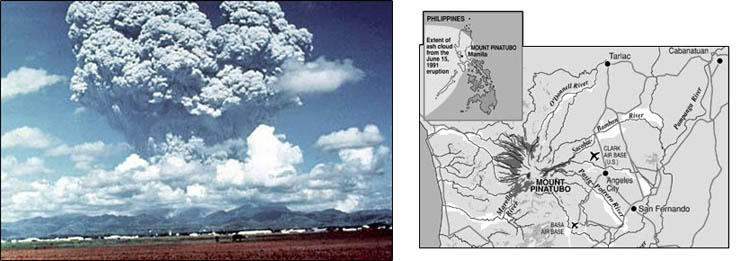
When Mount Pinatubo erupted in the Philippines in 1991, an estimated 20 million tons of sulfur dioxide and ash particles blasted more than 12 miles high into the atmosphere. The eruption caused widespread destruction and human causalities. Gases and solids injected into the stratosphere circled the globe for three weeks.
Volcanic eruptions of this magnitude can impact global climate, reducing the amount of solar radiation reaching the Earth's surface, lowering temperatures in the troposphere, and changing atmospheric circulation patterns. The extent to which this occurs is an uncertainty.
Below is a picture of Mount Pinatubo next to a map of its location and how far the ash from its eruption spread.
Water vapor is a greenhouse gas, but at the same time, the upper white surface of clouds reflects solar radiation back into space. Albedo—reflections of solar radiation from surfaces on the Earth—creates difficulties in exact calculations. If, for example, the polar icecap melts, the albedo will be significantly reduced. Open water absorbs heat, while white ice and snow reflect it.
Oceans
Oceans play a vital role in the energy balance of the Earth. It is known that the top 10 feet of the oceans can hold as much of the heat as the entire atmosphere above the surface. However, most of the incoming energy is incident on the equatorial region.
The water in the oceans in the equatorial regions is warmer and needs to be transported to the northern latitudes. This is done due to natural variations in the temperatures of the water and prevailing winds that cause the disturbances in the surface waters.
The Intergovernmental Panel on Climate Change (IPCC) states that even the low end of this warming projection "would probably be greater than any seen in the last 10,000 years, but the actual annual to decadal changes would include considerable natural variability."
Instructions: Click the play button to learn about the Ocean Conveyor Belt in the 2:52 presentation:
Oceans play a vital role in the energy balance of the earth. It is established that the top 10 feet of the oceans, which is roughly 3 meters, can hold as much of the heat as the entire atmosphere above the surface. However, most of the incoming energy is incident in the equatorial regions where the water gets warmer. And the water in these regions is much, much warmer compared to the water near the polar regions. And this warm water in the equatorial region needs to be transported to the northern latitudes. And this upper-layer water is not so rich in nutrients, whereas under the ocean it is rich in nutrients. Generally, this transportation is done due to natural variations in the temperature of the water, prevailing winds that cause the disturbances in the surface waters. The cold and dense water, from the polar regions basically, flows into the ocean, sinks to the bottom, and, pushing the warm waters from the surface, move towards the, again, northern latitudes. So this basically establishes a kind of oceanic conveyor belt. Warm, salty water is chilled when it is sinking in the northern Atlantic and it flows southwards towards Antarctica. And this is cooled further at the bottom of the oceans into Atlantic, Indian, and Pacific basins. The water returns to the surface, again primarily in Pacific and Indian Oceans, and again it comes back to the surface and goes to the northern Atlantic. While traveling deep in the ocean, the originally nutrient-depleted water becomes increasingly enriched by organic matter decomposition in the important nutrients, particularly phosphates, nitrates, and silicates. And that's how this is a very, very important process here in transporting the CO2 and the heat that is available to the surface water. So this oceanic conveyor belt plays a very important role in the heat distribution.
What is Likely but Uncertain: Impact of Global Warming
Impact of Global Warming on such things as health, water resources, polar regions, coastal zones, and forests is likely but it is uncertain to what extent.
Health
The most direct effect of climate change would be the impacts of the hotter temperatures, themselves. Extremely hot temperatures increase the number of people who die on a given day for many reasons:
- People with heart problems are vulnerable because one's cardiovascular system must work harder to keep the body cool during hot weather.
- Heat exhaustion and some respiratory problems increase.
- Higher air temperatures also increase the concentration of ozone at ground level.
- Diseases that are spread by mosquitoes and other insects could become more prevalent if warmer temperatures enabled those insects to become established farther north; such "vector-borne" diseases include malaria, dengue fever, yellow fever, and encephalitis.
Water Resources
Changing climate is expected to increase both evaporation and precipitation in most areas of the United States. In those areas where evaporation increases more than precipitation, soil will become drier, lake levels will drop, and rivers will carry less water. Lower river flows and lower lake levels could impair navigation, hydroelectric power generation, and water quality, and reduce the supplies of water available for agricultural, residential, and industrial uses. Some areas may experience increased flooding during winter and spring, as well as lower supplies during summer.
Polar Regions
Climate models indicate that global warming will be felt most acutely at high latitudes, especially in the Arctic where reductions in sea ice and snow cover are expected to lead to the greatest relative temperature increases. Ice and snow cool the climate by reflecting solar energy back to space, so a reduction in their extent would lead to greater warming in the region.
Coastal Zones
Sea level is rising more rapidly along the U.S. coast than worldwide. Studies by EPA and others have estimated that along the Gulf and Atlantic coasts, a one-foot (30 cm) rise in sea level is likely by 2050.
In the next century, a two-foot rise is most likely, but a four-foot rise is possible. Rising sea level inundates wetlands and other low-lying lands, erodes beaches, intensifies flooding, and increases the salinity of rivers, bays, and groundwater tables. Low-lying countries like Maldives located in the Indian Ocean and Bangladesh may be severely affected. The world may see global warming refugees from these impacts.
Forests
The projected 2°C (3.6°F) warming could shift the ideal range for many North American forest species by about 300 km (200 mi.) to the north.
- If the climate changes slowly enough, warmer temperatures may enable the trees to colonize north into areas that are currently too cold, at about the same rate as southern areas became too hot and dry for the species to survive. If the Earth warms 2°C (3.6°F) in 100 years, however, the species would have to migrate about 2 miles every year.
- Poor soils may also limit the rate at which tree species can spread north.
- Several other impacts associated with changing climate further complicate the picture:
- On the positive side, CO2 has a beneficial fertilization effect on plants, and also enables plants to use water more efficiently. These effects might enable some species to resist the adverse effects of warmer temperatures or drier soils.
- On the negative side, forest fires are likely to become more frequent and severe if soils become drier.
What is Uncertain
The long-term effects of global warming
Scientists have identified that our health, agriculture, water resources, forests, wildlife, and coastal areas are vulnerable to the changes that global warming may bring. But projecting what the exact impacts will be over the twenty-first century remains very difficult. This is especially true when one asks how a local region will be affected.
Scientists are more confident about their projections for large-scale areas (e.g., global temperature and precipitation change, average sea level rise) and less confident about the ones for small-scale areas (e.g., local temperature and precipitation changes, altered weather patterns, soil moisture changes). This is largely because the computer models used to forecast global climate change are still ill-equipped to simulate how things may change at smaller scales.
Some of the largest uncertainties are associated with events that pose the greatest risk to human societies. IPCC cautions, "Complex systems, such as the climate system, can respond in non-linear ways and produce surprises." There is the possibility that a warmer world could lead to more frequent and intense storms, including hurricanes. Preliminary evidence suggests that, once hurricanes do form, they will be stronger if the oceans are warmer due to global warming. However, the jury is still out whether or not hurricanes and other storms will become more frequent.

Solutions for Global Warming
Today, there is no single solution that is agreed upon, because scientists are still debating whether the problem is a real one or a perceived one. The main question is whether we want to wait to see the effects for sure and then act, or whether we want to start to do something now?
Like many pioneer fields of research, the current state of global warming science can't always provide definitive answers to our questions. There is certainty that human activities are rapidly adding greenhouse gases to the atmosphere, and that these gases tend to warm our planet. This is the basis for concern about global warming.
The fundamental scientific uncertainties are these: How much more warming will occur? How fast will this warming occur? And what are the potential adverse and beneficial effects? These uncertainties will be with us for some time, perhaps decades.
Global warming poses real risks. The exact nature of these risks remains uncertain. Ultimately, this is why we have to use our best judgment—guided by the current state of science—to determine what the most appropriate response to global warming should be.
What difference can I make?
When faced with this question, individuals should recognize that, collectively, they can make a difference. In some cases, it only takes a little change in lifestyle and behavior to make some big changes in greenhouse gas reductions. For other types of actions, the changes are more significant.
When that action is multiplied by the 270 million people in the U.S. or the 6 billion people worldwide, the savings are significant. The actions include being energy efficient in the house, in the yard, in the car, and in the store.
Everyone's contribution counts, so why not do your share?
Energy Efficiency Means Doing the Same (or More) with less Energy. When individual action is multiplied by the 270 million people in the U.S., or the 6 billion people worldwide, the savings can be significant.
How Can I Save the Environment?
Instructions: You can help save the environment by making changes from the top to the bottom of your home. Roll over the numbers below to see how you can make a difference:
Review
To review, these are the things you can do in your home – from top to bottom - to protect from the environment:
- Purchase "Green Power" - electricity that is generated from renewable sources such as solar, wind, geothermal, or biomass - for your home's electricity, if available from your utility company. Although the cost may be slightly higher, you'll know that you are buying power from an environmentally friendly energy source.
- Insulate your home – you’ll learn more about this in Home Activity Three.
- Use low-flow faucets in your showers and sinks.
- Replace toilets with water-saving lavatories.
- Purchase home products—appliances, new home computers, copiers, fax machines, that display the ENERGY STAR® label - You can reduce your energy consumption by up to 30 percent and lower your utility bills! Remember, the average house is responsible for more air pollution and carbon dioxide emissions than is the average car.
- When your lights burn out, replace them with energy-efficient compact fluorescent lights.
- Lower the temperature on your hot water tank to 120 degrees.
- Tune up your furnace.
- Insulate your water heater and all water pipes to reduce heat loss.
When you remodel, build, or buy a new home, incorporate all of these energy efficiency measures—and others.
Each of us, in the U.S., contributes about 22 tons of carbon dioxide emissions per year, whereas the world average per capita is about 6 tons.
The good news is that there are many ways you and your family can help reduce carbon dioxide pollution and improve the environment for you and your children.