Learner’s Guide to Geospatial Analysis
Test.
Preface
Why this publication?
The WMD Commission concluded that, “the Intelligence Community was dead wrong in almost all of its pre-war judgments about Iraq's weapons of mass destruction” (Iraq Survey Group Final Report: Weapons of Mass Destruction (WMD), September 30, 2004). This failure to appreciate the human-geographic implications of operations in Afghanistan, and to understand the impact of New Orlean's human geography on Katrina rescue efforts raises serious questions about our preparation of those carrying out geospatial analysis or, at least, to inform our leaders of our analysis. As educators, we share in these failures since we educated the failed analyst.
The ultimate goal of this publication is to help the geospatial analyst produce accurate intelligence which saves lives, improves government, serves law enforcement, and helps business. Good geospatial intelligence separates the important from the unimportant and conceptualized a spatial order out of apparent disorder. Such analysis is not innate, and the analysis is subject to many uniquely spatial fallacies, biases, and confusion between cause and effect, technical necessities, group-think, and analyst failings. Even the most experienced geospatial analyst will sometimes fall into one of these pitfalls. The truly good geospatial analyst knows what the pitfalls are and works toward objective and accurate analysis.. Geospatial analysts should be aware of their spatial reasoning processes. Quoting Richards Heuer [1] (p. 31), "they should think about how they make judgments and reach conclusions, not just about the judgments and conclusions themselves."
Academia almost exclusively teaches the scientific method as a method to create knowledge. But, it seems the scientific method is seldom used in geospatial intelligence work. What method or approach is used? The intuitive method seems to be the primary method for producing geospatial intelligence which:
- has the well known tendency to permit biases to influence the analytic result;
- is difficult for other analysts to reproduce; and
- is difficult to teach since the results are based on intuition which comes with experience.
Using the scientific method has it's limitations since the scientific method starts with a single hypothesis. As such, some suggest it is not appropriate for developing intelligence (Heuer, 2009). As Don L. Jewett (2007) points out, the problem with starting with a single hypothesis is the emotional attachment to the hypothesis and the temptation to use the results that contradict a less desired desired hypothesis. Other methodologies exist that provide analytic means to arrive at an accurate analytic result. This is not an attempt to diminish the importance of intuition and experience. Rather it suggested an appropriate mixture of science and intuition as a means to produce good geospatial intelligence.
Chapter 1 - Introduction
Chapter 1 Overview
The Geospatial Intelligence Professional
The Geospatial Intelligence professional is a “knowledge worker” or “symbol analyst” (a term used by the U.S. Department of Labor) who carries out multi-step operations, manipulates abstract symbols, addresses abstract and complex ideas, acquires new information, and must remain mindful enough to recognize change. Successful knowledge work, like all work, requires study and practice. Professionalism in the area calls for broad experience and understanding of the entire Intelligence Community. The individual who is only interested in geospatial technology, as central as it is to the discipline, is not fully a Geospatial Intelligence professional. Nor is the technical expert in GIS or remote sensing ipso facto a Geospatial Intelligence professional.
What is Intelligence and What is Geospatial Intelligence?
What is Intelligence?
In his 2006 book, Intelligence: From Secrets to Policy, Lowenthal (p 8) defines intelligence in three ways:
- Intelligence as a process
A means by which certain types of information are required and requested, collected, analyzed, and disseminated, and as the way in which certain types of covert action are conceived and conducted. - Intelligence as a product
A knowledge product resulting from analyzes and intelligence operations themselves. - Intelligence as an organization
Entities that carry out various functions for Intelligence.
Lowenthal points out that to the average person, intelligence is about secrets and spying. However, according to Lowenthal, this view of intelligence as primarily secrets misses the important point that intelligence is ultimately information about anything that can be known regardless of how it is discovered. More specifically, intelligence is information that meets the needs of a decision maker, and has been collected, processed, narrowed, and offered to meet those needs. This is to say, intelligence can be considered a specific subset of the broader category of information. It also can be said that all intelligence is information but not all information is intelligence. A key point is that Intelligence and the entire intelligence process responds to the needs of the decision makers. Lowenthal also points out that many think of intelligence in terms of government and/or military information. This is certainly a major use of intelligence, but political, business, social, environmental, health, espionage, terrorism, and cultural intelligence also intelligence. Lowenthal states a fundamental that Intelligence is not about truth (Lowenthal, p 6) and it is more accurate to think of intelligence as "proximate reality." Intelligence analysts do their best to arrive at a accurate approximation of what is going on but they can rarely be assured that their best analytic results are true. Therefore, the is "intelligence products that are reliable, unbiased, and free from politicization. In other words, to develop a product that is as close to the truth as it can be humanly possible to discern." (Lowenthal, p 6).
De Jure Definition of Geospatial Intelligence
De jure is a Latin term which means, "by law" which is commonly contrasted to de facto which means, "concerning the fact" or in practice but not necessarily ordained by law. The NIMA Act of 1996 establishing the National Imagery and Mapping Agency and the subsequent amended language in the 2003 Defense Authorization Act as codified in the U.S. Code governs the mission of the National Geospatial-Intelligence Agency (NGA). The de jure definition of Geospatial Intelligence is found in U.S. Code Title 10, §467:
The term "geospatial intelligence" means the exploitation and analysis of imagery and geospatial information to describe, assess, and visually depict physical features and geographically referenced activities on the earth. Geospatial intelligence consists of imagery, imagery intelligence, and geospatial information.
The moniker GEOINT has become associated with geospatial Intelligence with a specific meaning and context. It has often been said that the 2003 renaming of NIMA to NGA recognized the emergence of geospatial information as an intelligence source in its own right, which is termed GEOINT. The term GEOINT connotes a source of intelligence like HUMINT, MASINT, COMINT, ELINT, SIGINT, IMINT. GEOINT is uniquely multi-source in that it integrates and enriches information collected by the other INTs into a spatiotemporal context.
The de jure definition drives us to focus on Geographic Information Systems and digital remote sensing, since these technologies, as a substantial component of workflows such as TPED (Tasking, Processing, Exploitation, and Dissemination), heavily leverage spatial data handling and image processing technologies to transform geospatial data. However, there is a growing recognition that GEOINT “must move from an emphasis on data and analysis to an emphasis on knowledge” (Priorities for GEOINT Research at the National Geospatial-Intelligence Agency, The National Academies Press, 2006, P. 9). Here, the use of the term knowledge means the confident understanding of a subject with the ability to use it for a specific purpose appropriately. This is to say, geospatial knowledge creation involves much more than automated data handling and is a complex cognitive process involving perception, learning, communication, association and reasoning.
De Facto Definition of Geospatial Intelligence
We would like to suggest the following as an emerging definition of Geospatial Intelligence, which might carry the moniker of GeoIntel, as a means to guide the preparation of the geospatial professional:
Geospatial Intelligence is actionable knowledge, a process, and a profession. It is the ability to describe, understand, and interpret so as to anticipate the human impact of an event or action within a spatiotemporal environment. It is also the ability to identify, collect, store, and manipulate data to create geospatial knowledge through critical thinking, geospatial reasoning, and analytical techniques. Finally, it is the ability to ethically collect, develop, and present knowledge in a way that is appropriate to the decision-making environment.
In this definition, Geospatial Intelligence doesn’t just provide the means by which to answer the questions of what?, when?, and where?, but also how?, why?, and what is the significance? Central to this proposed definition is the notion that the best geospatial intelligence resource is an educated analyst and that intelligence is about nothing if not about “out-thinking” your opponent. For all the appropriate emphasis on technologies, methodologies, tools, and infrastructure, people still are the most precious resource.
Intelligence Cycle and Process
Intelligence Analysis in a Cycle
Analysis resides within the larger intelligence cycle. The intelligence cycle determines the daily activities of the Intelligence Community. It starts with the needs of the intelligence "consumers' such as policymakers, military officials, and other decision makers who need intelligence for their activities. These requirements are sorted and prioritized within the Intelligence Community and are used to drive the collection activities of the Intelligence Community. The cycle, as depicted in the figure below, is repeated until an intelligence requirement has been satisfied.
The Intelligence Cycle is a concept that describes the general intelligence process in both a civilian or military intelligence agency or in law enforcement. The cycle is typically represented as a closed path of activities. Problems with a closed loop include an overall process that is no better than its weakest component and stove piping. In the traditional intelligence use of the term, stove piping keeps the output of different collection systems separated from one another. Stove piping prevents one discipline from cross-checking another and bypassing the regular analysis of raw intelligence by sending only raw intelligence that supports a particular position to the leadership.
Analysis is using information about the context of a situation, characterizing the known observables, and applying the appropriate statements of probability to anticipate future situations. Descriptions of the anticipated situations are developed from what may be inaccurate or deliberately deceptive information; therefore, the analyst must correlate the similarities among observations and develop a common "truth." A set of repeatable and useful problem-solving approaches is helpful and essential for analysts. Because of the nature of the intelligence problem and work, an analytic approach must be tolerant of deceptive information far more than the scientist performing an experiment. According to Richards Heuer [1], intelligence analysis involves incremental, iterative, refinement.
Intelligence Process
The term "intelligence process" refers to the steps of the cycle. Intelligence, as practiced in the United States, is commonly thought of as having five steps. Lowenthal (2006, p 55) added two phases for seven phases of the intelligence process as (1) requirements, (2) collection, (3) processing and exploitation, (4) analysis and production, (5) dissemination, (6) consumption, and (7) feedback. The following paraphrases Lowenthal (p 55):
- Requirements.
Identifying requirements means defining those questions to which intelligence is expected to make a contribution. Requirements also means specifying the collection of certain types of intelligence. The impulse is to say that all policy areas have intelligence requirements, which they do. However, since intelligence capabilities are limited, priorities must be set. - Collection.
Once requirements and priorities have been established, the intelligence is collected. Some requirements have specific types of collection; some may require several types of collection. Making these decisions is a key issue and the question of how much can or should be collected to meet each requirement. - Processing and Exploitation.
Collection produces information which must undergo processing and exploitation before it can be regarded as intelligence and given to analysts. Conversion includes translations, decryption, and interpretation. - Analysis and Production.
Analysis and production includes the integration, evaluation, and analysis of all available data, and the preparation of intelligence products, including quickly developed single-source, event-oriented reports and longer term all-source and intelligence studies. "All-source" intelligence analysis is done exclusively by the CIA, DIA, and the State Department's Bureau of Intelligence and Research. All-source analysts complete a more thorough evaluation and assessment of the collected information by integrating the information from other classified and unclassified sources.
Significantly, according to Lowenthal, most discussions of the intelligence process end with the dissemination and the intelligence having reached the policy makers. However, Lowenthal bundles dissemination with consumption and adds feedback:
- Dissemination and Consumption
Dissemination and Consumption are taken together by Lowenthal. The process of dissemination, or the process of moving intelligence from producers to consumers, is largely standardized, with consumption being assumed in the 5-step process. However, Lowenthal points out that policy makers are not pressed into action by the receipt of intelligence, and if and how they consume intelligence is key (Lowenthal p. 62). - Feedback.
A dialog between intelligence consumers and producers should occur before and continue after the intelligence has been received. The analyst should have some sense of how well their intelligence requirements are being met and address any adjustments that need to be made. Feedback assesses the degree to which the finished intelligence addresses the needs of the intelligence consumer and will determine if further collection and analysis is required.
What is Intelligence Analysis?
Puzzles and Mysteries
The following discussion is a paraphrase of the RAND report Assessing the Tradecraft of Intelligence Analysis [3] (Chapter 2, pages 3-12).The intelligence cycle can be contrasted with the intelligence analytic cycle which, according to the RAND report, typically includes three forms of analysis:
- technical processing as a form of analysis
- single discipline analysis such as GEOINT
- all-source analysis
The distinction between the first two types and all-source analysis is being blurred because of this use of tools, such as GIS, to integrate multiple intelligence sources. As such, some suggest a continuum of analysis from the collection system at one end to analysis at the other. Along this continuum, there is a transition where the data is used to support analysis. According to RAND, past this transitional area, analysis splits into:
- puzzle-solving
- mystery-framing
According to RAND:
- A puzzle tests the ingenuity of the solver to use information. Here one pieces together the information pieces in a logical way in order to come up with the solution, sort of like, the overlay process in GIS. Puzzle-solving in GIS involves pulling together many sources of data and information and, using that evidence, identifies new spatial patterns or trends and develops new knowledge.
- Mystery-framing includes political and societal questions related to humans. Anticipating human actions, e.g., where will a terrorist strike next, always involves subjective judgment which is less certain and more prone to biases. The analytic logic is also significant different for mysteries because there is no definitive solution. Mysteries can only be generally framed and made sense of which suggested that the argument is as important as the evidence. In the geospatial realm, information is always lacking because of accuracy, age, detail, or relevance. Therefore, many geospatial intelligence questions are mysteries. Mysteries involving human perceptions benefit from experience.
Is Geospatial Intelligence Art or Science?
It should be no surprise that there are competing views of geospatial analysis. One school is that intuition, experience, and subjective judgment are key. Analysis here is an art, and non-quantitative methods predominate. Another school is that quantitative data and analysis using such tools as GIS are most relevant. Intelligence analysis here is science-like, and quantitative methods as applied in spatial analysis predominate. This controversy somewhat mirrors a long-standing debate in the intelligence community: if good analysis depends largely on subjective, intuitive judgment (an art) or systematic analytic methods (a science). Understanding this question is important to the person when developing an effective approach to geospatial intelligence creation. To help understand these points of view, I will define the terms using the Merriam-Webster Collegiate Dictionary, tenth edition, as:
- Art - the conscious use of skill and creative imagination in the production of anesthetic objects.
- Science - knowledge or a system of knowledge covering general truths or the operation of general laws, especially as obtained and tested through the scientific method.
Interestingly, there are those that consider integrative geospatial data tools, such as those found in GIS, as primarily aids to intuition and experience-based analysis and not the application of quantitative analytic methods. This seems contrary to the technical capabilities GIS brings to the geospatial intelligence. It is correct to say that there is no certain dividing line between art and science. Some contend there is no diving line at all and a pure scientific approach to geospatial analysis is impossible. The dissatisfaction with the push toward a science only perspective in GIS has been seen as a step backward by some. In this thinking, GIS’s models and analysis methods are not rich enough in geographical concepts and understanding to accurately reflect reality.
Geospatial intelligence is geospatial analysis, and geospatial analysis, at its core, is geography. Geography is both the conscious use of creative imagination in the representations of the earth and the science of developing general truths about the earth. For something to be automatable, it must be modeled and the facts (inputs) quantified. Since a model is a simplified abstract view of the complex reality, the model represents a limited set of rules which allows analysts to work out an answer if they have certain information. Quantifiability of the information is important because unquantifiable inputs cannot be tested, and thus unquantifiable results can neither be duplicated nor contradicted. However, we know that reliable models and data are not available for all analysis.
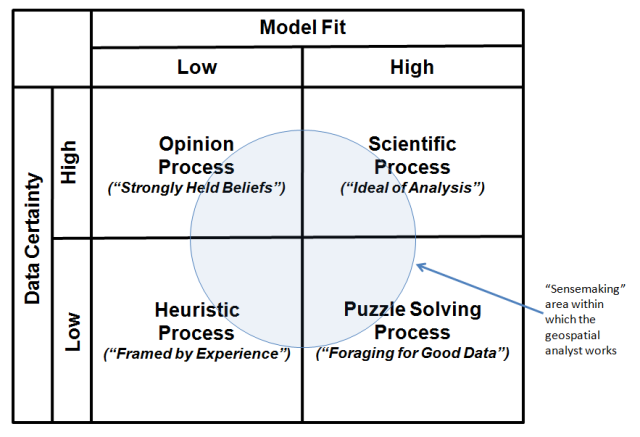
Pulling all of these thoughts together, the table in the image below categorizes the broad types of geospatial analysis. The upper right quadrantof the matrix identifies the ideal of GIS analysis as a Scientific Processin which there is good knowledge of the data and models surrounding an output. In the model, analysts understand the problem that confronts them and can take into account the key factors that bear on the problem. The notion of fixed-in-advance standard procedures typically plays an important role in such geospatial analysis.
However, many of the analytic tasks in geospatial intelligence fall outside of the scientific quadrant. Consider the Puzzle Solving Process (lower right) quadrant in which there is agreement on models, but disagreement on data. The notion of "foraging" for the data to solve the problem plays an important role in such analysis.
Analysis as an Opinion Process (upper left quadrant) is the opposite. In this analytic environment, there is agreement on data, but disagreement on model. Analysis is characterized by analysts involved in a struggle for influence, and decisions emerge from that struggle. This kind of analysis necessitates bargaining, accommodation, and consensus, as well as controversy. The bottom line is that conclusions are most often the result of bargaining between diverse and strongly held beliefs.
Intelligence analysis as a Heuristic Process (lower left quadrant) is the most contentious, with disagreement on data and models. Under these conditions, science and technology tools have significantly less direct relevance. Here, conclusions depend on parameters that change over the period the analysis is being made. As a consequence, the analytic process is experience-based. In the end, this is the framing of questions. They can only be framed, not solved, and thus the logic of argument and analysis is as important as the evidence.
Click to expand to provide more information
The "sensemaking" area within which the geospatial analyst works is the Puzzle Solving Process area.
| Model Fit - Low | Model Fit - High |
|---|---|
| Opinion Process ("strongly held beliefs") Data Certainty: high |
Scientific Process ("Ideal of Analysis") Data Certainty: high |
| Heuristic Process ("Framed by Experience") Data Certainty: low |
Puzzle Solving Process ("Foraging for Good Data") Data Certainty: high |
Is geospatial intelligence an art or science? Analytic problems can fall into any of the four quadrants ---- you, the analyst, need to understand the problem solving environment and the nature of the problem solving process. The term “sensemaking” is used as a term to describe the analysis process and incorporates traits associated with the classical definitions of both “art” and “science.” Sensemaking is more formally defined as the deliberate effort to understand events using explanatory structure that defines entities by describing their relationship to other entities. Data elicit and help to construct the frame; the frame defines, connects and filters the data.
Chapter 2 - Structured Geospatial Analytic Method (SGAM)
Chapter 2 Overview
Analysts learn by doing, and the best analysts learn from their mistakes. However, mistakes in intelligence work are dreaded, and one never wants to hear the words "intelligence failure." Intelligence failures are often disastrous, and lives may be lost. It is important, therefore, to constantly work at improving the mind and never accept old habits of thinking. Methods of thought have evolved with respect to intelligence analysis, but they appear to have largely excluded geospatial analytics.
Dr. Rob Johnston in his work Analytic Culture in the US Intelligence Community: An Ethnographic Study (2005) finds no baseline standard analytic method for the Intelligence Community. He also finds the validation of data is questionable, and there is much more emphasis on avoiding error than in-depth analysis. Overall, his research suggests the need for serious study of analytic methods in the communities of practice.
It has also been my experience that there is no baseline standard analytic method for geospatial analysis. The most common practice is to develop a workflow. If the results are reviewed, it is usually conducted as a limited peer review on the basis of previous workflows. This likely produces a bias toward confirming earlier views.
While we discuss critical thinking, the validation of input geospatial data is questionable. Dr. Rob Johnston also points out that none of the analytic agencies knows much about the analytic techniques of others, and there tends to be an over emphasis on writing and communication skills rather than on analytic methods.
Base Theory of SGAM
The Structured Geospatial Analytical Method (SGAM) is offered to solve the wicked problem of teaching the cognitive skills needed to approach geospatial analysis. The SGAM’s model is a first step utilizing a sequential process where progress is seen as flowing steadily through the steps. There are known disadvantages of such sequential process models. Foremost, the flow most probably does not represent the natural cognitive problem solving process. Further, the problems in one step are never solved completely and many problems regarding a particular step arise after the step is completed. Acknowledging these limitations, it is our argument that the SGAM’s simple approach is necessarily more understandable for the novice and, therefore, more effective in teaching inexperienced analysts. Rather than what the master analysts sees as a creative problem solving chaos (which by definition is unrepeatable and therefore unteachable), the SGAM model provides a teachable structured approach for the inexperienced analyst; a model that progresses linearly through discrete, easily understandable and explainable steps.
The method is based upon three stages and organized into two major loops. The three stages and associated outputs are:
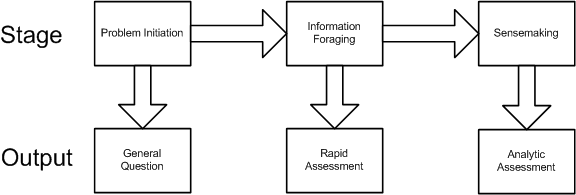
Analytic Stage 1: Problem Initiation. This stage broadly outlines the general analytic question.
Analytic Stage 2: Information foraging. This stage refines the general question to understand the geospatial aspects and results in the development of a rapid assessment based on informal methods or experience, and employing a form of trial and error iteration.
Analytic Stage 3: Sensemaking. This stage results in the development of a detailed analytic assessment utilizing an established methodology.
The two major loops are a:
- Foraging loop aimed at seeking information, searching and filtering it, and reading and extracting information.
- Sensemaking loop that involves iterative development of a mental model from the schema that best fits the evidence.
The foraging loop recognizes that analysts tended to forage for data by beginning with a broad set of data and then proceeded to narrow that set down into successively smaller, higher-precision sets of data, before analyzing the information (Pirolli,1999). The three foraging actions of exploring for new information, narrowing the set of items that have been collected, and exploiting items in the narrowed set trade off against one another under deadline or data overload constraints. It is important to note that much geospatial intelligence work never departs the foraging loop and simply consists of extracting information and repackaging it without much actual analysis and is in practice a rapid assessment of the question.
Sensemaking is the ability to make sense of an ambiguous situation; it is creating situational awareness and understanding in situations of high complexity or uncertainty in order to make decisions. It is "a motivated, continuous effort to understand connections (which can be among people, places, and events) in order to anticipate their trajectories and act effectively" (Klein, G., Moon, B. and Hoffman, R.F. 2006. Making sense of sensemaking. IEEE Intelligent Systems, 21(4), 70-73. ). When geospatial intelligence analysis departs the foraging loop and completes the sensemaking process, this yields an analytic assessment.
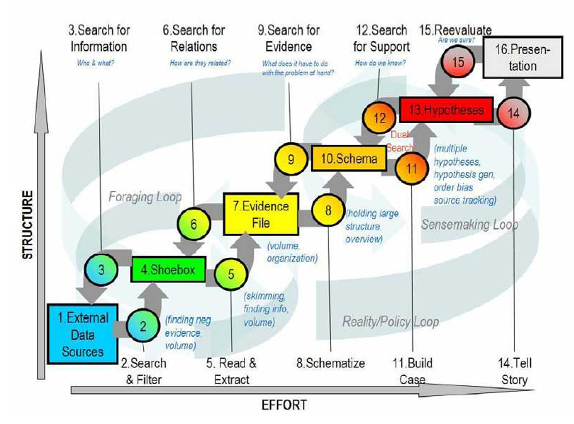
The below figure represents the Structured Geospatial Analytic Process derived from and incorporating aspects of both Heuer’s ACH and Pirolli and Card's sensemaking process. This is a generalized view of the geospatial analysis process that fits within the larger intelligence process. The rectangular boxes represent analytic activities. The arrows represent the flow from one activity to the next. The activities are arranged by degree of effort and degree of information structure. The overall analytic method has back loops. One set of activities focuses around finding information and another set of activities focuses on making sense of the information.
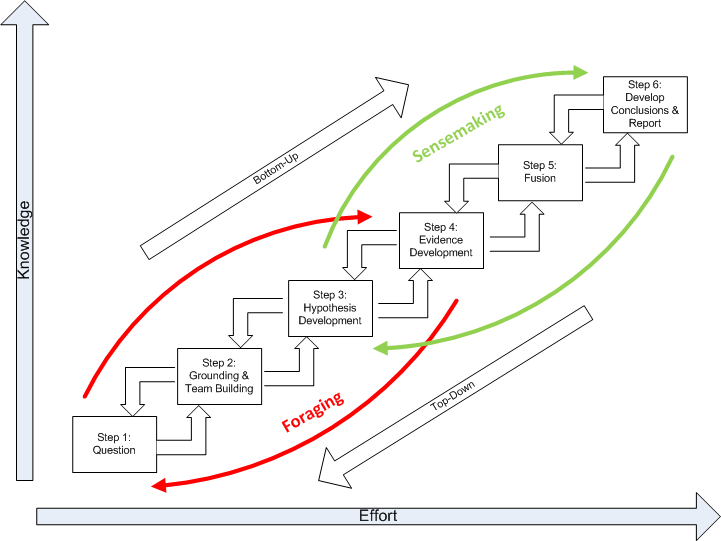
The diagram summarizes how an analyst comes up with new information. The data flow shows the transformation of information as it flows from raw information to reportable results through the following steps:
Question. Developing the question is a two-way interface between the client requiring information and the geospatial analyst supplying it.Critically, the question defines the broad nature of the spatial and temporal patterns the analyst is seeking to ultimately identify.
Grounding and Team Building. Grounding is the raw evidence that reaches the analyst. Grounding is building a potential repertoire of prototypical geospatial and temporal patterns from which a number of hypothetical (possible alternative) patterns will be selected. Step 2 is where the analytic team is formed.
Hypothesis Development. Hypotheses are the tentative representation of conclusions with supporting arguments. This step involves selecting all the reasonably possible geospatial and temporal patterns that might match the pattern envisioned during the development of your question.
Evidence Development. Evidence refers to snippets extracted from items discovered in the grounding. Development of the evidence includes developing and applying Schemas, which are the representation or organized marshaling of the information so that it can be used more easily to draw conclusions. This includes developing a smaller subset, which Pirolli and Card call the “shoebox”, of the data that are relevant for processing. Much of geospatial intelligence work never departs the foraging loop (Steps 1-4) and simply consists of extracting information and repackaging it without much actual analysis. In short, evidence is the development and accumulation of all facts to reject the hypothetical geospatial and temporal patterns determined in Step 3. GIS assists in the development and accumulation of the facts.
Fusion. The multi modal (graphical and text) nature of geospatial intelligence data analysis, which is used to reduce the influence of unreliable sources, is essentially a fusion process. Fusion in this step uses the ACH process to combine graphical and textual data, to achieve inferences, which will be more efficient and potentially more accurate than if they were achieved by means of a single source. Simply put, the fusion process is the comparing of the evidence to each hypothetical geospatial and temporal pattern to determine consistency.
Conclusions. The conclusion is a proposition about which hypothetical pattern(s) is (are) most consistent with the evidence and answers the question. Ultimately there is a presentation or other work product.
Basically, the data flow represents the converting of raw information into a form where expertise can apply, and then out to another form suited for communication. Information processing can be driven by bottom-up processes (from data to theory) or top-down (from theory to data). The bottom-up process is as described in steps 1 through 6. The top down process is slightly different in that it follows the sequence of:
- Evaluate conclusion. Inquiries from clients or indicators from signposts may generate re-evaluations of the current conclusions developed by an analyst. This may also require the marshaling of additional evidence to support or disconfirm the analysis or the generation and testing of alternative outcome.
- Deconstruct the synthesis. Reexamine the table of hypothesis and evidence beginning with the rankings.
- Examine the evidence. Reexamine collected evidence or search for new evidence. Search for nuggets of information that may suggest new geospatial or temporal patterns that generate hypotheses about plausible relations among entities and events.
- Re-evaluate the hypotheses. Looking for new hypotheses may generate new searches, further data extraction or a search for additional raw data.
- Question your grounding in the problem. New hypotheses may cause analysts to broaden their grounding in prototypical geospatial and temporal patterns.
- Question the question. Revalidate with the client the nature of the geospatial and temporal patterns the analyst is ultimately seeking to identify. Re-examine the process, use of tools, and quality.
Key Definitions and Concepts
A number of "ingredients" (concepts) have been used in the development of the Structured Geospatial Analysis Method "stew." It is difficult to understand how to apply the method without understanding the ingredients and their associated qualities. The following is a brief discussion of each ingredient for your general reference:
- critical thinking
- spatial thinking
- understanding spatial fallacies
- geospatial reasoning
- analytic methods
- geospatial analytic methods
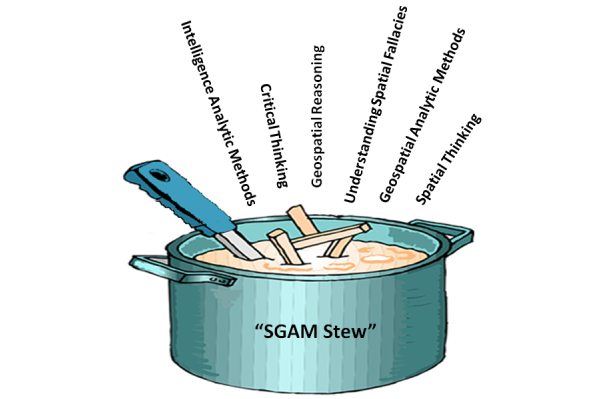
Recipe for SGAM Stew
Ingredients
- 1 tablespoon of critical thinking
- 1 1/2 pounds intelligence analytic methods
- 1/2 cup geospatial analytic methods
- 1/2 cup sliced understanding spatial fallacies
- 3 cups spatial thinking
- 1 cup geospatial reasoning
- salt and pepper, to taste
Preparation:
In a large saucepan brown the intelligence analytic method; add the geospatial analytic method and sauté for 3 to 5 minutes longer. Add reasoning and spatial thinking; bring to a boil. Reduce heat to low, cover, and simmer for 1 to 1 1/2 hours. Add geospatial reasoning; simmer for about 30 to 40 minutes longer, or until tender. Add drained critical thinking; continue cooking for 5 to 10 minutes.
In a small bowl or cup, combine additional spatial thinking and geospatial reasoning with cold water until smooth. Add the mixture to the simmering broth, a little at a time, until stew is thickened. Taste and add salt and pepper. Serve with hot buttered presentations.
Critical Thinking
There is a great deal of confusion about what critical thinking is and its relationship to an analytical method. Much of the confusion is because there are many definitions of critical thinking. According to Cohen and Salas (Marvin S. Cohen and Eduardo Salas, Critical Thinking: Challenges, Possibilities, and Purpose, March 2002), definitions in the literature suggest that a common core meaning exists, and one might define critical thinking as:
The deliberate evaluation of intellectual products in terms of an appropriate standard of adequacy.
Related to this definition is a theme of early philosophers, such as Descartes, Locke, Berkeley, and Hume, of the importance of challenging inherited and customary beliefs. In other words, to adopt not only a first-person, but also a second-person critical point of view. This imperative of doubting one’s own accepted beliefs is critical thinking. The early philosophers agreed on two things about critical thinking:
- Its purpose is to fulfill an ethical duty to think properly about whether to accept or reject each of our beliefs.
- A constraint on proper thinking about belief acceptance is that it must be based upon good evidence.
Initially evidence was regarded as sufficient only if it guaranteed the truth of a conclusion. Today, theorists acknowledge uncertainty about matters of fact and even about logic. The purpose of critical thinking is, therefore, now seen as to ensure a high probability of truth.
More recently, in 2002, Robert H. Ennis, Retired Director, Illinois Critical Thinking Project, wrote that, "Critical thinking is here assumed to be reasonable reflective thinking focused on deciding what to believe or do. This rough overall definition is, we believe, in accord with the way the term is generally used these days. Under this interpretation, critical thinking is relevant not only to the formation and checking of beliefs, but also to deciding upon and evaluating actions. It involves creative activities such as formulating hypotheses, plans, and counterexamples; planning experiments; and seeing alternatives. Furthermore, critical thinking is reflective -- and reasonable. The negative, harping, complaining characteristic that is sometimes labeled by the word 'critical' is not involved."
In his piece, Super-Streamlined Conception of Critical Thinking, Robert H. Ennis, points out that a critical thinker:
- is open-minded and mindful of alternatives;
- tries to be well-informed;
- judges well the credibility of sources;
- identifies conclusions, reasons, and assumptions;
- judges well the quality of an argument, including the acceptability of its reasons, assumptions, and evidence;
- can well develop and defend a reasonable position;
- asks appropriate clarifying questions;
- formulates plausible hypotheses; plans experiments well;
- defines terms in a way appropriate for the context;
- draws conclusions when warranted, but with caution; and
- integrates all items in this list when deciding what to believe or do.
Richard Paul has further defined it as:
Critical thinking is that mode of thinking – about any subject, content or problem – in which the thinker improves the quality of his or her thinking by skillfully taking charge of the structures inherent in thinking and imposing intellectual standards upon them. (Paul, Fisher and Nosich, 1993, p.4)
Alec Fisher, Critical Thinking: An Introduction, Cambridge University Press, points out that, "This definition draws attention to a feature of critical thinking on which teachers and researchers in the field seem to be largely agreed, that the only way to develop one's critical thinking ability is through 'thinking about one's thinking' (often called 'metacognition'), and consciously aiming to improve it by reference to some model of good thinking in that domain."
The essence is that critical thinking in geospatial intelligence is exemplified by asking questions about alternative possibilities in order to achieve some objective analysis rendering a high probability of the selected alternative being true.
Spatial Thinking
To paraphrase William Millwood, creating geospatial analysis requires transformations resulting from an intellectual endeavor that sorts the significant from the insignificant, assessing them severally and jointly, and arriving at a conclusion by the exercise of reasoned judgment. This endeavor when dealing with geospatial problems is geospatial reasoning, or an operation in which present facts suggest other facts. Geospatial reasoning creates an objective connection between our present geospatial beliefs and the evidence for believing something else.
Spatial thinking includes processes that support exploration and understanding. An expert spatial thinker visualizes relations, imagines transformations from one scale to another, mentally rotates an object to look at its other sides, creates a new viewing angle or perspective, and remembers images in places and spaces. Spatial thinking also allows us to externalize these operations by creating representations such as a map.
Spatial thinking begins with the ability to use space as a framework. An object can be specified relative to the observer, to the environment, to its own intrinsic structure, or to other objects in the environment. Each instance requires the adoption of specific spatial frames of reference or context. The process of interpretation begins with data which is generally context-free numbers, text, or symbols. Information is derived from data by implying some degree of selection, organization, and preparation for a purpose — in other words, the data is placed into a spatial context. For example, the elevation at a specific location is an example of data; however, the elevation only has meaning when placed in context of sea level. The spatial context is critical because it is the space the data is in that ultimately determines its interpretation. There are three spatial contexts within which we can make the data-to-information transition; these include life spaces, physical spaces, and intellectual spaces. In all cases, space provides an interpretive context that gives meaning to the data.
- Life space is the four-dimensional space-time where spatial thinking is a means of coming to grips with the spatial relations between self and objects in the physical environment. This is cognition in space and involves thinking about the world in which we live. It is exemplified by navigation and the actions that we perform in space.
- Physical space is also built on the four-dimensional world of space-time, but focuses on a scientific understanding of the nature, structure and function of phenomena. This is cognition about space and involves thinking about the ways in which the "world" works. An example might be how an earthquake creates a tsunami.
- Intellectual space is in relationship to concepts and objects that are not in and of themselves necessarily spatial, but the nature of the space is defined by the particular problem. This is cognition with space and involves thinking with or through the medium of space in the abstract. An example might be the territorial dispute between two ethnic groups.
Learning to think spatially is to consider objects in terms of their context. This is to say, the object's location in life space, physical space, or intellectual space, to question why objects are located where they are, and to visualize relationships between and among these objects. The key skills of spatial thinking include the ability to:
- Understand the context. The significance of context was discussed above, but it is important to say that if the data upon which the decision is based are placed into the wrong spatial context, for example, life space rather than intellectual space, it is likely the analysis will be flawed.
- Recognize spatial schemes (patterns and shapes). The successful spatial thinker needs to retain an image of the simple figure in mind, and look for it by suppressing objects irrelevant to a task at hand. This ability allows a geospatial analyst to identify patterns of significance in a map, such as an airfield.
- Recall previously observed objects. The ability to recall an array of objects that was previously seen is called object location memory.
- Integrate observation-based learning. Synthesizing separately made observations into an integrated whole. The expert analyst moves through the data, gathering information from separately observed objects and views, and integrates this information into a coherent mental image of the area.
- Mental rotating an object and envisioning scenes from different viewpoints. The ability to imagine and coordinate views from different perspectives has been identified by Piaget and Inhelder (1967) as one of the major instances of projective spatial concepts. Mental-rotation ability or perspective-taking ability could be relevant to those analysis tasks that involve envisioning what an object, such as a building, would look like if seen from another position.
Golledge’s First-Order Primitives constitute a broad list of cognitive schemes for geospatial analysis (R. G. Golledge "Do People Understand Spatial Concepts: The case of First-Order Primitives", Theories and Models of Spatio-Temporal Reasoning in Geographic Space. Pisa: Springer-Verlag, 1992). The schemas are:
- Location. This includes a descriptor with identity, magnitude, location and time. An additional cognitive component might be familiarity. Occurrences are often called environmental cues, nodes, landmarks, or reference points.
- Spatial distributions. Distributions have a pattern, a density, and an internal measure of spatial variance, heterogeneity or dispersion; occurrences in distributions also have characteristics such as proximity, similarity, order, and dominance.
- Regions. Areas of space in which either single or multiple features occur with specified frequency (uniform regions) or over which a single feature dominates.
- Hierarchies. Multiple levels or nested levels of phenomena including features.
- Networks. Linked features having characteristics, connectivity, centrality, diameter, and density. Networks may also include physical links such as transportation systems, or non-visual systems.
- Spatial associations. Associations include spatial autocorrelation, distance decay, and contiguities. Examples of these associations include interaction frequencies or geographic and areal associations. For example, the coincidence of features within specific areas (i.e., squirrels are normally near trees) is a spatial association.
- Surfaces. There are generalizations of discrete phenomena, including densities of occurrence, flows over space and through time (as in the spatial diffusion of information or phenomena).
Geospatial Reasoning
Reasoning
The three well known reasoning processes trace the development of analytic beliefs along different paths. Inductive reasoning reveals “that something is probably true," deductive reasoning demonstrates “that something is necessarily true.” It is generally accepted within the intelligence community that both are limited: inductive reasoning leads to multiple, equally likely solutions, and deductive reasoning is subject to deception. Therefore, a third aid to judgment, abductive reasoning, showing “that something is plausibly true,” is used to offset the limitations of the others. While analysts who employ all three guides to sound judgment stand to be the most persuasive, fallacious reasoning or mischaracterization of rules, cases, or results in any of the three can affect reasoning using the others.
- Inductive reasoning, moving from the specific case to the general rule, suggests many possible outcomes, or the range of what might happen in the future. However, inductive reasoning lacks a means to distinguish among outcomes. An analyst has no way of knowing whether a solution is correct.
- Deductive reasoning, on the other hand, moves from the general to the specific. Deductive reasoning becomes essential for predictions. Based on past perceptions, certain facts indicate specific outcomes. If, for example, troops are deployed to the border, communications are increased, and leadership is in defensive bunkers, then war is imminent. However, if leadership remains in the public eye, then these preparations indicate that an exercise is imminent.
- Abductive reasoning reveals plausible outcomes. Abductive reasoning is the process of generating the best explanation for a set of observations. When actions defy accurate interpretation through existing paradigms, abductive reasoning generates novel means of explanation. In the case of predictions, an abductive process presents an “assessment of probabilities.” Although abduction provides no guarantee that the analyst has chosen the correct hypothesis, the probative force of the accompanying argument indicates that the most likely hypothesis is known and that actionable intelligence is being developed.
Geospatial Reasoning
It is not too far of a stretch to say that people who are drawn to the discipline of geospatial intelligence have minds accustomed to assembling information into three-dimensional mental schemas. We construct schemas in our mind, rotate them, and view them from many angles. Furthermore, the experienced geospatial professional imagines spatial schemas influenced in the fourth dimension, time. We mentally replay time series of the schema. So easy is the geospatial professional’s ability to assemble multidimensional models that the expert does it with incomplete data. We mentally fill in gaps, making an intuitive leap toward a working schema with barely enough data to perceive even the most rudimentary spatial patterns. This is a sophisticated form of geospatial reasoning. Expertise increases with experience because as we come across additional schemas, our mind continuously expands to accommodate them. This might be called spatial awareness. Being a visual-spatial learner, instead of feeling daunted by the abundance and complexity of data, we find pleasure in recognizing the patterns. Are we crazy? No, this is what is called a visual-spatial mind. Some also call these people right brain thinkers.
The concept of right brain and left brain thinking developed from the research of psychobiologist Roger W. Sperry. Sperry discovered that the human brain has two different ways of thinking. The right brain is visual and processes information in an intuitive and simultaneous way, looking first at the whole picture then the details. The left brain is verbal and processes information in an analytical and sequential way, looking first at the pieces then putting them together to get the whole. Some individuals are more whole-brained and equally adept at both modes.
The qualities of the Visual-Spatial [4] person are well documented but not well known . Visual-spatial thinkers are individuals who think in pictures rather than in words. They have a different brain organization than sequential thinkers. They are whole-part thinkers who think in terms of the big picture first before they examine the details. They are non-sequential, which means that they do not think and learn in the step-by-step manner. They arrive at correct solutions without taking steps. They may have difficulty with easy tasks, but show a unique ability with difficult, complex tasks. They are systems thinkers who can orchestrate large amounts of information from different domains, but they often miss the details.
Sarah Andrews [5] likens some contrasting thought processes to a cog railway. Data must be in a set sequence in order to process it through a workflow. In order to answer a given question, the thinker needs information fed to him in order. He will apply a standardized method towards arriving at a pragmatic answer, check his results, and move on to the next question. In order to move comfortably through this routine, he requires that a rigid set of rules be in place. This is compared with the geospatial analyst who grabs information in whatever order, and instead of crunching down a straight-line, formulaic route toward an answer, makes an intuitive, mental leap toward the simultaneous perception of a group of possible answers. The answers may overlap, but none are perfect. In response to this ambiguity, the geospatial analyst develops a risk assessment, chooses the best working answer from this group, and proceeds to improve the estimate by gathering further data. Unlike, the engineer, whose formulaic approach requires that the unquestioned authority of the formula exist in order to proceed, the geospatial intelligence professional questions all authority, be it in the form of a human or acquired data.
Analytic Methods in General
It is Sherman Kent, who has been described as the "father of intelligence analysis", that is often acknowledged as first proposing an analytic method specifically for intelligence. [6] The essence of Kent’s method was understanding the problem, data collection, hypotheses generation, data evaluation, more data collection, followed by hypotheses generation (Kent, S. 1949, Strategic intelligence for American world policy, Princeton University Press, Princeton, NJ.).
Richards Heuer subsequently proposed an ordered eight step model of “an ideal” analytic process, emphasizing early deliberate generation of hypotheses prior to information acquisition (Heuer, R. 1981, "Strategies for analytical judgment," Studies in Intelligence, Summer, pp. 65-78.):
- Definition of the analytical problem
- Preliminary hypotheses generation
- Selective data acquisition
- Refinement of the hypotheses and additional data collection
- Data intervention and evaluation
- Hypotheses selection
- Continued monitoring
Heuer’s technique has become known as Analysis of Competing Hypotheses (ACH). The technique entails identifying possible hypotheses by brainstorming, listing evidence for and against each, analyzing the evidence and then refining hypotheses, trying to disprove hypotheses, analyzing the sensitivity of critical evidence, reporting conclusions with the relative likelihood of all hypotheses, and identifying milestones that indicate events are taking an unexpected course. The use of brainstorming is critical since the quality of the hypotheses is dependent on the existing knowledge and experience of the analysts, since hypotheses generation occurs before additional information acquisition augments the existing knowledge of the problem. ACH is widely cited in the intelligence literature as a means for improving analysis. The primary advantage of ACH is a consistent approach for rejection or validation of many potential conclusions (or hypotheses).
Heuer acknowledges how mental models, or mind sets, are essentially the re-representations of how analysts perceive information (Heuer, Richards J. Jr. & Center for the Study of Intelligence 1999, Psychology of intelligence analysis, Center for the Study of Intelligence, Central Intelligence Agency, Washington, DC.). Even though every analyst sees the same piece of information, it is interpreted differently due to a variety of factors (past experience, education, and cultural values to name merely a few). In essence, one's perceptions are morphed by a variety of factors that are completely out of the control of the analyst. Heuer sees mental models as potentially good and bad for the analyst. On the positive side, they tend to simplify information for the sake of comprehension, but they also obscure genuine clarity of interpretation.
ACH has evolved into an eight-step procedure based upon cognitive psychology, decision analysis, and the scientific method. It is believed to be particularly appropriate for establishing an audit trail to show what an analyst considered and how they arrived at their judgment. (Heuer, Richards J. Jr. & Center for the Study of Intelligence 1999, Psychology of intelligence analysis, Center for the Study of Intelligence, Central Intelligence Agency, Washington, DC.).
Heuer’s approach is the prevailing view of the analysis process. Figure 1 by the 2002 Joint Military Intelligence College (JMIC) illustrates the integration of the fundamentals of ACH into the intelligence process (Waltz, E. 2003, Toward a MAUI NITE intelligence analytic process model, Veridian Systems, Arlington, VA.).
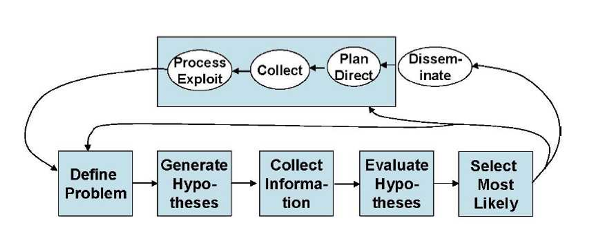
Figure 1 is particularly significant since it shows the intelligence cycle steps of:
- planning and direction,
- collection,
- processing,
- analysis, and
- dissemination
Which incorporates the following analytic process steps within the analysis steps:
- define the problem,
- develop hypotheses,
- collect information,
- evaluate hypotheses, and
- select the most likely alternative.
Since Heuer’s development of ACH, another model of the intelligence analysis process is proposed by Pirolli in 2006 which was derived from the results of a cognitive task analysis of intelligence analysts (Pirolli, P.L. 2006, Assisting people to become independent learners in the analysis of intelligence: final technical report, Palo Alto Research Center, Inc., Palo Alto, CA.). The analytic process is described as “A Notional Model of Analyst Sensemaking,” with the cognitive task analysis indicating that the bottom-up and top-down processes shown in each loop are “…invoked in an opportunistic mix.” (Pirolli, P. & Card, S.K. 2006, The sensemaking process and leverage points for analyst technology identified through cognitive task analysis, Palo Alto Research Center, Inc., Palo Alto, CA.). Figure 2 illustrates this process./p>
The term “sensemaking” is used as a term to describe the analysis process.Sensemaking is defined “…as the deliberate effort to understand events,” describing the elements of sensemaking using the terms “data” and “frame.” A frame is “…an explanatory structure that defines entities by describing their relationship to other entities” (Klein, G., Phillips, J.K., Rall, E.L. & Peluso, D.A. 2007, "A data-frame theory of sensemaking" in Expertise out of context, ed. R.R. Hoffman, pp. 113-15). The Klein article further explains that “The data identify the relevant frame, and the frame determines which data are noticed. Neither of these comes first. The data elicit and help to construct the frame; the frame defines, connects and filters the data.”
Pirolli and Card contend that many forms of intelligence analysis are sensemaking tasks. As figure 2 illustrates, such sensemaking tasks consist of information gathering, re-representation of the information in a schema that aids analysis, the development of insight through the manipulation of this representation, and the creation of some knowledge based on the insight. The analyst proceeds through the process of:
They also suggested that the process may be reversed to:
In other words, in terms of Figure 2, the process can be a mix: top-down and/or bottom-up.
Schemas are the re-representation or organized marshaling of the information so that it can be used more easily to draw conclusions. Pirolli and Card note that the re-representation “may be informally in the analyst’s mind or aided by a paper and pencil or computer-based system” (Pirolli, P. & Card, S.K. 2006, The sensemaking process and leverage points for analyst technology identified through cognitive task analysis, Palo Alto Research Center, Inc., Palo Alto, CA.).
Geospatial Analytic Methods
Geospatial Preparation of the Environment (GPE)
- The geospatial intelligence preparation of the environment (GPE) analytic method is based on the intelligence cycle and process. According to the National Geospatial-Intelligence Agency(NGA) [7], the steps are:
- 1. Define the Environment: Gather basic facts needed to outline the exact location of the mission or area of interest. Physical, political, and ethnic boundaries must be determined. The data might include grid coordinates, latitude and longitude, vectors, altitudes, natural boundaries (mountain ranges, rivers, shorelines), etc. This data serves as the foundation for the GEOINT product.
- 2. Describe Influences of the Environment: Provide descriptive information about the area defined in Step 1. Identify existing natural conditions, infrastructure, and cultural factors. Consider all details that may affect a potential operation in the area: weather, vegetation, roads, facilities, population, languages, social, ethnic, religious, and political factors. Layer this information onto the foundation developed in Step 1.
- 3. Assess Threats and Hazards: Add intelligence and threat data, drawn from multiple intelligence disciplines, onto the foundation and descriptive information layers (the environment established in the first two steps). This information includes: order-of-battle; size and strength of enemy or threat; enemy doctrine; nature, strength, capabilities and intent of area insurgent groups; effects of possible chemical/biological threats. Step 3 requires collaboration with national security community counterparts.
- 4. Develop Analytic Conclusions: Integrate all information from Steps 1-3 to develop analytic conclusions. The emphasis is on developing predictive analysis. In Step 4, the analyst may create models to examine and assess the likely next actions of the threat, the impact of those actions, and the feasibility and impact of countermeasures to threat actions.
PPDAC: Problem, Plan, Data, Analysis, and Conclusions
De Smith and Goodchild [8] examined geospatial analysis process in the broader context of analytical methodologies. The typical process of geospatial analysis typically follows a number of well-defined and iterative stages:
- problem formulation;
- planning;
- data gathering;
- exploratory analysis;
- hypothesis formulation;
- modeling;
- consultation and review; and
- ultimately, final reporting and/or implementation.
In the whole, geospatial analysis can be seen as part of a decision process and support infrastructure. The process from problem specification to outcome is, in reality, an over-simplification, and the analytical process is more complex and iterative than the steps suggest. GIS and related software tools that perform analytical functions only address data gathering, analysis, and modeling. As de Smith and Goodchild point out, the flow from start to finish is rarely the case. Not only is the process iterative, but at each stage one often looks back to the previous step and re-evaluates the validity of the decisions made. Mackay and Oldford in de Smith and Goodchild [9]described a spatial analysis method in terms of a sequence of steps labeled PPDAC: Problem; Plan; Data; Analysis; and Conclusions. The PPDAC approach is shown in the below figure.
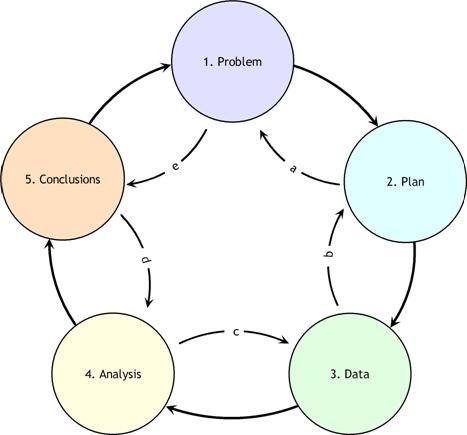
As can be seen from the diagram, although the clockwise sequence (1→5) applies as the principal flow, each stage may, and often will, feed back to the previous stage. In addition, it may well be beneficial to examine the process in the reverse direction, starting with Problem definition and then examining expectations as to the format and structure of the Conclusions. This procedure then continues, step-by-step, in an anti-clockwise manner (e→a) determining the implications of these expectations for each stage of the process.
PPDAC develops evidence. Evidence, in the context of this discussion, refers to the information that is gathered by exploratory analysis of spatial and temporal data. These methods include remote sensing and GIS to develop intermediate products. "Exploratory data analysis (EDA) is about detecting and describing patterns, trends, and relations in data, motivated by certain purposes of investigation. As something relevant is detected in data, new questions arise, causing specific parts to be viewed in more detail. So EDA has a significant appeal: it involves hypothesis generation rather than mere hypothesis testing" (Exploratory Analysis of Spatial and Temporal Data, Springer, 2006). Ultimately, what is evidence is defined by the intelligence producer. Ideally, "evidence" in the context of the framework of the problem should include: the context and the scientific and intuitive evidence.
Understanding Spatial Fallacies
Complex issues in spatial analysis lead to bias, distortion and errors. These issues are often interlinked but various attempts have been made to separate out particular issues from each other. Here is a brief list:
Known Length - Lengths in earth measurement depend directly on the scale at which they are measured and experienced. So while we measure the length of a river, streetet cetera, this length only has meaning in the context of the relevance of the measuring technique to the question under study.
Locational Fallacy - The locational fallacy refers to error due to the particular spatial characterization chosen for the elements of study, in particular choice of placement for the spatial presence of the element. Spatial characterizations may be simplistic or even wrong. Studies of humans often reduce the spatial existence of humans to a single point, for instance their home address. This can easily lead to poor analysis, for example, when considering disease transmission which can happen at work or at school and therefore far from the home. The spatial characterization may implicitly limit the subject of study. For example, the spatial analysis of crime data has recently become popular but these studies can only describe the particular kinds of crime which can be described spatially. This leads to many maps of assault but not to any maps of embezzlement with political consequences in the conceptualization of crime and the design of policies to address the issue.
Atomic Fallacy - This describes errors due to treating elements as separate 'atoms' outside of their spatial context.
Ecological Fallacy - The ecological fallacy describes errors due to performing analyses on aggregate data when trying to reach conclusions on the individual units. It is closely related to the modifiable areal unit problem.
Modifiable areal unit problem - The modifiable areal unit problem (MAUP) is an issue in the analysis of spatial data arranged in zones, where the conclusion depends on the particular shape or size of the zones used in the analysis. Spatial analysis and modeling often involves aggregate spatial units such as census tracts or traffic analysis zones. These units may reflect data collection and/or modeling convenience rather than homogeneous, cohesive regions in the real world. The spatial units are therefore arbitrary or modifiable and contain artifacts related to the degree of spatial aggregation or the placement of boundaries. The problem arises because it is known that results derived from an analysis of these zones depends directly on the zones being studied. It has been shown that the aggregation of point data into zones of different shapes and sizes can lead to opposite conclusions. More detail is available at the modifiable areal unit problem topic entry.
Memory Aid
Spatial thinking is the essence of Geospatial Intelligence. Spatial thinking is thinking that finds meaning in the shape, size, orientation, location, direction or trajectory, of objects, processes or phenomena, or the relative positions in space of multiple objects, processes or phenomena. Geospatial thinking is spatial thinking related to the earth. An expert geospatial thinker (NAP, 2006, p. 3):
- Identifies spatial patterns within the context of life, physical, and intellectual space by examining the fundamental spatial aspects, qualities, and relationships
- Recalls similar spatial patterns
- Performs mental transformations to compare the patterns
- Assigns meaning and significance to the patterns with respect to earth phenomena
The following geospatial thinking process is simply offered as a structure to make sure that key concepts are not overlooked. Nothing here is likely new to the skilled geospatial thinker, but it is purely a reminder of the actions that can help the analyst think about geospatial problems.
Action 1: Identify the entity. This entity can be natural and human phenomena relative to the problem. For example, the DC Shooter case.
Action 2: Think about the entity in the space contexts. The definition of the spatial presence of an entity is the prerequisite for spatial thinking. The spatial context is critical because it is the space the entity is in that ultimately determines its interpretation. There are three spatial contexts within which we can make the data-to-information transition. These are:
- life space
- physical space
- intellectual space
In all cases, space provides an interpretive context that gives meaning to the data.
- Life space, or behavioral environment, is the four-dimensional space-time that provides the means of coming to grips with the spatial relations between self and objects in the physical environment. This is cognition in space and involves thinking about the world in which we live. It is exemplified by navigation and the actions that we perform in space. An example is how the DC sniper navigates through a neighborhood.
- Physical space is the four-dimensional space-time that focuses on a scientific understanding of the nature, structure, and function of phenomena. This is cognition about space and involves thinking about the ways in which the "world" works. An example is the scientific understanding of the geometry of a rifle’s projectile and how an intervening building shields a shooter’s target.
- Intellectual space is in relationship to concepts and objects that are not in and of themselves necessarily spatial, but the nature of the space is defined by the particular problem. This is cognition with space and involves thinking with or through the medium of space in the abstract. For example, Rossmo’s (1997) “hunters” who are those criminals that specifically set out from their residence to look for victims, searching through the areas in their awareness spaces that they believe contain suitable targets.
Action 3: Place the phenomena in the context of the earth. When making sense about the space (Gershmehl and Gershmehl, 2006) the spatial thinker first asks the fundamental spatial questions:
- Where is this place?
- What is at this place?
- How is this place linked to other places?
Examples are:
- The shooting occurred at Y.
- Y is the location of a gas station.
- Y is 5 miles from where event X occurred.
Action 4: Examine the qualities of the objects or events. The spatial thinking then proceeds to examine the places by asking the following questions:
- How are places similar or different?
- What effect(s) does a feature have on nearby areas?
- What nearby places are similar to each other and can be grouped together?
- Where does this place fit in a hierarchy of nested areas?
- Is the change between places abrupt, gradual, or irregular?
- What distant places have similar situations and therefore may have similar conditions?
- Are there clusters, strings, rings, waves, other non-random arrangements of features?
- Do features tend to occur together (have similar spatial patterns)?
For example, the DC shootings occurred at gas station near entrances to high speed highways. Note or remember the qualities. Return to Action 2 if you have not explored all of the space contexts.
Action 5: Recalling the results of Action 4, examine the space-time relationship between the objects and/or event. Last, the comparisons are placed into the context of space and time. Spatial thinking goes beyond a simple identification of locations. It involves comparing locations, considering the influence of nearby features, grouping regions and hierarchies, and identifying distant places that have similar conditions. It is also the consideration of change, movement and diffusion through time and place. This is spatiotemporal thinking which asks the questions:
- How do spatial features change through time?
- How do conditions change at a place over time?
- What is the change in position of something over time?
- What is the change in extent of something over time?
- Where are places that do not seem to follow an observed “rule”?
For example, the DC Sniper pattern of events seems to be spatially random. Note or remember the time-space relationships.
Action 6: Recalling the results of Actions 4 and 5. Think through your past results or lists you created.
Action 7: Transform the patterns while searching for similar spatial patterns. This is the ability to imagine and reason about objects and their spatial layout. Mental transformations that are important to geospatial intelligence cognition are: object-based spatial transformations and egocentric perspective transformations. Object-based transformations are imagined rotations or translations of objects relative to the reference frame of the environment. Egocentric perspective transformations are imagined rotations or translations of one’s point-of-view relative to that reference frame. For example, to retrieve what is on the other side of the grocery aisle you might imagine the aisle rotating or ourselves moving relative to the aisle. Another example is the mentally transforming Rossmo’s (1997) “hunters” pattern to match the observed the DC Sniper’s pattern.
Action 8: Compare qualities and relationships. A primary cognitive function of the geospatial analysts is determining the spatial relationships between features. The patterns representing prototypical hospital, school, or housing development is an example of comparing spatial relationship. For example, Rossmo’s “hunters” yields a donut-like geospatial pattern but the pattern exhibited by the DC sniper is largely random.
Action 9: Assign meaning. Interpreting and understanding a pattern is a complex reasoning process since the human mind is functioning symbolically where the human mind assigns meaning based on experience, consciousness, beliefs, and emotions. This is not direct knowledge and the symbolism is very fallible. For example, the DC Sniper’s patterns might not conform to Rossmo’s “hunters” modus operandi and there could be other valid alternative meanings assigned to the observed patterns.
Chapter 3 - Structured Analytic Techniques
Chapter 3 Overview
Geospatial analysis can be very difficult to do well. Much of the difficulty is cognitive and not related to an individual's ability to use the technical tools, i.e., GIS. It takes far greater mental agility than gathering evidence supporting a single hypothesis that was pre-judged as the most likely answer. To develop and retain multiple spatial schemes in working memory and note how each item of information fits into each hypothesis is beyond the mental capabilities of most analysts. (Note: Working memory tasks include the active monitoring or manipulation of information or behaviors.)
Moreover, truly good geospatial analysis requires monitoring your progress, making changes and adapting the ways you are thinking. It is about self-reflection, self-responsibility, and initiative to achieve the analytic results within the time allotted. This mental agility can be accomplished with the help of a few simple thinking tools discussed here.
Challenging Mindsets
Heuer makes three important points relative to intelligence in his work, the Psychology of Intelligence Analysis [1].
- Human minds are ill equipped ("poorly wired") to cope effectively with both inherent and induced uncertainty.
- Increased knowledge of one's own inherent biases tends to be of little assistance to the analyst.
- Tools and techniques that apply higher levels of critical thinking can substantially improve analysis of complex problems.
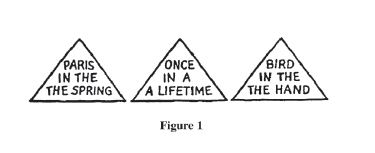
He provides the following series of images to illustrate how poorly we are cognitively equipped to accurate interpret the world.
Question #1: What did you see in the figure? The answer is at the bottom of this page.
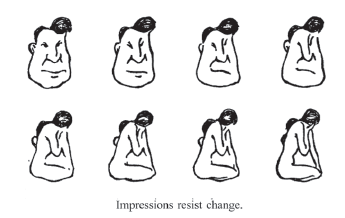
Question #2: Look at the drawing of the man in the upper right. Are the drawings all of men? The answer is at the bottom of this page.
Question #3: What do you see—an old woman or a young woman? The answer is at the bottom of this page.
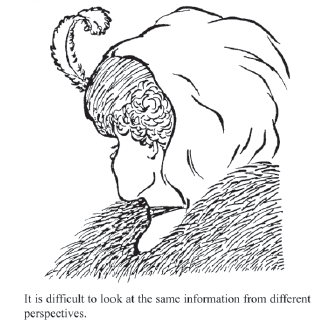
Now look to see if you can reorganize the drawing to form a different image of a young woman, if your original perception was of an old woman, or of the old woman if you first perceived the young one.
According to Heuer, and as the above figures illustrate, mental models, or mindsets, or cognitive patterns are essentially the analogous image by which people perceive information. Even though every analyst sees the same piece of information, it is interpreted differently due to a variety of factors. In essence, one's perceptions are morphed by a variety of factors that are completely out of the control of the analyst. Heuer sees these cognitive patterns ;as potentially good and bad for the analyst. On the positive side, they tend to simplify information for the sake of comprehension but they also bias interpretation. The key risks of mindsets are that:
- analysts perceive what they expect to perceive;
- once formed, they are resistant to change;
- new information is assimilated, sometimes erroneously, into existing mental models; and
- conflicting information is often dismissed or ignored.
Therefore, since all people observe the same information with inherent and different biases, Heuer believes an effective analysis method needs a few safeguards. The analysis method should:
- encourage products that clearly show their assumptions and chains of inferences; and
- emphasize procedures that expose alternative points of view.
What is required of analysts is a process for challenging, refining, and challenging their own working mental models. This is a key component of his Structured Analytic Techniques (SATs), which include Analysis of Competing Hypotheses.
These problems notwithstanding, cognitive patterns are critical to allowing individuals to process what otherwise would be an incomprehensible volume of information. Yet, they can cause analysts to overlook, reject, or forget important incoming or missing information that is not in accord with their assumptions and expectations. Seasoned analysts may be more susceptible to these mindset problems as a result of their expertise and past success in using time-tested mental models.
Answers
Answer #1: The article is written twice in each of the three phrases. This is commonly overlooked because perception is influenced by our expectations about how these familiar phrases are normally written.
Answer #2: The above figure illustrates that mind-sets tend to be quick to form but resistant to change by showing part of a longer series of progressively modified drawings that change almost imperceptibly from a man into a woman. The right-hand drawing in the top row, when viewed alone, has equal chances of being perceived as a man or a woman.
Answer #3: The old woman’s nose, mouth, and eye are, respectively, the young woman’s chin, necklace, and ear. The old woman is seen in profile looking left. The young woman is also looking left, but we see her mainly from behind so most facial features are not visible. Her eyelash, nose, and the curve of her cheek may be seen just above the old woman’s nose.
The Structured Analytic Techniques "Toolbox"
Structured analytic techniques are simply a "box of tools" to help the analyst mitigate the adverse impact on analysis of one's cognitive limitations and pitfalls. Taken alone, they do not constitute an analytic method for solving geospatial analytic problems. The most distinctive characteristic is that structured techniques help to decompose one's geospatial thinking in a manner that enables it to be reviewed, documented, and critiqued. "A Tradecraft Primer: Structured Analytic Techniques for Improving Intelligence Analysis [10]" (CIA, 2009) highlights a few structured analytic techniques used in the private sector, academia, and the intelligence profession.
Structured thinking in general and structured geospatial thinking specifically is at variance with the way in which the human mind is in the habit of working. Most people solve geospatial problems intuitively by trial and error. Structured analysis is a relatively new approach to intelligence analysis with the driving forces behind the use of these techniques being:
- an increased understanding of cognitive limitations and pitfalls that make intelligence analysis difficult;
- prominent intelligence failures that have prompted reexamination of how intelligence analysis is generated;
- DNI policy support and technical support for interagency collaboration; and
- a desire by policy makers who receive analysis that it be more transparent as to how conclusions were reached.
In general, the Intelligence Community began focusing on structured techniques because analytic failures led to the recognition that it had to do a better job overcoming cognitive limitations, analytic pitfalls, and addressing the problems associated with mindsets. Structured analytic techniques help the mind think more rigorously about an analytic problem. In the geospatial realm, they ensure that our key geospatial assumptions, biases, and cognitive patterns are not just assumed correct but are well considered. The use of these techniques later helps to review the geospatial analysis and identify the cause of any error.
Moreover, structured techniques provide a variety of tools to help reach a conclusion. Even if both intuitive and scientific approaches provide the same degree of accuracy, structured techniques have value in that they can be easily used to balance the art and science of their analysis. It is clear is that structured methodologies are severely neglected by the geospatial community. Even in the rare cases where a specific technique is used, no one technique is appropriate to every step of the problem solving process.
There are two ways to view the nature of these techniques. Heuer categorized structured techniques by how they help analysts overcome human cognitive limitations or pitfalls to analysis. Heuer's grouping is as follows:
- Decomposition and Visualization: The number of things most people can keep in working memory at one time is seven, plus or minus two. Complexity increases geometrically as the number of variables increases. In other words, it is very difficult to do error-free analysis only in our heads. The two basic tools for coping with complexity in the analysis are to: (1) break things down into their component parts, so that we can deal with each part separately, and (2) put all the parts down on paper or a computer screen in some organized manner such as a list, matrix, map, or tree so that we and others can see how they interrelate as we work with them. Many common techniques serve this purpose.
- Indicators, Signposts, Scenarios: The human mind tends to see what it expects to see and to overlook the unexpected. Change often happens so gradually that we do not see it, or we rationalize it as not being of fundamental importance until it is too obvious to ignore. Identification of indicators, signposts, and scenarios create an awareness that prepares the mind to recognize change.
- Challenging Mindsets: A simple definition of a mindset is “a set of expectations through which a human being sees the world.” Our mindset, or mental model of how things normally work in another country, enables us to make assumptions that fill in the gaps when needed evidence is missing or ambiguous. When this set of expectations turns out to be wrong, it often leads to intelligence failure. Techniques for challenging mindsets include reframing the question in a way that helps break mental blocks, structured confrontation such as devil’s advocacy or red teaming, and structured self-critique such as what we call a key assumption check. In one sense, all structured techniques that are implemented in a small team or group process also serve to question your mindset. Team discussions help us identify and evaluate new evidence or arguments and expose us to diverse perspectives on the existing evidence or arguments.
- Hypothesis Generation and Testing: “Satisficing” is the tendency to accept the first answer that comes to mind that is “good enough.” This is commonly followed by confirmation bias, which refers to looking at the evidence only from the perspective of whether or not it supports a preconceived answer. These are among the most common causes of intelligence failure. Good analysis requires identifying, considering, and weighing the evidence both for and against all the reasonably possible hypotheses, explanations, or outcomes. Analysis of Competing Hypotheses is one technique for doing this.
- Group Process Techniques: Just as analytic techniques provide structure to our individual thought processes, they also provide structure to the interaction of analysts within a team or group. Most structured techniques are best used as a collaborative group process, because a group is more effective than an individual in generating new ideas and at least as effective in synthesizing
divergent ideas. The structured process helps identify differences in perspective between team or group members, and this is good. The more divergent views are available, the stronger the eventual synthesis of these views. The specific techniques listed under this category, such as brainstorming and Delphi, are designed as group processes and can only be implemented in a group.
Others have grouped techniques by their purpose:
- Diagnostic techniques are primarily aimed at making analytic arguments, assumptions, or intelligence gaps more transparent;
- Contrarian techniques explicitly challenge current thinking; and
- Imaginative thinking techniques aim at developing new insights, different perspectives and/or develop alternative outcomes. In fact, many of the techniques will do some combination of these functions.
These different groupings of the techniques notwithstanding, the analysts should select the technique that best accomplishes the specific task they set out for themselves. The techniques are not a guarantee of analytic precision or accuracy of judgments; they do improve the usefulness, sophistication, and credibility of intelligence assessments.
SATs and Geospatial Operations
It is often difficult for an analyst to determine the next step in an analytic process or to visualize how various techniques and tools fit together. Using the below as a list of the common GIS operations, the analyst might use:
- data entry;
- data conversion;
- data validation;
- spatial data management;
- attribute data management;
- data visualization;
- data processing/analysis and
- output of maps and reports.
The Structured Geospatial Analytic Method (SGAM) provides the means to relate the analytical step to the Structured Analytic Technique (SAT) and then to the appropriate geospatial operation. The following table summarizes this mapping:
|
Structured Geospatial Analytic Method Step |
Structured Analytic Technique | GIS Operation |
|---|---|---|
| Step 1: Question |
|
|
|
Step 2: Grounding
|
|
|
| Step 3: Hypothesis Development |
|
|
| Step 4: Evidence Development |
|
|
| Step 5: Fusion |
|
|
| Step 6: Conclusions |
|
|
The Intelligence Community began to use structured techniques because of analytic failures related to cognitive limitations and pitfalls or biases. The use of SATs does not guarantee getting intelligence analysis right, because there are so many uncertainties. SATs help to reduce the frequency and severity of error. These include SATs that partially overcome cognitive limitations, address analytic pitfalls, and confront the problems associated with mindsets. SATs help the mind think more rigorously about an analytic problem. Specifically, they ensure that assumptions, preconceptions, and mindsets are not taken for granted but are explicitly examined and tested. The use of SATs also helps to review the analysis and identify the cause of any error.
Chapter 4 - Develop the Geospatial Question
Chapter 4 Overview
This chapter discusses the first step of the SGAM, highlighted below in gold, the Analytic Question.
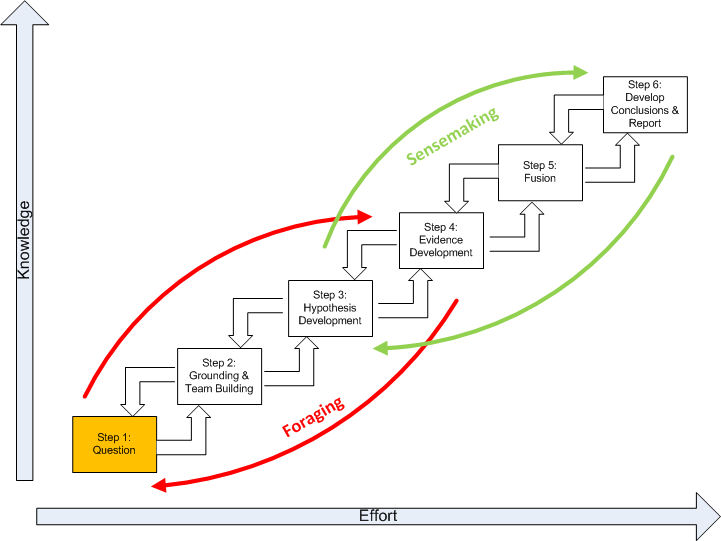
The question, or analytical problem, can be viewed as an active two-way interface between the client requiring the information and the geospatial analyst supplying it. The problem defines the geospatial patterns the analyst is seeking. Foraging and sensemaking define the nature of the analysis and quality in this context defined as satisfying the client. A geospatial question that leads to the sensemaking process must meet three criteria of:
- At least one plausible explanation exists with some geospatial aspect.
- Counter-explanations are possible.
- The hypotheses can be defined sufficiently with respect to the geospatial aspects to allow us to gather evidence.
Therefore, the problem possesses a highly strategic significance. The figure below depicts a three-way connection between the client and analyst’s domain:
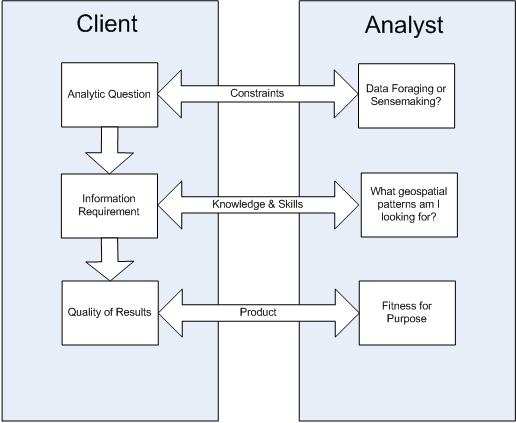
Before beginning, ask the following questions:
- Who is the key person for whom the analysis is being completed?
- Do I understand the question? (If necessary, clarify this before proceeding.)
- What is the most important message to give this client?
- How is the client expected to use this information?
- How much time does the client have?
- What format would convey the information most effectively?
- What is the client’s level of tolerance for technical geospatial specific language? How much detail and what geospatial accuracy does the client expect?
- Would the client expect the analyst to reach out to other experts within or outside the Intelligence Community?
- To whom, or to what source, might the client turn for alternative views on this topic? What data or analysis might others provide that could influence how the client reacts to what is being prepared in this paper?
The question focuses the analyst on the nature of the spatial and temporal patterns the analyst is seeking to identify and understand. Many new geospatial analysts struggle to translate the question into the context of spatial concepts. To overcome this, we stress the importance of understanding the general analytical question and developing a spatial corollary of this broader question.
What is an analytic question? There are significant differences between a “factoid question,” which are the most common in Geospatial Intelligence, and an “analytical question.” A factoid question seeks a piece of information that would be answered with a corresponding true statement. For example:
Question: “How many miles are between two shooter events?”
Answer: “There are 5 miles between events."
In general, a factoid question usually has just one correct answer that can be easily judged for its truthfulness. Answers to factoid questions are important as evidence but are not to be the focus of an analytic effort. Data foraging provides factoids (or evidence), a small but potentially important bit of information. In contrast to a factoid question, an analytical question has a less certain relationship with expected answer. For example:
Question: “Who is the DC Shooter?”
Answer: “The shooter could be a foreign terrorist or a serial killer.”
In general, an analytical question has many possibly correct answers that cannot be easily judged for truthfulness. An analytical question is generally quite flexible in the sense that there is always a strong possibility that we may not arrive at the “expected” answer. Thus, a change of analytic strategy, and even the initial expectations of the analysis, may be warranted. This suggests a solution to an analytic question must involve iterative information foraging and sensemaking.
Geospatial Corollary
The Geospatial Corollary is a highly spatial problem statement which follows readily from the broader analytic problem, and suggests a narrowly focused spectrum of geospatial questions. The evidence developed as part of the spatial corollary contributes to the larger body of evidence of the initial analytic problem; the spatial corollary is unlikely to be as significant to the stakeholder as those of initial analytic problem statement. The development of this spatial corollary involves an active two-way discussion between the client requiring the information and the geospatial analyst supplying it. For example, “What geospatial aspects of the events help to explain if the DC Shooter is a foreign terrorist?” The spatial corollary must be “analytic” which means four conditions are met:
- It must be at least one spatial quality or relationship to be explained;
- At least one plausible explanation of the spatial quality or relationship must be posed;
- Counter-explanations are possible and analysis must include an investigation of alternative hypotheses; and
- The hypotheses must be capable of being defined sufficiently to allow us to gather spatial evidence.
Memory Aid
Actions That Help Define the Analytic Question
Action 1: Develop an understanding of the general analytic question. Understanding the general question will require a two-way dialog between the client requiring information and the geospatial analyst supplying it. The distinguishing characteristics of an “analytical question” in geospatial intelligence are:
- That the analyst cannot anticipate the answer without reasoning.
- While certain answer may be expected, the result is for the most part unknown and heavily biased by the available data.
- The initial efforts probe the available data with other probes determining follow up questions. In our case, these will be geospatial questions.
- Clarifications will possibly be needed to adjust the scope and intent of the question.
Action 2: Familiarize yourself to the problem. Before finalizing the question, the analyst must have a preliminary and broad base of knowledge about the problem. When dealing with a new and unfamiliar subject, the uncritical and relatively non-selective accumulation and review of information is necessary. This is a process of absorbing information, not analyzing it.
Action 3: Think about the Spaces. An object or event can be specified relative to the observer, to the environment, to its own intrinsic structure, or to other objects in the environment. Each instance requires the adoption of specific spatial frames of reference or context. The spatial context is critical because it is the space the data is in that ultimately determines its interpretation. There are three spatial contexts within which we can make the data-to-information transition. In all cases, space provides an interpretive context that gives meaning to the data. These include:
- Life spaces - Life space is the four-dimensional space-time that provides the means of coming to grips with the spatial relations between self and objects in the physical environment. This is cognition in space and involves thinking about the world in which we live. It is exemplified by navigation and the actions that we perform in space. For example, the route the sniper took between shootings.
- Physical spaces - Physical space is the four-dimensional space-time that focuses on a scientific understanding of the nature, structure, and function of phenomena. This is cognition about space and involves thinking about the ways in which the "world" works. An example might be how an earthquake creates a tsunami. Another example is the sniper's weapon had a certain range the projectile will travel.
- Intellectual spaces - Intellectual space is in relationship to concepts and objects that are not in and of themselves necessarily spatial, but the nature of the space is defined by the particular problem. This is cognition with space and involves thinking with or through the medium of space in the abstract. An example is perceived extent of tribe influence by a tribal leader. Another example might be areas where the sniper felt safe from detection.
Action 4: Think about the fundamental spatial questions. When making sense about the spaces (Gershmehl and Gershmehl, 2006) the analyst first asks and answers the following questions each of the life, physical, and intellectual spaces:
- Where is this object or event?
- What is at this object or event?
- How is this object or event linked to other objects and events?
Action 5: Think about the qualities of the objects or events for each space. The analyst then proceeds to examine the object or events for each space by asking the following questions:
- How are objects or events similar or different?
- How can we compare them fairly?
- What effect(s) does the object or event have on nearby areas?
- What nearby objects or events are similar to each other and can be grouped together?
- Where does this object or event fit in a hierarchy?
- Is the change between objects or events abrupt, gradual, or irregular?
- What distant objects or events have similar situations and therefore may have similar conditions?
- Are there clusters, strings, rings, waves, or other non-random arrangements of objects or events?
- Do objects or events tend to occur together (have similar spatial patterns)?
Action 6: Think about the relationship between the objects and event for each space. Last, the comparisons are placed into the context of space and time. This is spatiotemporal thinking which asks the questions:
- How do spatial objects or events change through time?
- How do conditions change at a place over time?
- What is the change in position of something over time?
- What is the change in extent of something over time?
- Where are the objects or events that do not seem to follow an observed “rule”?
Action 7: Write the Geospatial Corollary. The geospatial corollary is a highly spatial problem statement which follows readily from the broader analytic problem, and suggests a narrowly focused spectrum of geospatial questions. The evidence developed as part of the spatial corollary contributes to the larger body of evidence of the initial analytic problem; the spatial corollary is unlikely to be as significant to the stakeholder as those of initial analytic problem statement. The development of this spatial corollary involves an active two-way discussion between the client requiring the information and the geospatial analyst supplying it. The spatial corollary must be “analytic” which means four conditions are met:
- there must be at least one spatial quality or relationship to be explained;
- at least one plausible explanation of the spatial quality or relationship must be posed;
- counter-explanations are possible and analysis must include an investigation of alternative hypotheses; and
- the hypotheses must be capable of being defined sufficiently to allow us to gather spatial evidence.
Chapter 5 - Grounding in the Problem and Team Building
Chapter 5 Overview
This chapter discusses the second step of the SGAM, highlighted below in gold, Grounding in the Problem and Team Building.
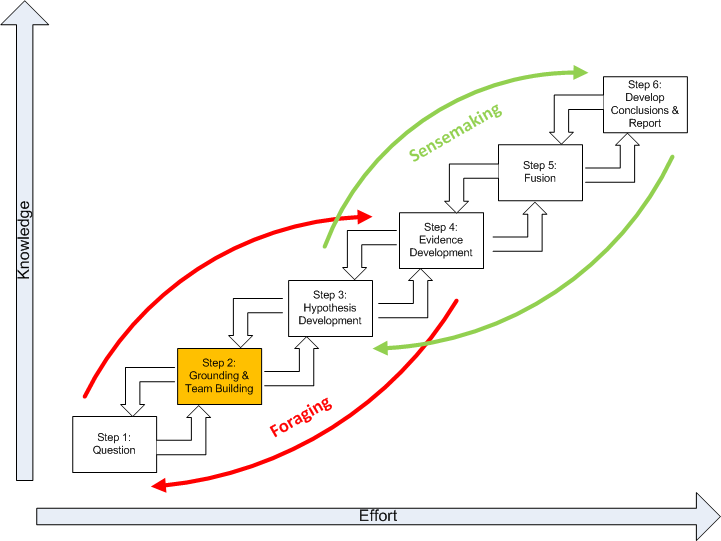
Obviously, an analyst must have a base of knowledge to work with before starting analysis. The significance of geospatial information is always a joint function of the nature of the information and the context in which it is interpreted. When dealing with a new and unfamiliar subject, the uncritical and relatively non-selective accumulation and review of information is an appropriate first step. This is a process of absorbing geospatial information, not analyzing it. Another view of this process is as a problem reduction effort. In this view, a problem is decomposed into a structured set of subproblems. Each subproblem is subject to further decomposition until the subproblems produced are investigatable with given techniques.
Developing an understanding of the analytic problem domain is often referred to as “grounding.” Why ground yourself in the problem? It should be a frightening prospect for a geospatial analyst to develop intelligence without a firm understanding of an analytic problem domain. Grounding is an act of information foraging ,which is a tradeoff among three kinds of processes. Analysts tended to begin with a broad set of documents and then proceeded to narrow that set down into successively smaller, higher-precision sets of data before reading and analyzing the documents. Generally, there are three processes that tradeoff against one another under deadline or data overload constraints:
- Exploring or monitoring more of the space, and by this means increasing the amount of new geospatial information brought into the analysis process. In geospatial terms, this corresponds to increasing geospatial data and information relating to the question being interpreted. There are generally three major categories of results from this search ( according to Kludas, 2007 [11]):
- Skimmed results- many diverse and relevant items
- Chorus of results- many similar and relevant items
- Dark Horse results- an unusually accurate single source
- Enriching (or narrowing) the set of items that have been collected for analysis. This is a process in which smaller, higher-precision sets of documents are created. This is, to a great extent, a problem reduction effort where the problem is decomposed into a structured set of subproblems. Each subproblem is subject to further decomposition until the subproblems produced are investigatable with given techniques.
- Exploiting the items in the set, by which we mean more thorough reading of documents, using geospatial visualization tools (such as GIS) to extract information, generate inferences, notice patterns, etc.
Grounding is the foundation of future hypotheses. In a practical sense, grounding is the confirmation and discovery of geospatial information about the problem. Grounding is related to the problem of how patterns get their meaning. In Geospatial Intelligence, grounding is developing the ability to see a pattern by the inner eye. This is to say, patterns on maps and images only acquire meaning when they are observed by a recipient that is self aware. The analyst needs an explicit theoretical and methodological grounding in the problem with special attention to the contexts in which the patterns occur. This allows knowledge to be focused as specifically as possible to the context of the problem. In recent years, the confirmation and discovery of geospatial information and a “knowledge team” have become inseparable because of the:
- complexity of space-time problems;
- requirement for multidisciplinary input;
- need to share more information more quickly;
- growing dispersion of expertise, and;
- need to identify and evaluate the validity of alternative models.
Building the Knowledge Team
It has often been said that Geospatial Intelligence is a team sport. What does this mean? The Director of National Intelligence’s (DNI) vision for 2015 is one in which intelligence analysis increasingly becomes a collaborative enterprise with the focus of collaboration shifting “away from coordination of draft products toward regular discussion of data and hypotheses early in the research phase.” This is a major change from the traditional concept of geospatial analysis as largely an individual activity. It is driven in part by the growing complexity and need for multidisciplinary input when developing analytic products; the need to share information across organizational boundaries; and the need to identify and explore the validity of alternative hypotheses. It is enabled by advances in social networking practices. It is important to note that team-based analysis brings a new set of challenges comparable to the cognitive limitations and pitfalls faced by the individual analyst. As mentioned previously, geospatial analysis and a “knowledge team” have become inseparable because of the:
- complexity of space-time problems;
- requirement for multidisciplinary input;
- need to share more information more quickly;
- growing dispersion of expertise, and;
- need to identify and evaluate the validity of alternative models.
A “knowledge team” is an informal network of individuals devoted to vetting ideas which helps the analyst make better geospatial decisions. A knowledge team is more akin to a debating team than a sympathetic support group. An effective knowledge team:
- Identifies and shares supporting and contrary information;
- includes subject matter experts to help address key issues;
- develops information that can be used for bench marking analysis, and;
- develops feedback that benefits the analyst problem solving.
Our knowledge team should be a rich mix of individuals meeting the following:
- Qualities include:
- Individual thinkers, working in sync, with the combined geospatial skills, technical skills, and domain experience that spans the problem domain.
- A dynamic, likely conflicted team that expresses alternate perspectives, but still has energy and purpose that propels it forward in achieving its purpose.
- Individuals willing and responsible for expressing their perspective.
- The contrast with a group. A group is like a bunch of people on a bus all heading in the same direction driven by the bus driver. People do not talk with each other on the bus. They get on and off as they please. The only commonality is the vehicle.
- Actions of the team:
- demonstrate accountability;
- demonstrate a high order of geospatial awareness;
- involve conflict;
- focus on problem-solving including the geospatial perspective;
- have a formal leader;
- have informal leaders;
- are temporary, and;
- have individual roles that are critical to and subordinate to team goals. "I" is each of the parts that forms the "we" that pull together to make it about the bigger "us."
- Images that fit teams include:
- an aircraft carrier, and;
- a surgical team.
Memory Aid
Action 1: Review the spatial corollary from Step 1 (Problem).
Action 2: Make a list of key words or phrases to help identify information about the topic.
For example:
- Shooter
- Terrorist
Action 3: Scan the tertiary sources. Scan means that you should not deal with all of the content, but search through the material looking for an overview and:
- Where is this object or event? (e.g., shooting)
- What is at this object or event? (e.g., access to highway)
- How is this object or event linked to other objects and events? (e.g., periods of heavy traffic)
Internet sites may provide tertiary source for information. However, citation of unvetted Internet sites, such as Wikipedia, in intelligence research is not considered acceptable because they are not considered a credible source. It is important to understand that a tertiary source is often a selective “downstream” summary and compilation of generalizations, analysis, interpretations, or evaluations of original information or primary sources. The most desirable are primary sources (or evidence), that is an artifact, a document, a recording, or other source of information that was created at the time under event.
Action 4: Skim secondary and primary sources relevant to the topic. To skim the material, read a page by reading the headings and first sentences of each paragraph or section. Note sources that might address your geospatial corollary. Secondary sources involve generalization, analysis, synthesis, interpretation, or evaluation of original information or primary sources. A primary source (or evidence) is an artifact, a document, a recording, or other source of information that was created at the time under study.
Action 5: Create an annotated bibliography of sources you will use. An annotated bibliography is a list of citations to books, articles, and documents. Each citation is followed by a brief (30 words) description of the source and a quick evaluation if it pertains to life space, physical space, or intellectual space. For example:
Pherson Associates (2009) The D.C. Sniper Case.
This document is intended to illustrate the Analysis of Competing Hypotheses (ACH) methodology.
Uncertain as to the factual accuracy. if valid, provides an insight into the life and intellectual spaces.
Action 6: Form your knowledge team. Your knowledge team is an informal network of two (2) to five (5) subject matter experts you organize around the problem. The knowledge team members have in common their knowledge about the analytic problem, tools, or techniques to address the problem. Consequently, ideas can be vetted. The role of the analyst is to make sure that all possibilities are considered.
Action 7: Test your understanding. Test your understanding by:
- Listing the spatial qualities and/or relationships of the life, physical, and intellectual spaces that relate to your problem.
- Providing a short explanation of the spatial qualities or relationships identified.
- Providing a short counter-explanation for each item identified in #2 above.
- Listing possible spatial evidence including, but not limited to, imagery, data sets, and possible GIS operations.
Action 8: Go back to Action 2 and go through the process again. Remember that the research process is a recursive one which means that you may need to revisit your previous work more than once if you find it doesn't work out.
Action 9: If necessary, go back to the problem Definition (Step 1) and revise your Spatial Corollary.
Chapter 6 - Hypothesis Development
Chapter 6 Overview
This chapter discusses the third step of the SGAM, highlighted below in gold, Hypothesis Development.
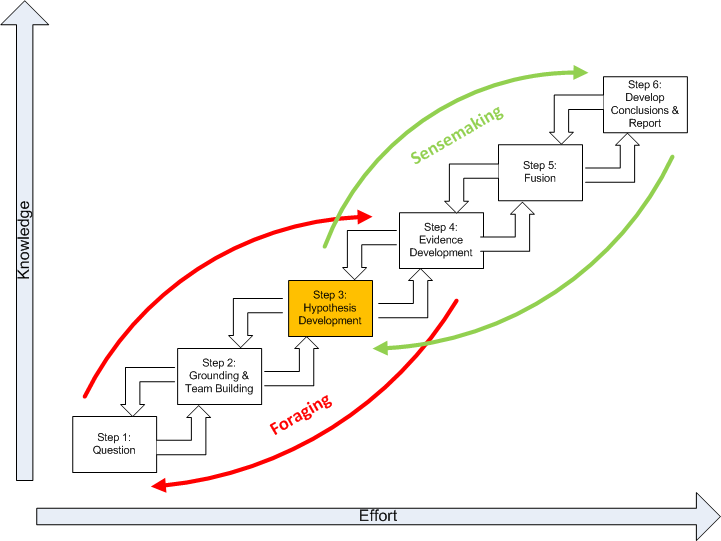
A hypothesis is often defined as an educated guess because it is informed by what you already know about a topic. This step in the process is to identify all hypotheses that merit detailed examination, keeping in mind that there is a distinction between the hypothesis generation and hypothesis evaluation.
If the analysis does not begin with the correct hypothesis, it is unlikely to get the correct answer. Psychological research into how people go about generating hypotheses shows that people are actually rather poor at thinking of all the possibilities. Therefore, at the hypothesis generation stage, it is wise to bring together a group of analysts with different backgrounds and perspectives for a brainstorming session. Brainstorming in a group stimulates the imagination and usually brings out possibilities that individual members of the group had not thought of. Experience shows that initial discussion in the group elicits every possibility, no matter how remote, before judging likelihood or feasibility. Only when all the possibilities are on the table, is the focus on judging them and selecting the hypotheses to be examined in greater detail in subsequent analysis.
When screening out the seemingly improbable hypotheses, it is necessary to distinguish hypotheses that appear to be disproved (i.e., improbable) from those that are simply unproven. For an unproven hypothesis, there is no evidence that it is correct. For a disproved hypothesis, there is positive evidence that it is wrong. Early rejection of unproven, but not disproved, hypotheses biases the analysis, because one does not then look for the evidence that might support them. Unproven hypotheses should be kept alive until they can be disproved. One example of a hypothesis that often falls into this unproven but not disproved category is the hypothesis that an opponent is trying to deceive us. You may reject the possibility of denial and deception because you see no evidence of it, but rejection is not justified under these circumstances. If deception is planned well and properly implemented, one should not expect to find evidence of it readily at hand. The possibility should not be rejected until it is disproved, or, at least, until after a systematic search for evidence has been made, and none has been found.
There is no "correct" number of hypotheses to be considered. The number depends upon the nature of the analytical problem and how advanced you are in the analysis of it. As a general rule, the greater your level of uncertainty, or the greater the impact of your conclusion, the more alternatives you may wish to consider. More than seven hypotheses may be unmanageable; if there are this many alternatives, it may be advisable to group several of them together for your initial cut at the analysis.
Developing Multiple Hypotheses
Developing good hypotheses requires divergent thinking to ensure that all hypotheses are considered. It also requires convergent thinking to ensure that redundant and irrational hypotheses are eliminated. A hypothesis is stated as an "if … then" statement. There are two important qualities about a hypothesis expressed as an "if … then" statement. These are:
- Is the hypothesis testable; in other words, could evidence be found to test the validity of the statement?
- Is the hypothesis falsifiable; in other words, could evidence reveal that such an idea is not true?
Hypothesis development is ultimately experience-based. In this experienced-based reasoning, new knowledge is compared to previous knowledge. New knowledge is added to this internal knowledge base. Before long, an analyst has developed an internal set of spatial rules. These rules are then used to develop possible hypotheses.
Looking Forward
Developing hypotheses and evidence is the beginning of the sensemaking and Analysis of Competing Hypotheses (ACH) process. ACH is a general purpose intelligence analysis methodology developed by Richards Heuer while he was an analyst at the Central Intelligence Agency (CIA). ACH draws on the scientific method, cognitive psychology, and decision analysis. ACH became widely available when the CIA published Heuer’s The Psychology of Intelligence Analysis. The ACH methodology can help the geospatial analyst overcome cognitive biases common to analysis in national security, law enforcement, and competitive intelligence. ACH forces analysts to disprove hypotheses rather than jump to conclusions and permit biases and mindsets to determine the outcome. ACH is a very logical step-by-step process that has been incorporated into our Structured Geospatial Analytical Method. A complete discussion of ACH is found in Chapter 8 of Heuer’s book. [1]
General Approaches to Problem Solving Utilizing Hypotheses
Science follows at least three general methods of problem solving using hypotheses. These can be called the:
- method of the ruling theory
- method of the working hypothesis
- method of multiple working hypotheses
The first two are the most popular but they can lead to overlooking relevant perspectives, data, and encourage biases. It has been suggested that multiple hypotheses offers a more effective way of overcoming this problem.
Ruling Theories and Working Hypotheses
Our desire to reach an explanation commonly leads us to a tentative interpretation that is based on a single case. The explanation can blind us to other possibilities that we ignored at first glance. This premature explanation can become a ruling theory, and our research becomes focused on proving that ruling theory. The result is a bias to evidence that disproves the ruling theory or supports an alternate explanation. Only if the original hypothesis was by chance correct does our analysis lead to any meaningful intelligence work. The working hypothesis is supposed to be a hypothesis to be tested, not in order to prove the hypothesis, but as a stimulus for study and fact-finding. Nonetheless, the single working hypothesis can become a ruling theory, and the desire to prove the working hypothesis, despite evidence to the contrary, can become as strong as the desire to prove the ruling theory.
Multiple Hypotheses
The method of multiple working hypotheses involves the development, prior to our search for evidence, of several hypotheses that might explain what are attempting to explain. Many of these hypotheses should be contradictory, so that many will prove to be improbable. However, the development of multiple hypotheses prior to the intelligence analysis lets us avoid the trap of the ruling hypothesis and thus makes it more likely that our intelligence work will lead to meaningful results. We open-mindedly envision all the possible explanations of the events, including the possibility that none of the hypotheses are plausible and the possibility that more research and hypothesis development is needed. The method of multiple working hypotheses has several other beneficial effects on intelligence analysis. Human actions are often the result of several factors, not just one, and multiple hypotheses make it more likely that we will see the interaction of the several factors. The beginning with multiple hypotheses also promotes much greater thoroughness than analysis directed toward one hypothesis, leading to analytic lines that we might otherwise overlook, and thus to evidence and insights that might never have been considered. Thirdly, the method makes us much more likely to see the imperfections in our understanding and thus to avoid the pitfall of accepting weak or flawed evidence for one hypothesis when another provides a more possible explanation.
Drawbacks of Multiple Hypotheses
Multiple hypotheses have drawbacks. One is that it is difficult to express multiple hypotheses simultaneously, and therefore there is a natural tendency to favor one. Another problem is developing a large number of hypotheses that can be tested. A third possible problem is that of the indecision that arises as an analyst balances the evidence for various hypotheses, which is likely preferable to the premature rush to a false conclusion.
Memory Aid
Actions That Help the Analyst Develop Hypotheses
Action 1: Brainstorming. Begin with a brainstorming session with your knowledge team to identify a set of alternative hypotheses. Focus on the hypotheses that are:
- logically consistent with the theories and data uncovered in your grounding;
- address the quality and relationships of spaces.
State the hypotheses stated in an "if ... then" format, for example:
- If the DC Shooter is a terrorist, then the geospatial pattern of events would be similar to other terrorist acts.
- If the DC Shooter is a serial killer, then the geospatial pattern of events would be similar to other serial killers.
Action 2: Review the hypotheses for testability, i.e., can evidence be could found to test the validity of the statement.
Action 3: Check the hypotheses for falsifiability, i.e., could evidence reveal that such an idea is not true.
Action 4: Combine redundant hypotheses.
Action 5:Consider the elimination of improbable and unproven hypotheses.
Chapter 7 - Evidence Development
Chapter 7 Overview
This chapter discusses the fourth step of the SGAM, highlighted below in gold, Evidence Development.
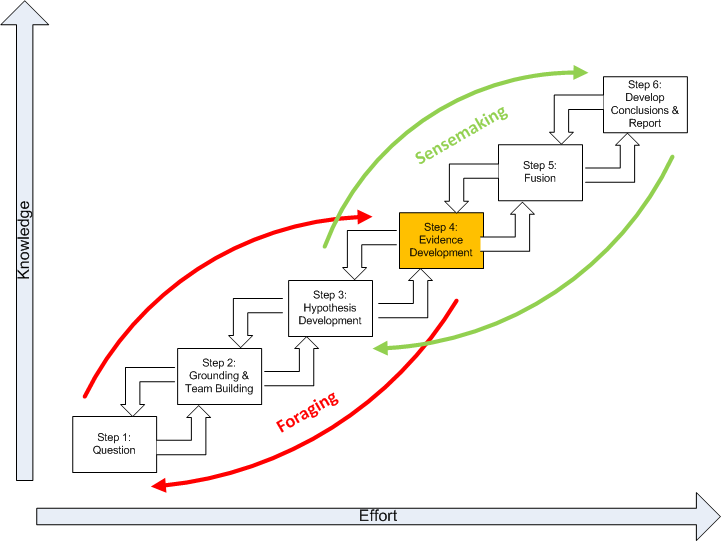
How do you choose your evidence? By basic definition, evidence is proof supporting a theory. The term evidence in geospatial intelligence includes the combination of aspatial evidence and spatial evidence to increase the estimate of the probability of the truthfulness of a hypothesis. It is important to note that evidence is dependent on the agent that estimates the probability. This is to say, a map, data, or textual information is regarded as evidence only when it is compatible with the hypothesis.
The goal is thinking with the evidence vs. thinking about the subject matter of the evidence. This is an important distinction and critical to the use of evidence to explain other evidence, solving problems, and formulating a perspective. Evidence includes assumptions and logical deductions as well as specific reported or researched items. Assumptions or logical deductions about how things normally work are often more important than hard evidence in determining analytical conclusions. Using geospatial tools, you can begin to further identify and characterize patterns. Here, developing evidence requires an understanding of the data, domain, and how to appropriately manipulate the data. These internal rule sets allow an analyst to evaluate evidence. The internal rule sets can be modified and enhanced as additional information is added and integrated into thinking. Sources of evidence may include:
- Print sources including maps, text books, and photos
- Electronic sources including digital geographic databases, imagery, photos, spread sheets, graphs, etc. from Internet sites such as Twitter, Facebook, blogs, MySpace, Flickr, YouTube, etc.
- Interviews, surveys, and intercepts
- Experiments such as GIS modeling, statistical models, geovisualization, data exploration, geostatistics, network analysis, etc.
- Personal experience
The absence of evidence is also evidence and should be noted. Not all evidence needs to be included. Old evidence is likely to bias the analysis in favor of concluding that the status quo will continue. If there is going to be a significant change, that may well be apparent only from the recent evidence.
Memory Aid
The following actions help the analyst to develop evidence.
Action 1: Make a list of the significant evidence.
Action 2: Acquire or develop missing evidence. The recognition, collection, development, and effective presentation of evidence is essential to successful analysis. Use GIS and remote sensing tools to develop evidence in support your analysis.
Action 3: Describe the evidence. Does this occur in life, physical, or intellectual space? What does the evidence teach about the fundamental spatial questions of where, what, and how objects are linked? What are the important spatial qualities and relationships?
Action 4: Evaluate the evidence. Evaluate:
- Credibility - Trustworthy source, author’s credentials, evidence of quality control, known or respected authority, organizational support.
- Accuracy - Lineage, positional accuracy, attribute accuracy, logical consistency, temporal quality, and resolution.
- Reasonableness - Fair, balanced, objective, reasoned, no conflict of interest, absence of fallacies or slanted tone.
- Support - Listed sources, contact information, available corroboration, claims supported, documentation supplied.
Action 5: Check for significant missing evidence. Ask yourself for each hypothesis: If this hypothesis is true, what are all the spatial qualities and relationships that must have happened and what evidence of this should I expect to see? Then ask: If I am not seeing this evidence, why not? Is it because it is not happening, it is being concealed, or because I have not looked for it? Include as evidence the absence of things you would expect to see if a hypothesis were true.
Action 6: Check for deception. If you are uncertain whether an item of evidence is deceptive, enter that evidence twice, once with the assumption that it is not deceptive, and once with the assumption that it is deceptive.
Chapter 8 - Fusion
Chapter 8 Overview
This chapter discusses the fifth step of the SGAM, highlighted below in gold, Fusion.
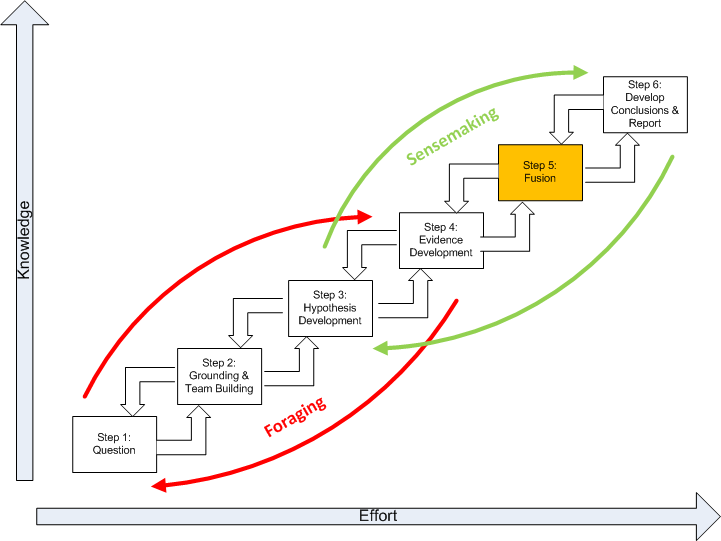
The integration of data, recorded from multiple modes, together with knowledge, is known as fusion according to this paper by J. Esteban published in 2005 [12]. Fusion is specifically used here as a term to describe how an organization arrives at a decision based upon data and information. Traditionally, the field has been thought to be the domain of mathematicians and statisticians who could use facts to justify a decision. In general, fusion is the process one goes through in an analytic method so that the influence of unreliable sources can be lowered compared to the reliable sources according to this document by Kludas published in 2007 [13]. In a great sense, the multi modal (graphical and text) nature of geospatial intelligence data analysis to reduce the influence of unreliable sources is essentially a fusion process. Step 5 of the SGAM is where it happens.
Memory Aid
The following actions are involved in the fusion of information:
Action 1: Prepare a matrix with hypotheses across the top and evidence and arguments down the side. Please note that your evidence and arguments may or may not be geospatial in nature. The matrix gives an overview of all the significant components of your analytical problem.
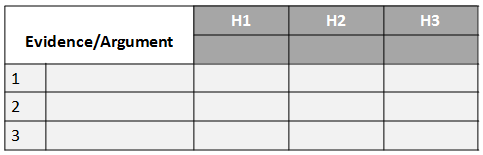
Action 2: Working down the column to each piece of evidence and then across the rows of the matrix, examine one item of evidence at a time to see how consistent that item of evidence is with each of the hypotheses. Later you will work across the columns of the matrix, examining one hypothesis at a time, to see how consistent that hypothesis is with all the evidence.
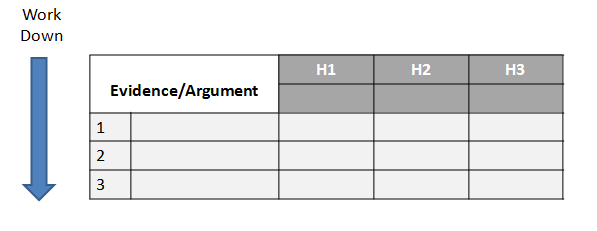
To fill in the matrix, take the first item of evidence and ask whether it is consistent with, inconsistent with, or irrelevant to each hypothesis. Then make a notation accordingly in the appropriate cell under each hypothesis in the matrix. The form of these notations in the matrix is a matter of personal preference. It may be pluses, minuses, and question marks. It may be C, I, and N/A standing for consistent, inconsistent, or not applicable. Or it may be some textual notation. Simply put, what you use is a shorthand representation of the complex reasoning that went on as you thought about how the evidence relates to each hypothesis. In some cases, it may be useful to refine this procedure by using a numerical probability, rather than a general notation such as plus or minus, to describe how the evidence relates to each hypothesis.
Analyze the "diagnosticity" of each piece of evidence and each argument as you complete the matrix. This step is the most important; it is the step that deviates most from the intuitive approach to geospatial analysis. Diagnosticity is how helpful the evidence or argument is in judging the relative likelihood of alternative hypotheses. Diagnosticity of evidence is an important concept that is unfamiliar to many geospatial analysts. Diagnosticity may be illustrated by a medical analogy. A high-temperature reading may have great value in telling a doctor that a patient is sick, but relatively little value in determining which illness a person is suffering from. Because a high temperature is consistent with so many possible hypotheses about a patient's illness, this evidence has limited diagnostic value in determining which illness (hypothesis) is the most likely one.
The matrix format helps you weigh the diagnosticity of each item of evidence. If an item of evidence seems consistent with all the hypotheses, it may have no diagnostic value. A common experience is to discover that most of the evidence supporting what you believe is the most likely hypothesis really is not very helpful, because that same evidence is also consistent with other hypotheses. When you do identify items that are highly diagnostic, these should drive your judgment.
Action 3: Refine the matrix by reconsidering the hypotheses, and delete evidence and arguments that have no diagnostic value. The wording of the hypotheses is critical to the conclusions one can draw from the analysis. By this point, you will have seen how the evidence breaks out under each hypothesis, and it is necessary to reconsider and reword the hypotheses. New hypotheses may need to be added, or finer distinctions may need to be made in order to consider all the significant alternatives. If there is little or no evidence that helps distinguish between two hypotheses, consider combining the two.
Also, reconsider the geospatial evidence. Question if your thinking about which hypotheses are most likely and least likely is influenced by factors that are not included in the evidence. If so, use the data and tools in hand to create this evidence and include it in your analysis. Delete from the matrix items of evidence or arguments that now seem unimportant or have no diagnostic value. Save these items in a separate list as a record of information that was considered.
Chapter 9 - Conclusions
Chapter 9 Overview
This chapter discusses the fifth step of the SGAM, highlighted below in gold, Develop Conclusions and Report.
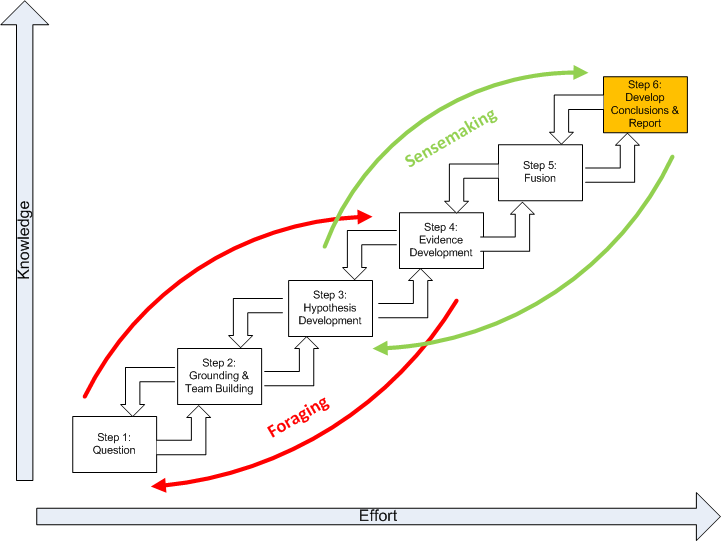
Develop Tentative Conclusions
The matrix gives an overview of all the evidence for and against all the hypotheses. Proceed by rejecting or eliminating hypotheses, while tentatively accepting only those hypotheses that cannot be refuted. Critically, the matrix should not dictate the conclusion. It simply reflects your judgment of what is important and how these important factors relate to the probability of each hypothesis. The matrix is an aid to thinking and analysis, to ensure consideration of all the possible interrelationships between evidence and hypotheses and identification of those few items that really swing your judgment on the issue.
Applying Judgment
No matter how much information is consistent with a given hypothesis, hypotheses cannot be proved as true. The fact that a hypothesis is inconsistent with the evidence is the basis for rejecting it. The pluses, indicating evidence that is consistent with a hypothesis, are less significant because a list of evidence that is consistent with almost any reasonable hypothesis can be easily made. What is difficult to find, and is most significant when found, is hard evidence that is clearly inconsistent with a reasonable hypothesis. The analyst should look for the linchpin assumptions or items of evidence that really drive the outcome of your analysis. Do this by asking:
- Are there questionable assumptions that drive your understanding and interpretation?
- Are there unexplored alternative explanations or interpretations?
- Could the evidence be incomplete and misleading?
If there is any concern at all about denial and deception, look at the sources of your key evidence. When analysis turns out to be wrong, it is often because of key assumptions that went unchallenged and proved invalid. The problem is to determine which assumptions merit questioning.
Reporting Your Conclusions
When writing your report, identify critical assumptions that went into your interpretation and note that your conclusion is dependent upon the validity of these assumptions. The written argument for a certain judgment is incomplete without a discussion of alternative judgments that were considered and why they were rejected. An analytical conclusion is always tentative. The situation may change, or it may remain unchanged while you receive new information that alters your appraisal. To address this, specify in advance milestones one should look for or be alert to that, if observed, would suggest a significant change in the probabilities.
Memory Aid
Action 1: Develop Tentative Conclusions. You will now draw tentative conclusions about the relative likelihood of each hypothesis by trying to disprove the hypotheses rather than prove them. The matrix format gives an overview of all the evidence for and against all the hypotheses, so that you can examine all the hypotheses together and have them compete against each other. Previously you analyzed the "diagnosticity" of the evidence and arguments by working down and across the matrix, focusing on a single item of evidence and examining how it relates to each hypothesis. Now, work across and down the matrix, looking at each hypothesis and the evidence as a whole.
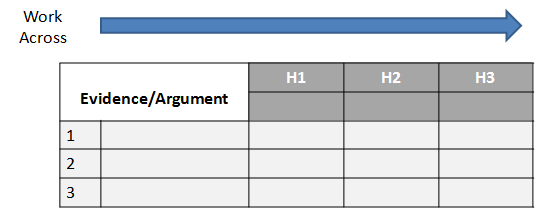
Analysts have a natural tendency to concentrate on confirming hypotheses they already believe to be true, and giving more weight to information that supports a favored hypothesis than to information that weakens it. Moreover, no matter how much information is consistent with a given hypothesis, you cannot prove that hypothesis is true, because the same information may also be consistent with one or more other hypotheses. On the other hand, a single item of evidence that is inconsistent with a hypothesis may be sufficient grounds for rejecting that hypothesis.
This step requires doing the opposite of what comes intuitively when evaluating the relative likelihood of alternative hypotheses, by looking for evidence or arguments that enable you to possibly reject the hypothesis or determine that it is unlikely. This follows a fundamental concept of the scientific method of rejecting or eliminating hypotheses, while tentatively accepting only those hypotheses that cannot be refuted. The scientific method obviously cannot be applied without the analyst's intuitive judgment, but the principle of seeking to disprove hypotheses, rather than confirm them, helps to overcome the natural tendency to favor one hypothesis.
In examining the matrix, look at the minuses, or whatever other notation you used to indicate geospatial evidence that may be inconsistent with a hypothesis. The hypothesis with the fewest minuses is probably the most likely one. The hypothesis with the most minuses is probably the least likely one. The fact that a hypothesis is inconsistent with the evidence is certainly a sound basis for rejecting it. The pluses, indicating evidence that is consistent with a hypothesis, are far less significant. It does not follow that the hypothesis with the most pluses is the most likely one, because a long list of evidence that is consistent with almost any reasonable hypothesis can be easily made. What is difficult to find, and is most significant when found, is hard evidence that is clearly inconsistent with a reasonable hypothesis.
This initial ranking by number of minuses is only a rough ranking, however, as some evidence obviously is more important than other evidence, and degrees of inconsistency cannot be captured by a single notation such as a plus or minus. By reconsidering the exact nature of the relationship between the evidence and the hypotheses, you will be able to judge how much weight to give it. Analysts who follow this procedure often realize that their judgments are actually based on very few factors, rather than on the large mass of information that they thought was influencing their views.
Action 2: Apply Judgment: The matrix does not dictate your conclusion. Rather, it should accurately reflect a judgment of what is important and how the evidence relates to the probability of each hypothesis. You, not the matrix, makes the decision. The matrix only organizes your analysis, to ensure consideration of all the possible interrelationships between evidence and hypotheses, and to identify those items that heavily influence your reasoning.
The matrix may show a hypothesis is probable, and you may disagree. If so, it is because you omitted from the matrix evidence or arguments that influenced on your judgment. Go back and add the evidence or argument, so that the analysis reflects your best judgment. Following this procedure will cause you to consider things you might otherwise have overlooked or revise your earlier estimate of the relative probabilities of the hypotheses. When you are done, the matrix serves as an audit trail of your thinking and analysis.
Importantly, this process forces you to spend more analytical time than you otherwise would on what you had thought were the less likely hypotheses. The seemingly less likely hypotheses usually involve more work. What you started out thinking was the most likely hypothesis tends to be based on a continuation of your recalled geospatial experiences and patterns. A principal advantage of the analysis of competing hypotheses to geospatial intelligence is that it forces you to consider the alternatives.
Action 3: Sensitivity Analysis: You should analyze how sensitive your conclusion is to a few critical items of evidence. This is done by considering the consequences for your geospatial analysis if that evidence were wrong, misleading, or subject to a different interpretation. In Step 5, you identified the evidence and arguments that were most diagnostic, and later you used these findings to make tentative judgments about the hypotheses. Now, go back and question the key items of evidence that drive the outcome of the analysis:
- Are there questionable assumptions that underlie your understanding and interpretation?
- Are there alternative explanations or interpretations?
- Could the evidence be incomplete and, therefore, misleading?
If there is any concern at all about denial of information and/or deception, this is an appropriate place to consider that possibility. Look at the sources of key evidence:
- Are any of the sources known to be controlled by a distrusted actor?
- Could the sources have been duped and provided information that was planted?
- Could the information have been manipulated?
Put yourself in the shoes of a deception planner to evaluate motive, opportunity, means, costs and benefits of deception as they might appear to the opponent.
Action 4: Report Your Conclusions. In this step, you may decide that additional research is needed to check key judgments. It may be appropriate to go back to check the original source materials rather than relying on someone else's interpretation. In writing your report, it is desirable to identify critical assumptions that went into your interpretation and to note that your conclusion is dependent upon the validity of these assumptions. If your report is to be used as the basis for decision-making, it is appropriate to provide the relative likelihood of alternative possibilities. Analytical judgments are never certain. Decision-makers need to make decisions on the basis of a full set of alternative possibilities, not just the single most likely alternative. You should consider a fallback plan in case one of the less likely alternatives turns out to be true.
Action 5: Establish Milestones to Monitor. Analytical conclusions are always tentative, therefore, it is important to identify milestones that may indicate events are taking a different course than predicted. It is always helpful to specify things one should look for that suggest a significant change in the probabilities. This is useful for intelligence consumers who are following the situation on a continuing basis. Specifying in advance what would cause you to change your mind will also make it more difficult for you to rationalize such developments as not really requiring any modification of your judgment.
APPENDIX A: Example SGAM Application - The DC Shooter Case Study
Appendix A Overview
In October 2002, local, state, and federal authorities from the Washington, DC area joined in an unprecedented cooperative effort to capture the individuals charged with a series of shootings that paralyzed the National Capital Region. John Allen Muhammad and John Lee Malvo were apprehended following a 3-week shooting spree that brought together uniformed and investigative law enforcement personnel and communications resources from across the region. The extensive response and investigative effort required intelligence that was shared among hundreds of law enforcement officers from a variety of jurisdictions and levels of government.
Question
Background
There were attempts to geographically profile the killers, that is, predict where they would kill next based on the killer's spatial pattern or signature. Geographic profiling brings the science of geography, criminology, mathematical modeling, statistical analysis, and environmental and forensic psychology into the realm of criminal investigation. Below is a news report about Dr. Kim Rossmo's geographic profiling: [14]
Computer Profiler Aids in Sniper Hunt
By Jeordan Legon (CNN) (Source: http://www.criminalprofiling.ch/sniper.html [15])
Police Foundation Director Kim Rossmo says geographic profiling "provides an optimal search strategy."
(CNN) -- Software is leading the way for investigators trying to pinpoint a Washington-area sniper. Geographic profiling, developed by former Vancouver, British Columbia, police detective Kim Rossmo, tries to zero in on the suspect by using computers to track the mass of data flooding investigators' desks -- location, dates and times of crimes. The program then matches the information with what criminologists know about human nature. Rossmo told reporters his software can help police determine where a suspect lives within half a mile. "In effect, it provides an optimal search strategy," Rossmo said. Rossmo, director of the Washington-based Police Foundation, started assisting investigators in the sniper case last week. Calculating the path,his software, which was developed by a commercial vendor and named Rigel, carries out millions of mathematical equations to give investigators a better sense of a killer's "hunting area" and where he is likely to live. Rossmo said he relies on what psychologists term the "least-effort" theory. Crimes typically happen "fairly close to an offender's home but not too close," he said. "At some point, for a given offender, their desire for anonymity balances their desire to operate in their comfort zone," he said. Rossmo's system has been used by Scotland Yard, the FBI, the Royal Canadian Mounted Police and dozens of police agencies worldwide. Rossmo developed it while walking the beat in Canada and reading widely -- including a book on the hunting patterns of African lions. The geo-profiling technology was his doctoral thesis. Methods help solve serial murders Geo-profilers claim their methods have helped detectives solve about half of the 450 cases they've studied -- everything from serial rapes to serial murders. "It's the high-tech version of the pin map," said Richard Bennett, a professor of justice at American University. "The concept is simple. But you can put a lot more information in. ... It's what you do with the information that is key." Bennett said nothing takes the place of good, old-fashioned detective work but computerized geo-mapping techniques help. "The advantage is you're using computer science and computer analytic abilities to solve a crime," he said. " You don't have a big city police chief out there who isn't using some form of this mapping."
For geographic profiling to produce accurate profiles, the serial offenders must follow a predictable spatial model (or pattern). There is good reason to believe serial offenders do. Research has repeatedly shown that the majority of serial criminals travel relatively short distances from home to commit their crimes. Research has also demonstrated that the home location of many serial offenders' crimes literally surrounds their home; referred to as a marauding pattern. These are the primary reasons for the effectiveness of geographic profiling when applied to "typical" criminals. When serial offenders behave in ways that contradict these behaviors, such as terrorist activity, geographic profiling will typically be ineffective (Bennell, 2007 [16]). For more general information read Forecasting the Future of Predictive Crime Mapping [17]. Specifically look at the section on "The Role of Theory in Predictive Mapping."
The Analytic Question
There are significant differences between a “factoid question,” which are most common in Geospatial Intelligence, and an “analytical question.” A factoid question seeks a piece of information that would can be answered with a corresponding true statement. For example:
Question: “How many miles are between two shooter events?”
Answer: “There are 5 miles between events.”
In general, a factoid question usually has just one correct answer that can be easily judged for its truthfulness. Answers tofactoid questions are important as evidence but are not the focus of an analytic effort. Data foraging provides factoids (or evidence), small but potentially important bits of information.
In contrast to a factoid question, an analytical question has a less certain relationship with expected answer. For example:
Question: “Who is the DC Shooter?”
Answer: “The shooter could be a foreign terrorist or a serial killer.”
Grounding
The geospatial aspects of the DC Shooter actions can still help to answer our question as part of a bottom-up process (from data to theory) or top-down (from theory to data). The bottom-up process converts raw information into knowledge of our killers. The top-down process provides evidence to support or disconfirm the assumed spatial signature of the killers. The question we have asked is, who is the DC Shooter (based on the total evidence we have included their spatial profile)?
Referring to the case study [18], the DC Beltway shooter attacks took place during three weeks in October 2002, in Washington, D.C., Maryland, and Virginia. Ten people were killed and three others critically injured in various locations throughout the Washington Metropolitan Area and along Interstate 95 in Virginia.
There are several important definitions we will use. These are:
- A serial killer is a person who murders three or more people over a period of more than thirty days, with a "cooling off" period between each murder, and whose motivation for killing is largely based on psychological gratification.
- Domestic terrorism is violence committed by a group(s) of two or more individuals to intimidate or coerce a government, the civilian population, or any segment thereof, in furtherance of political or social objectives.
- Foreign terrorism is violence committed by a group(s) of two or more individuals originating outside the US to intimidate or coerce a government, the civilian population, or any segment thereof, in furtherance of political or social objectives.
Maps of the shootings and ballistics information can be found on the Washington Post web site [19].
As discussed previously, there were attempts to spatially "model" the Shooter's behavior. Here is another article about the geographic profiling:
Geographic Profiling of the Beltway Sniper
With no solid leads in their hunt for a sniper who has gunned down eight people in the Washington, D.C., area, investigators have turned to a relatively new technological tool: geographic profiling (Source: http://www.criminalprofiling.ch/sniper.html [15])
(Court TV) -- Barring a lucky break, the technology currently seems like the police's best chance to find the shooter, who has killed six, left millions on edge, and single-handedly lowered the attendance rate in Maryland suburban schools.The technique, first used in 1990, operates on the assumption that a serial murderer (or rapist) balances his desire to kill far from home to avoid being recognized with his desire to be in familiar territory. The tension between these two desires usually means that serial killers kill close to home, but not too close, leaving a "comfort zone" around their home that can be detected mathematically, according to Dr. Kim Rossmo, the technique's pioneer.
Investigators into the Maryland shootings have good cause to be hopeful about geographical profiling's potential. A software program that Rossmo developed called Rigel -- the only professional geographic profiling software currently available -- has in past cases pinpointed a criminal's home within a few blocks. On average, according to Rossmo, the program narrows the police's target area by 95 percent. But while geographic profiling could help the investigation, it can't point directly to the perpetrator. Even Rossmo warns against seeing geographic profiling as a solve-all investigative device. He has described it as an information management tool that gives police a way to better allocate their time and money. Rossmo has explained that geographic profiling can never solve a case alone. It can only help focus the investigator's search by pointing them in a direction most likely to produce tangible evidence or leads to the criminal.
Rigel works best when used by an experienced geographic profiler on a serial criminal who fits a specific profile. According to Ian Laverty, an engineer who helped develop Rigel and president of Environmental Criminal Research Incorporated, the firm that produces it, the software specializes in "hunters" -- criminals who leave their home base already planning to find a victim."A hunter works from a home site and travels out with a purpose of finding a victim and a location to commit the crime," said Laverty. "So [to best use Rigel] we must look at the nature of the crime and see if it is a hunter pattern." But not all serial killers are hunters. In his textbook on geographic profiling, Rossmo, now research director of the Police Foundation in Washington D.C., defines four other types: trappers who lure their victims to them; stalkers who follow their victims; poachers who travel away from home to hunt; and trollers who perpetrate crimes opportunistically while in the midst of other activities.
While not enough is publicly known about the Maryland shooter to determine his methodology, Rossmo believes that all criminals commit their first crimes close to home, only leaving the areas that they know as they gain confidence. By this logic, even if the shooter at large now modifies his behavior and expands his target zone, his first six shootings, all of which occurred within a five-mile area in Maryland, probably point toward his home. Of course, by the time the profile emerges, the killer could have moved. But if geographic profiling leads to the location of his former base of operations, even that would be a huge boost to the Maryland investigation.
In the summer of 1998, Rossmo assisted an investigation of a Lafayette, La., serial rapist who had attacked as many as 15 women in the area over a period of 11 years. After reading an article on geographic profiling, Maj. Jim Craft of the Lafayette police, who led the task force devoted to the criminal, invited Rossmo to help out. His geoprofile, which he sent to Craft after one or two months, allowed police to narrow the areas they patrolled. "It was helpful to prevent further attacks," Craft said. "Previously there was a pretty large area that we had to focus on to make sure we didn't have any further attacks. As a result of that profile we were able to narrow down our geographic area and focus our resources from an area of 60,000 people to a location with about 30,000 people in it." Although the geoprofile accurately predicted the killer's home area, the information did not end up helping them capture him. The case was solved when the police received an anonymous tip with the rapist's name. At the time of his arrest, the rapist had moved outside the area Rigel predicted. Still, Craft and the Lafayette Police Department were impressed with geographic profiling. "It's not going to specifically identify a perpetrator but it will help you focus your investigative efforts and narrow down or eliminate information from other areas," Craft said.
Whether Rigel will help in finding the Maryland shooter remains to be seen, but some proponents think it can be useful for more than serial murders. Says Laverty, "The technique itself is applicable to all types of serial crimes like robbery, burglary and arson."
Dr. Maurice Godwin suggests that Rossmo's geographical model (See Rossmo's description [21]) was wrong and offered another spatial model [22] for the shooter's behavior. Research findings also indicated that there is a strong relationship among the locations of the terrorist incident, terrorists’ preparatory behaviors, and where these terrorists reside. Research in terrorist geospatial patterns and behavior is found in Geospatial Analysis of Terrorist Activities: The Identification of Spatial and Temporal Patterns of Preparatory Behavior of International and Environmental Terrorists [23]. Based on this information and other profiling efforts, here are some of the inferences and speculations offered about the DC shooter prior to the arrest of the two suspects (http://www.corpus-delicti.com/prof_archives_profiles.html [24]):
- FBI / Inductive profilers
- white male
- 25 to 40 years old
- not a shooter and not likely military because of weapon choice (inaccurate round)
- lives in or near the community>
- no children
- >firefighter or construction worker
- possible terrorist links
- not a true spree killer because a true spree killer would have kept going south.
- Deductive profiling
- no evidence of race
- no evidence of one or two offenders
- anger motivation
- cumulative rage from successive failures in personal life
- straw that broke the camel's back would be an event in personal life such as divorce, custody battles, and/or loss of job.
- would want to talk about offenses
- case would most likely be solved by a tip from alert citizens
- no shooter training (not a very good shot)
- possible second or third party involved
- limited evidence of a terrorist connection
Quality of Information Check
Weighing the validity of sources is critical thinking that the confidence of any analytic judgments ultimately rest upon. Analysts should review the quality of their information and refresh their understanding of the strengths and weaknesses. This is part of becoming grounded in the problem. Without understanding the context and conditions under which critical information has been provided, it will be difficult for analysts to assess the information’s validity and establish a confidence level in an intelligence assessment.
Using the DC Shooter scenario, perform a brief quality of information check as part of your grounding. Specifically:
- Identify geospatial information sources that might be critical but were not provided;
- check for corroboration of the locations (coordinates) with the text;
- validity of the geospatial behavioral models used, and;
- indicate a level of confidence you have in the sources which are likely to be used in future analytic assessments.
Example Quality of Information Check Results:
The following geospatial evidence could have been useful given more time and resources:
- High resolution land characterization to determine if shooting locations had sufficient vegetation or other cover within rifle range;
- geospatial behavioral models for criminal activities associated with shooter events, and;
- street camera recordings to identify the people and vehicles present at the crime scene locations.
Corroboration of the locations with the text were as stated:
- Using Google Earth, the site descriptions and addresses matched the coordinates.
Level of confidence you have in the sources, which are likely to figure in future analytic assessments.
- We are confident in the general locations with respect to the address but not the specific locations with respect to the site and events.
DC Shooter Case: Hypothesis Development
- Disgruntled Michael’s employee;
- foreign terrorist;
- serial killer, and;
- domestic terrorist.
Evidence Development
Our initial evidence includes:
- Conforms to the geospatial model of a serial criminal.
- The majority of the shootings were at or near shopping centers. That is, the events are not near governmental buildings indicating that the government is not a target.
- Shootings were all on major highways or interstates for a quick exit from the scene. This indicates a desire not to be caught.
- There was only one shooting per location and often occurred at gas stations. This seems to indicate our Shooter is not in the role of a suicide terrorist.
- Sighting of a blue car with two black men.
- Sighting of a white van with two individuals at one killing.
- Military caliber weapon (5.56mm). This caliber is common to the US military and is also a sporting cartridge.
- Noise heard but shooter never seen. This possibly indicates some sniper training.
Fusion
A matrix with hypotheses across the top and evidence and arguments down the side is developed. Note that your evidence and arguments may or may not be geospatial in nature.
| Evidence/Argument | Michael's Employee | Foreign Terrorist | Serial Killer | Domestic Terrorist |
|---|---|---|---|---|
| 1. Conforms to the geospatial model of a serial criminal | ||||
| 2. All DC-area kilings occured within 30 days | ||||
| 3. The majority of the shootings were at or near shopping centers | ||||
| 4. Shootings were all on major highways or interstates | ||||
| 5. There was only one shooting per location and often occured at gas stations | ||||
| 6. Sighting of a blue car with two black men | ||||
| 7. Sighting of a white van with two individuals at one killing | ||||
| 8. Military caliber weapon(5.56mm) | ||||
| 9. Noise heard but shooter never seen |
Work down the evidence column and across the rows of the matrix, examining one item of evidence at a time to see how consistent that item of evidence is with each of the hypotheses. Make a notation C, I, and N/A standing for consistent, inconsistent, or not applicable. In this example, the evidence is weighted by using combinations of CC, II, C, and I.
| Evidence/Argument | Michael's employee | Foreign Terrorist | Serial Killer | Domestic Terrorist |
|---|---|---|---|---|
| 1. Conforms to the geospatial model of a serial criminal | I | C | I | C |
| 2. All DC-area kilings occured within 30 days | C | C | CC | C |
| 3. The majority of the shootings were at or near shopping centers | I | CC | C | CC |
| 4. Shootings were all on major highways or interstates | I | CC | CC | CC |
| 5. There was only one shooting per location and often occured at gas stations | I | II | CC | CC |
| 6. Sighting of a blue car with two black men | I | I | I | I |
| 7. Sighting of a white van with two individuals at one killing | I | C | C | C |
| 8. Military caliber weapon(5.56mm) | C | C | C | C |
| 9. Noise heard but shooter never seen | I | I | CC | CC |
Analyze the "diagnosticity" of each piece of evidence. We discover that the evidence of the rifle's caliber is not very helpful because it is consistent with all hypotheses. Refine the matrix by reconsidering the hypotheses and delete evidence and arguments that have no diagnostic value. In the case, I deleted the "Military caliber weapon (5.56mm)" evidence since it offered no diagnosticity.
| Evidence/Argument | Michael's employee | Foreign Terrorist | Serial Killer | Domestic Terrorist |
|---|---|---|---|---|
| 1. Conforms to the geospatial model of a serial criminal | I | C | I | C |
| 2. All DC-area kilings occured within 30 days | I | CC | C | CC |
| 3. The majority of the shootings were at or near shopping centers | I | CC | CC | CC |
| 4. Shootings were all on major highways or interstates | I | II | CC | CC |
| 5. There was only one shooting per location and often occured at gas stations | I | II | C | I |
| 6. Sighting of a blue car with two black men | I | C | C | C |
| 7. Sighting of a white van with two individuals at one killing | I | C | C | CC |
| 8. Noise heard but shooter never seen | I | I | CC | C |
Examine each the hypothesis one at a time by looking down the column to consider each hypothesis as a whole. Draw tentative conclusions by trying to disprove the hypotheses. Look at the “I”s to indicate evidence that may be inconsistent with a hypothesis. Generally, the hypothesis with the fewest “I”s is probably the most likely one. The hypothesis with the most “I”s is probably the least likely one.
| Evidence/Argument | Michael's employee | Foreign Terrorist | Serial Killer | Domestic Terrorist |
|---|---|---|---|---|
| Summary | I=8 C=0 |
I=5 C=7 |
I=-1 C=10 |
I=-1 C=11 |
Conclusions
The evidence leads us to believe the acts are either a foreign or domestic terrorist whose motivations are either unclear or are being concealed from the law enforcement authorities. There is also a preponderance of evidence to imply that there is actually a team committing the crimes and that it is not a single individual.
The analysis has lead us to the mostly likely hypothesis that the attacks were carried out by a terrorist with only a thin line between Domestic or Foreign. The milestones that would lead us to one or the other would be:
- An indication of motive - If the terrorist makes a list of demands that would indicate whether his goals are foreign based or domestic would be a solid indication of motive.
- An idealist alignment - If some sort of clue was left that showed the terrorist's beliefs, it would be much easier to pin point the terrorist's origins.
APPENDIX B: Report Formats
Geospatial Rapid Assessment
This report [25] is aimed at documenting the identification, discovery, filtering, and deriving of evidence, with a particular focus on geospatial information, to address the following analytic question. This effort is only intended as an initial building block which a subsequent analysis enhances and refines when making sense of the accumulated evidence in the context of the problem.
Geospatial Narrative
The geospatial narrative focuses on the sensemaking loop and involves iterative development of a mental model from the schema that best fits the evidence. The report documents the analysis of a place, events, and individuals linked to the location related aspects of an analytic question. An outline of this narrative is provided here. [26]
Bibliography
Abraham, T. and Roddick, J.F. (1998). Opportunities for knowledge discovery in spatiotemporal information systems. Advanced Computing Research Centre School of Computer and Information Science. Vol. 5. No. 2. Pp.1-12
Adams, S. and Goel, A.K. Making sense of VAST data. Artificial Intelligence Laboratory & Southeastern Regional Visual Analytics Center. Division of Interactive and Intelligent Computing. Georgia Institute of Technology.
Agam, G., Argamon, S., Frieder, O., Grossman, D., and Lewis, D. (2005). Complex document information processing: Towards software and test collections. Presented at the 2005 International Conference on Intelligence Analysis: The Office of the Assistant Director of Central Intelligence.
Adibi, J. and Chalupsky, H. (2005). Scalable group detection via a mutual information model. Presented at the 2005 International Conference on Intelligence Analysis: The Office of the Assistant Director of Central Intelligence.
Allen, G. and Marczyk, J. (2005). Tutorial on complexity managament for decision-making. Presented at the 2005 International Conference on Intelligence Analysis: The Office of the Assistant Director of Central Intelligence.
Alonso, R. and Li, H. (2005). Combating cognitive biases in information retrieval. Presented at the 2005 International Conference on Intelligence Analysis: The Office of the Assistant Director of Central Intelligence.
Andrews, S. (1997). The geologist as detective: A view of our profession. Geol. Soc. Amer. New England Section Meeting Maine.
Armstrong, S., Mark B., Kirkpatrick, S., Khalsa, S., Jennifer P., and Rieber, S. (2005). How can predictive accuracy be improved? Presented at the 2005 International Conference on Intelligence Analysis: The Office of the Assistant Director of Central Intelligence.
Auger, A. (2005). Applying natural language processing techniques to domain knowledge capture. Presented at the 2005 International Conference on Intelligence Analysis: The Office of the Assistant Director of Central Intelligence.
Blasch, E and S. Plano, “JDL Level 5 fusion model: user refinement issues and applications in group tracking,” SPIE Vol 4729, Aerosense, 2002, pp. 270 – 279.
Baar, D. (2005). Questions of focus: Advances in lens-based visualizations for intelligence analysis. Presented at the 2005 International Conference on Intelligence Analysis: The Office of the Assistant Director of Central Intelligence.
Badalamente, R.V. and Greitzer, F.L. (2005). Top ten needs for intelligence analysis tool development. Presented at the 2005 International Conference on Intelligence Analysis: The Office of the Assistant Director of Central Intelligence.
Bacastow, T.S. and Bellafiore, D.J. (2009). Redefining geospatial intelligence. American Intelligence Journal. Pp 38-40.
Bacastow, T.S., Bellafiore, D.J. and Bridges, D. (2010). The structured geospatial analytic method: Opening the discussion.
Baty, S. (2009). Deconstructing analysis techniques. Johnny Holland Magazine.
Ben-Israel, I. (1989). Philosophy and methodology of intelligence: The logic of estimate process. Intelligence and National Security. 4(4): Pp. 660-691.
Bennell, C. and Corey, S. (2007). Geographic profiling of terrorist attacks. In R.N. Kocsis (Ed.), Criminal profiling: International theory, research and practice. Totowa, NJ: Human Press Inc. Pp. 189-203.
Bixler, D. and Moldovan, D. (2005). SYNERGIST: An analyst's assistant. Presented at the 2005 International Conference on Intelligence Analysis: The Office of the Assistant Director of Central Intelligence.
Bixler, D, Moldovan, D. and Fowler, A. (2005). Using knowledge extraction and maintenance techinques to enhance analytical performance. Presented at the 2005 International Conference on Intelligence Analysis: The Office of the Assistant Director of Central Intelligence.
Blume, M. (2005). Automatic entity disambiguation: Benefits to NER, relation extraction, link analysis, and inference. Presented at the 2005 International Conference on Intelligence Analysis: The Office of the Assistant Director of Central Intelligence.
Blundell, J.S. and Opitz, D.W. Object recognition and feature extraction from imagery: The feature analyst approach. Visual Learning Systems, Inc.
Bobrow, R.J. and Helsinger, A. (2005). Kinetic visualizations: A new class of tools for intelligence analysis. Presented at the 2005 International Conference on Intelligence Analysis: The Office of the Assistant Director of Central Intelligence.
Bodnar, J.W. (2005). Making sense of massive data by hypothesis testing. Presented at the 2005 International Conference on Intelligence Analysis: The Office of the Assistant Director of Central Intelligence.
Bodnar, J.W. (2005). Making sense of massive data by hypothesis testing: slides. Presented at the 2005 International Conference on Intelligence Analysis: The Office of the Assistant Director of Central Intelligence. Pp 1-24.
Bodnar, J.W. (2005). Warning analysis for the information age: Rethinking the intelligence process. Presented at the 2005 International Conference on Intelligence Analysis: The Office of the Assistant Director of Central Intelligence.
Bodnar, J.W. (2005). Warning analysis for the information age: Rethinking the intelligence process. (slides). Presented at the 2005 International Conference on Intelligence Analysis: The Office of the Assistant Director of Central Intelligence. Pp. 1-129.
Boehm-Davis, D.A., Holt, R.W. and Hansberger, J. Pilot abitities and performance. George Mason University.
Bone, T., and Johnson, D. (2007). Human factors in GIS use: A review and suggestions for research. Proc ISECON 2007, v24 (Pittsburgh): §3323 (refereed).
Boner, C.M. (2005). Novel, complementary technologies for detecting threat activities within massive amounts of transactional data. Presented at the 2005 International Conference on Intelligence analysis: The Office of the Assistant Director of Central Intelligence.
Boroditsky, L. (2010). Lost in translation. Wall Street Journal: Life & Style. July 24,2010.
Boschee, E., Weischedel and Zamanian, A. (2005). Automatic information extraction. Presented at the 2005 International Conference on Intelligence Analysis: The Office of the Assistant Director of Central Intelligence.
Boslough, M. (2005). A distributed dynamic intelligence aggregation method. Presented at the 2005 International Conference on Intelligence Analysis: The Office of the Assistant Director of Central Intelligence.
Bringsjord, S., Clark, M., Shilliday, A., and Taylor, J. (Draft 2006). Harder, knowledge-based QA questions for intelligence analysts and the researchers who want to help them. Rensselaer Polytechnic Institute (RPI).Troy: NY.
Buede, D., Rees, R.L., Sticha, P., and Lewellyn, M. (2005). Bayesian networks: An analytic tool for predicting behavior. Presented at the 2005 International Conference on Intelligence Analysis: The Office of the Assistant Director of Central Intelligence.
Bunker, D.J. and Tuttle, R.F. (2005). On the feasibility of a peer-reviewed, classified MASINT journal. Presented at the 2005 International Conference on Intelligence Analysis: The Office of the Assistant Director of Central Intelligence.
Burghardt, M. D. and Hacker, M., (2004). Informed design: A contemporary approach to design pedagogy. Journal of Technology Education: Hofstra University Center for Technological Literacy.
Burgoon, J.K., Jensen, M.L., Meservy, T.O., Kruse, J., and Nunamaker Jr., J.F. (2005). Augmenting human identification of emotional states in video. Presented at the 2005 International Conference on Intelligence Analysis: The Office of the Assistant Director of Central Intelligence.
Burnett, M., Wooding, P. and Prekop, P. (2005). Sense making in the australian defence organisation (ADO) intelligence community. Defence Science and Technology Organisation (DSTO). Pp. 1-21.
Busbee, M., Drake,D., Gerogosian, D, and Pedtke, T.(SETA). (2005). 21st century intelligence production, analysis, access, and delivery. Presented at the 2005 International Conference on Intelligence Analysis: The Office of the Assistant Director of Central Intelligence.
Cai, G., MacEachren, A. M., Brewer, I., McNeese, M., Sharma, R., & Fuhrmann, S. (2005). Map-mediated geocollaborative crisis management. IEEE ISI-2005: IEEE International Conference on Intelligence and Security Informatics, Atlanta, Georgia.
Campbell,B. (2008). Identifying common types of error in spatial analysis. GEOG 570 Presentation.
Carbonell, J., Gazen, C., Jin, C., Hayes, P., Goldstein, A., Mathew, J., and Dietrich, D. (2005). Finding novel information in large, constantly incrementing collections of structured data. Presented at the 2005 International Conference on Intelligence Analysis: The Office of the Assistant Director of Central Intelligence.
Carter, D.L. (2006). The intelligence process. Law Enforcement Intelligence A Guide for State, Local and Tribal Law Enforcement Agencies. Chapter 5. Pp. 57-75.
Caskey, S., Chaudhari, U., Espstein, E., Floriam, R., McCarly, J.S., Omar, M., Ramaswamy, G., Roukos, S., and Ward, T. (2005). Infrastructure and systems for adaptive speech and text analytics. Presented at the 2005 International Conference on Intelligence Analysis: The Office of the Assistant Director of Central Intelligence.
Central Intelligence Agency. (1997). A compendium of analytic tradecraft notes. Directorate of Intelligence. 1 (notes 1-10).
Central Intelligence Agency. (2009). A tradecraft primer: Structured analytic techniques for improving intelligence analysis. Pp.1-40.
Chamberlin,T.C. (1897). The method of multiple working hypotheses. The Journal of Geology. 5: 837-848.
Cheng, J. and Senator, T. (2005). A combinatorial analysis of link discovery. Presented at the 2005 International Conference on Intelligence Analysis: The Office of the Assistant Director of Central Intelligence.
Chong-Ho, Y. (1994). Abduction? Deduction? Induction? Is there a logic of exploratory data analysis? Annual Meeting of American Educational Research Association. New Orleans, Louisiana. Pp. 2-11.
Clausner, T.C., Fox, J.R. (2005). A framework and toolkit for visualizing tacit knowledge. Presented at the 2005 International Conference on Intelligence Analysis: The Office of the Assistant Director of Central Intelligence.
Cluxton, D. and Eick, S.G. (2005). DECIDE Hypothesis visualization tool. Presented at the 2005 International Conference on Intelligence Analysis: The Office of the Assistant Director of Central Intelligence.
Cohen, M.S., Salas, E. and Riedel, S.L. (2002). Critical thinking: Challenges, possibilities, and purpose. Cognitive Technologies. Technical Report 02(1): Pp. 1-274.
Commission on Behavioral and Social Sciences and Education National Research Council.(2003). How people learn: Brain, mind, experience, and school (expanded edition). Washington, D.C.: National Academy Press.
Committee on Basic and Applied Research Priorities in Geospatial Science for the National Geospatial-Intelligence Agency, Mapping Science committe, and National Research Council.(2006). Priorities for GEOINT research at the national geospatial-intelligence-agency. Washington, D.C.: The National Academies Press.
Committee on Support for Thinking Spatially: The Incorporation of Geographic Information Science Across the K-12 Curriculum. (2006). Learning to Think Spatially. National Academies Press: Washington, DC. pp. 1-332. http://www.nap.edu/catalog.php?record_id=11019 [27]
Cook, K. (2005). Panel: The research and development agenda for visual analytics. Presented at the 2005 International Conference on Intelligence Analysis: The Office of the Assistant Director of Central Intelligence.
Cooper, J.R. (2005). Curing analytic pathologies: Pathways to improved intelligence analysis. Center for the Study of Intelligence, Central Intelligence Agency, Washington, D.C. pp. 1-69.
Costa, P.C.G., Barbara, D., Laskey, K.B., Wright, E.J., Alghamdi, G., Mirza, S., Revankar, M., and Shackelford, T. (2005). DTB project: A behavioral model for detecting insider threats. Presented at the 2005 International Conference on Intelligence Analysis: The Office of the Assistant Director of Central Intelligence.
Crystal, M.R. and Pine, C. (2005). Automated org-chart generation from intelligence message traffic. Presented at the 2005 International Conference on Intelligence Analysis: The Office of the Assistant Director of Central Intelligence.
D'Amore, R. (2005). Expertise tracking. Presented at the 2005 International Conference on Intelligence Analysis: The Office of the Assistant Director of Central Intelligence.
Davis, J. (1992). Improving the quality of analysis: Combating mindset. Stud. Intel. 36(5) 33-38.
Davis, J. Sherman Kent and the profession of intelligence analysis. Kent Center Occ. Pap. 1 (5) 1-16.
Davis, M. (1999). Seven step guide to ethical decision making. Ethics and The University. Pp. 166-167.
Deaton, C. Shepard, B, Klein, C., Mayans, C., Summers, B., Brusseau, A., Witbrock, M., and Lenat, D. (2005). The comprehensive terrorism knowledge base in cyc. Presented at the 2005 International Conference on Intelligence Analysis: The Office of the Assistant Director of Central Intelligence.
Dede, C. (2007). Theoretical perspectives influencing the use of information technology in teaching and learning. For the International Handbook of Information Technology in Primary and Secondary Education. Pp. 1-36.
Defense Science Board (DSB). (2009). Report of the Defense Science Board Task Force on Understanding Human Dynamics. Office of the Under Secretary of Defense For Acquisition, Technology, and Logistics.
Delp, B.T. (2008). Ethnographic intelligence (ETHINT) and cultural intelligence (CULINT): Employing under-utilized strategic intelligence gathering disciplines for more effective diplomatic and military planning. Institute for Infrastructure and Information Assurance, James Madison University. IIIA Technical Paper 08-02.
Department of the Treasury Financial Crimes Enforcement Network. (2010). Advisory to financial Institutions on filing suspicious activity reports regarding trade-based money laundering. pp 1-8. FIN-2010-A001.
Devlin, K. (2007). Giovanni Sommaruga (ed), Formal Theories of Infromation, Springer Verlag. Lecture Notes in Computer Science, 2009. Pp. 235-252.
Diekema, A.R., Hannouche, J., Ingersoll, G., Oddy, R.N., and Liddy, E.D. (2005). Analyst-focused arabic information retrieval. Presented at the 2005 International Conference on Intelligence Analysis: The Office of the Assistant Director of Central Intelligence.
Director of National Intelligence. Vision 2015: A Globally Networked and Integrated Intelligence Enterprise
Dixon, D.S. and Reynolds, W.N. (2005). Visualizing the political landscape. Presented at the 2005 International Conference on Intelligence Analysis: The Office of the Assistant Director of Central Intelligence.
Doucette, H. (2005). Threat and risk analysis (TRA): The intelligence analysts (IA) contribution. Presented at the 2005 International Conference on Intelligence Analysis: The Office of the Assistant Director of Central Intelligence.
Drake, D., Gerogosian, D., Pedtke, T., and Busbee, M. (2005). NASIC's digital production program: SAVANT. Presented at the 2005 International Conference on Intelligence Analysis: The Office of the Assistant Director of Central Intelligence. Pp. 1-14.
Drozdova, K. and Popp, R.(2008). Enhancing C4I systems with actionable human terrain knowledge. Presented at the Symposium on “Critical Issues in C4I” (Command, Control,Communications, Computing, and Intelligence), organized by the Armed Forces Communications & Electronics Association (AFCEA) and George Mason University (GMU), Washington:DC, pp. 1-4.
Dunyak, J, Costa, P. and Mohtashemi, M. (2005). A model of early detection of infectious disease outbreaks with application to biological terrorism. Presented at the 2005 International Conference on Intelligence Analysis: The Office of the Assistant Director of Central Intelligence.
Eggleston, R.G. and Mostashfi, A. (2005). Sensemaking support environment: "A thinking aid for all-source intelligence analysis work". Presented at the 2005 International Conference of Intelligence Analysis: The Office of the Assistant Director of Central Intelligence. Pp. 1-16.
Ehrmann, S.C. (1995). Asking the right question: What does research tell us about technology and higher learning? Change. The Magazine of Higher Learning. XXVII: 2. Pp. 20-27.
Esteban, J., Starr, A., Willetts, R., Hannah, P. and Bryanston-Cross, P. (2005). A review of data fusion models and architectures: towards engineering guidelines. Neural Computing and Applications. 14(4):273–281.
Eldridge, E.B. and Neboshynsky, A. J. (2008). Quantifying human terrain. Naval Postgraduate School. pp. 1-96.
Elm, W., Potter, S., Tittle, J., Woods, D., Grossman, J., and Patterson, E. (2005). Finding decision support requirements for effective intelligence analysis tools. Presented at the 2005 International Conference on Intelligence Analysis: The Office of the Assistant Director of Central Intelligence.
Ennis, R.H., (2002). Super-Streamlined conception of critical thinking. Criticalthinking.net.
Evans, D.K. and McKeown, K.R. (2005). Identifying similarities and difference across english and arabic news. Presented at the 2005 International Conference on Intelligence Analysis: The Office of the Assistant Director of Central Intelligence.
Facione, P.A. (2010 update). Critical thinking: What it is and why it counts. Measured Reasons and the California Academic Press, Millbrae, CA. pp. 1-24.
Fikes, R., Ferrucci, D. and Thurman, D. (2005). Knowledge associates for novel intelligence (KANI). Presented at the 2005 International Conference on Intelligence Analysis: The Office of the Assistant Director of Central Intelligence.
Finney, N. CPT. (2008) Human Terrain Team Handbook. Human Terrain System, 731 McClellan Ave, Fort Leavenworth, KS.
Fischer, S.C., Spiker, V.A., and Riedel, S.L. (2004). Critical thinking training for arym officers: Volume One: Overview of Research Program. Arlington, Va: US Army Research Institute for Behavioral and Social Sciences.
Flank, S. (2005). Measurably better: Bringing ROI assessments to intelligence tools. Presented at the 2005 International Conference on Intelligence Analysis: The Office of the Assistant Director of Central Intelligence.
Flynn, M.T. Major General, Pottinger, M. Captain, and Batchelor, P.D. (2010). Fixing intel: A blueprint for making intelligence relevant in Afghanistan. Voices from the Field. Center for a New American Security.
Folker Jr. R.D. Msgt. (2000) Intelligence analysis in theater joint intelligence centers: An experiment in applying structured methods. Joint Military Intelligence College. 1-46.
Forbus, K., Birnbaum,L., Wagner, E., Baker, J., and Witbrock, M. (2005). Analogy, intelligent IR, and knowledge integration for intelligence analysis: Situation tracking and the whodunit problem. Presented at the 2005 International Conference on Intelligence Analysis: The Office of the Assistant Director of Central Intelligence.
Fr´ed´eric Dambreville, F. (2009). Chapter 1: Definition of evidence fusion rules based on referee functions. D´el´egation G´en´erale pour l’Armement, DGA/CEP/EORD/FAS, Arcueil, France. pp. 1-32
Freitag, D., Blume, M., Byrnes, J., Calmbach, R., and Rohwer, R. (2005). A workbench for rapid development of extraction capabilities. Presented at the 2005 International Conference on Intelligence Analysis: The Office of the Assistant Director of Central Intelligence.
Galstyan, A. and Cohen, P.R. (2005). Identifying convert sub-networks through iterative node classification. Presented at the 2005 International Conference on Intelligence Analysis: The Office of the Assistant Director of Central Intelligence.
Galstyn, A. and Cohen, P.R. (2005). Is guilt by association a bad thing? Presented at the 2005 International Conference on Intelligence Analysis: The Office of the Assistant Director of Central Intelligence.
Gardner, S.B. (2005). A decentralized data fusion framework for horizontal integration of intelligence data. Presented at the 2005 International Conference on Intelligence Analysis: The Office of the Assistant Director of Central Intelligence.
Garvin, D. A. (1991). Barriers and gateways to learning. In Education For Judgement. Pp 3-13. Boston Massachusetts: Harvard Business School Press.
Gazen, C., Carbonell, J. and Hayes, P. Novelty detection in data streams: A small step towards anticipating strategic surprise. Presented at the 2005 International Conference on Intelligence Analysis: The Office of the Assistant Director of Central Intelligence.George, R.Z. and Bruce, J.B. (eds.) (2008). Intelligence analysis: The emergence of a discipline In George, R.Z. and Bruce, J.B. Analyzing intelligence: origins, obstacles and innovations. Georgetown University Press. Washington, DC.
Giovando, C. and Zhang, T. (2005). Spatial knowledge discovery through an integration of visual data exploration with data mining. ICA Seminar on Internet-Based Cartographic Teaching and Learning./ Gluck, K.A., Ball, J.T., Gunzelmann, G., Krusmark, M.A., and Lyon, D.R. (2005). A prospective look at a synthetic teammate for UAV applications. Paper presented at the American Institute of Aeronautics and Astronautics Infotech@Aerospace Conference, Reston, Va. Pp. 1-13.Gollege, R.G. (1992). Do people understand spatial concepts: The case of first-order primitives. University of California at Santa Barbara. Presented at the International GIS Conference, Pisa, Italy. pp. 1-22.
Greenblatt, S., Marcus, S. and Darr, T. (2005). TMODS - Integrated fusion dashboard: Applying fusion of fusion systems to counter-terrorism. Presented at the 2005 International Conference on Intelligence Analysis: The Office of the Assistant Director of Central Intelligence.
Greenlaw, S.A. and DeLeoach, S.B. (2003). Teaching critical thinking with electronic discussion. Journal Of Economic Education. 34(1): Pp. 36-52.
Greitzer, F.L. and Allwein, K. (2005). Metrics and measures for intelligence analysis task difficulty. Presented at the 2005 International Conference on Intelligence Analysis: The Office of the Assistant Director of Central Intelligence.
Groff, E. R. and La Vigne, N.G. (2002). Forecasting the future of predictive crime mapping. Crime Prevention Studies. 13: Pp. 29-57.
Haimson, C., Freeman, J., Wilson, C., and Richardson, A. (2005). An assesment and training system for imagery analysis and reporting. Presented at the 2005 International Conference on Intelligence Analysis: The Office of the Assistant Director of Central Intelligence.
Halpern, D.F. and Hakel, M.D. (2003). Applying the science of learning to the university and beyond: Teaching for long-term retention and transfer. Change: 35(4). Pp. 36-41.
Hampson, E. and Cowley, P. (2005). Instrumenting the intelligence analysis process. Presented at the 2005 International Conference on Intelligence Analysis: The Office of the Assistant Director of Central Intelligence.
Harmon, R.S. (2007). Army interest in geographic information science. NCGIA and Vespucci Specialist meeting on Volunteered Geospatial Information.
Hawks, M.R., Perram, G.P. and Tuttle, R.F. (2005). Initial demonstration of monocular passive ranging in the near infrared. Presented at the 2005 International Conference on Intelligence Analysis: The Office of the Assistant Director of Central Intelligence.
Heard, J., Prokop, J., Grossman, D., and Frieder, O. (2005). Scalability assessment of complex boolean queries. Presented at the 2005 International Conference on Intelligence Analysis: The Office of the Assistant Director of Central Intelligence.
Hegarty, M., Keehner, M., Cohen, C. A., Montello, D. R., & Lippa, Y. (2007). The role of spatial cognition in medicine: Applications for selecting and training professionals. In G. Allen (Ed.), Applied spatial cognition (pp. 285–315). Mahwah, NJ: Lawrence Erlbaum Associates.
Heuer, R., Personal communication, August 12, 2010.
Heuer, R., Personal communicaiton. August 15, 2010.
Heuer Jr., R.J. (2005). How does analysis of competing hypotheses (ACH) improve intelligence analysis? Version 1.2, © Richards J. Heuer, Jr. and Pherson Associates, LLC.
Heuer Jr., R.J. (2005). Improving intelligence analysis with ACH. Learning Aid ACH Version 2.0
Heuer Jr., R.J. (1999). Psychology of intelligence analysis. Center for the Study of Intelligence.
Heuer Jr., R.J., Pherson, R.H., and Miller Beebe, S. (2009). Analytic Teams, Social Networks, and Collaborative Behavior. Also appeared in “Collaboration in the National Security Arena: Myths and Reality – What Science and Experience Can Contribute to its Success” in June 2009.
Heuer, R., Good, L., Shrager, J., Stefik, M., Pirolli, P, and Card, S. (2007 Draft). ACH: A tool for analyzing competing hypotheses: Technical description for version 1.1. Palo Alto Research Center.
Heuer, R.J. (2009). The evolution of structured analytic techniques. Presentation to the National Academy of Science, National Research Council Committee.
Hewett. T.T. (2005). Observations on "Cognitive factors in design". Presented at the 2005 International Conference on Intelligence Analysis: The Office of the Assistant Director of Central Intelligence.
Hoogs, A., Chan, M.T., Bhotika, R., and Schmiederer, J. (2005). Recognizing complex behaviors in aerial video. Presented at the 2005 International Conference on Intelligence Analysis: The Office of the Assistant Director of Central Intelligence.
Horn,R.E. (2005). Connecting the smudges: How analytic info-murals may be of help in dealing with social messes. Presented at the 2005 International Conference on Intelligence Analysis: The Office of the Assistant Director of Central Intelligence.
Hunn, B.P., Schweitzer, K.M., Cahir, J.A. and Finch, M.M. (2008). IMPRINT:Analysis of an unmanned air system geospatial information process. Army Research Laboratory. ARL-TR-4513.
Hsiung, P., Moore, A., Neill, D., and Schneider, J. (2005). Alias detection in link data sets. Presented at the 2005 International Conference on Intelligence Analysis: The Office of the Assistant Director of Central Intelligence.
Hyatt, M. (2005). A comprehensive approach to reasoning. Presented at the 2005 International Conference on Intelligence Analysis: The Office of the Assistant Director of Central Intelligence.
International Association of Law Enforcement Intelligence Analysts, Inc., Peterson, M.B., Fahlman, R.C., Ridgeway, R.G., Erwin, P., and Kuzniar, M.T. (1996). Successful law enforcement using analytic methods. Pg. 1-22
Irandoust, H. and Boury-Brisset, A.C. (2005). Supporting critical thinking with critiquing systems in miltary c2 environments. Presented at the 10th International Command and Control Research and Technology Symposium: The Future of C2.
Irvine,J.M., Fenimore, C., Cannon, D., Roberts, J., Israel, S.A., Simon, L., et al. (2006). Development of a motion imagery quality metric. Presented at the ASPRS 2006 Annual Conference.
Jackson, L.A. "Jack" and Alt. Jonathan, L. MAJ., Team 12: Cultural geographay modeling and analysis for IDFW 18. IDFW 18-Team 12. Pp. 39-43.
Jakubchak, L.N. (2009). Abstract: The effectiveness of multi-criteria intelligence matrices in intelligence analysis. Prepared for the Annual Meeting of the International Studies Association, New York, NY. Pp. 1-27.
Jewett, D.L., What's wrong with single hypotheses?: Why it is time for strong-inference-plus. Scientist. 19(21)10.
Jones, D. and Walton, E. (2005). Measuring the utility of human language technology for intelligence analysis. Presented at the 2005 International Conference on Intelligence Analysis: The Office of the Assistant Director of Central Intelligence.
Jonker, D., Wright, W., Schroh, D., Proulx,P., and Cort, B., (2005). Information triage with TRIST. Presented at the 2005 International Conference on Intelligence Analysis: The Office of the Assistant Director of Central Intelligence.
Johnston, R. (2003). Developing a taxonomy of intelligence analysis variables. Studies in Intelligence. 47(3): Pp. 61-71.
Johnston, R. (2003). Integrating methodologists into teams of substantive experts. Stud.Intel. 47(1): 57-65.
Kaplan, R.M., Crouch, R., Holloway King, T., Tepper, M., and Bobrow, D. (2005). A note-taking appliance for intelligence analysts. Presented at the 2005 International Conference on Intelligence Analysis: The Office of the Assistant Director of Central Intelligence.
Kapler, T., Harper, R. and Wright, W. (2005). Correlating events with tracked movements in time and space: A geoTime case study. Presented at the 2005 International Conference on Intelligence Analysis: The Office of the Assistant Director of Central Intelligence.
Karcanes, J.A. (2007). Cultural competence and the operational commander: Moving beyond cultural awareness into culture-centric warfare. Naval War College, Newport, R.I. pp. 1-22.
Katter, R.V., Montgomery, C.A., and Thompson, J.R. (1979). Cognitive processes in intelligence analysis: A descrpiptive model and review of the literature. Technical Report 445.
Kerbel, J. (2008). Lost for words: The intelligence community’s struggle to find its voice. Parameters, pp 102-112.
Khalsa, S.K. (2005). Forecasting terrorism: Indicators and proven analytic techniques. Presented at the 2005 International Conference on Intelligence Analysis: The Office of the Assistant Director of Central Intelligence.
Kilcullen, D. J. (2005). Countering global insurgency. Journal of Strategic Studies. 28(4): 597-617.
Kilcullen, D.J. (2006). Counter-insurgency redux. Survival. (48) 4: 111-130.
Klein, G.L. and Adelman, L. (2005). A collaboration evaluation framework. Presented at the 2005 International Conference on Intelligence Analysis: The Office of the Assistant Director of Central Intelligence.
Klein, G., Moon, B. and Hoffman, R.R. (2006). Making sense of sensemaking 1: Alternative perspectives. IEEE Intelligent Systems. 21(4): Pp. 70-73.
Klein, G., Moon, B., and Hoffman, R.R. (2006). Making sense of sensemaking 2: A macrocognitive model. IEEE Intelligent Systems. 21(5): 88-92.
Kludas, J., Bruno, E., and Marchand-Maillet, S. (2007). Information fusion in multimedia information retrieval. In Proceedings of 5th international Workshop on Adaptive Multimedia Retrieval (AMR), Paris, France.
Kovalerchuk, B. (2005). Advanced data mining, link discovery and visual correlation for data and image analysis. Presented at the 2005 International Conference on Intelligence Analysis: The Office of the Assistant Director of Central Intelligence.
Kovalerchuk, B. (2005). Advanced data mining, link discovery and visual correlation for data and image analysis: Slides. Presented at the 2005 International Conference on Intelligence Analysis: The Office of the Assistant Director of Central Intelligence.
Kwok, K.L., Deng, P., Dinstl, N., Sun, H.L., Xu,W., Peng,P., and Doyon, J. (2005). CHINET: a chinese name finder system for document triage. Presented at the 2005 International Conference on Intelligence Analysis: The Office of the Assistant Director of Central Intelligence.
La Pierre, S.D. (1993). Issues of gender in spatial reasoning. Paper presented at the Annual Conference of the National Art Education Association (Chicago, IL, 1993).
La Pierre, S.D. (1988). Spatial reasoning and adults. Bozeman Montana: Center For Adult Learning Research, Montana State University. Pp 1-72.
Laird, S.K. and Richard, J.T. (2005). Voltaire: Insider threat modeling. Presented at the 2005 International Conference on Intelligence Analysis: The Office of the Assistant Director of Central Intelligence.
Lee, R. (2005). METS as a tool to support intelligence analysis. Presented at the 2005 International Conference on Intelligence Analysis: The Office of the Assistant Director of Central Intelligence.
Lehar, S. (1999). Gestalt isomorphism and the quantification of spatial perception. Gestalt Theory. 21(2): 122-138.
Levas, A., Brown, E., Murdock, J.W., and Ferrucci, D. (2005). The semantic analysis workbench (SAW): Towards a framework for knowledge gathering and synthesis. Presented at the 2005 International Conference on Intelligence Analysis: The Office of the Assistant Director of Central Intelligence.
Levine, S.C., Vasilyeva, M., Lourenco, S.F., Newcombe, N.S., and Huttenlocher, J. (2005). Socioeconomic status modifies the sex differnce in spatial skill. Psychological Science. 16. Pp. 841-845.
Lt Michael P. Murphy Awarded in Geospatial Intelligence. (2010).
Lohman, D.F. (1993). Spatial ability and g. Paper presented at the first Spearman Seminar, University of Plymouth.
Lowenthal, M.M. (2008). Towards a resonable standard for analysis: How right, how often on which issues? Intelligence and National Security. 23(6): Pp. 203-315.
MacEachin, D.J. (1997). CIA assessments of the Soviet Union. Stud. Intel. Semi-annual ed., Vol. 1, 157-65.
MacEachren, A.M. and Brewer, I. (2003). Developing a conceptual framework for visually-enabled geocollaboration. International Journal of Geographical Information Science.
MacEachren, A. M. and Kraak, M-J. (Draft, 2000; Forthcoming 2001). Research challenges in geovisualization. Cartography and Geographic Information Science. 28 (1).
MacEachren, A. M. Cartography and GIS: Facilitating collaboration I. GeoVISTA Center, Department of Geography, Penn State University.
Macskassy, S. A. and Provost, F. (2005). Suspicion scoring based on guilt-by-association, collective inference, and focused data access. Presented at the 2005 International Conference on Intelligence Analysis: The Office of the Assistant Director of Central Intelligence.
Mangio, C. A. and Wilkinson, B. J. (2008) Intelligence analysis: Once Again. Paper presented at the annual meeting of the ISA's 49th Annual Convention, Bridging Multiple Divides, Hilton San Francisco, San Francisco, CA, USA.
Mani, I. and Klein, G.L. (2005). Evaluating intelligence analysis arguments in open-ended situations. Presented at the 2005 International Conference on Intelligence Analysis: The Office of the Assistant Director of Central Intelligence.
Marrin, S. (2005). Intelligence analysis: Turning a craft into a profession. Proceedings of the 2005 International Conference on Intelligence Analysis. McLean, VA. May 2005.
Masback, K., Wade, A., Baxter, J., and Skelly, J. (2005). Human-systems effectiveness: An integrative concept for the intelligence community. Presented at the 2005 International Conference on Intelligence Analysis: The Office of the Assistant Director of Central Intelligence.
Maybury, M.T. (2006). Analytic environments of the future. Instituye for Defence and Government Advancement. (IDGA). Pp. 1-66.
Mayburg, M.T. (2005). Intelligent information access. (2005). Presented at the 2005 International Conference on Intelligence Analysis: The Office of the Assistant Director of Central Intelligence. Pp. 1-125.
Maybury, M.T. (2005). Intelligent information access: Theory and practice. Presented at the 2005 International Conference on Intelligence Analysis: The Office of the Assistant Director of Central Intelligence.
Maybury, M., Chase ,P., Cheikes, B., Brackney, D., Matzner, S., Hetherington, T., Wood, B., Sibley, C., Marin, J., Longstaff, T., Spitzner, L., Haile, J., Copeland, J., and Lewandowski, S. (2005). Analysis and detection of malicious insiders. Presented at the 2005 International Conference on Intelligence Analysis: The Office of the Assistant Director of Central Intelligence.
Maybury, M., Griffith, J., Holland, R., Damianos, L., Hu, Q., and Fish, R. (2005). Virtually integrated visionary intelligence demonstration (VIVID). Presented at the 2005 International Conference on Intelligence Analysis: The Office of the Assistant Director of Central Intelligence.
McCallum, A., Corrada-Emmanuel, A. and Wang, X. (2005). A probabilistic model for topic and role discovery in social networks and message text. Presented at the 2005 International Conference on Intelligence Analysis: The Office of the Assistant Director of Central Intelligence.
McCauley, C. (2005). Developing research interests of the homeland security national center of excellence for study of terrorism and response to terrorism (NC-START). Presented at the 2005 International Conference on Intelligence Analysis: The Office of the Assistant Director of Central Intelligence.
McFate, M. and Jackson, A.V. (2006). The object beyond war: Counterinsurgency and the four tools of political competition. Military Review. pp. 13-26.
McLaughlin, J. and Pate-Cornell, M.E. (2005). A bayesian approach to Iraq's nuclear program intelligence analysis: A hypothetical illustration. Presented at the 2005 International Conference on Intelligence Analysis: The Office of the Assistant Director of Central Intelligence.
Michalski, R.S. (1991). Toward a unified theory of learning: An outline of basic ideas. Proceedings of the First World Conference on the Fundamentals of Artificial Intelligence. Paris France.
Mihalcea, R. and Tarau, P. (2005). Multi-document summarization with iterative graph-based algorithms. Presented at the 2005 International Conference on Intelligence Analysis: The Office of the Assistant Director of Central Intelligence.
Mihelic, F.M. (2005). Generalist function in intelligence analysis. Presented at the 2005 International Conference on Intelligence Analysis: The Office of the Assistant Director of Central Intelligence.
Mikulec Jr., J.A. and Pinter, A. (2005). Making the grade: Academia and it's updated role in intelligence analysis. Presented at the 2005 International Conference on Intelligence Analysis: The Office of the Assistant Director of Central Intelligence.
Miller, H.J. and Han, J. (eds), 2001, Geographic Data Mining and Knowledge Discovery, London: Taylor and Francis.
Miller, H.J., and Han, J. (2000). Discovering geographic knowledge in data rich environments:A report on a specialist meeting. SIGKDD Explorations. 1(2) p. 105.
Moldovan, D. and Clark, C. (2005). Temporally relevant answer selection. Presented at the 2005 International Conference on Intelligence Analysis: The Office of the Assistant Director of Central Intelligence.
Moore, D.T. (2007). Critical thinking and intelligence analysis: Occasional paper number 14. National Defense Intelligence College Foundation. pp 1-134.
Morrison, C.T., Cohen, P.R., King, G.W., Moody, J., and Hannon, A. (2005). Simulating terrorist threat in the hats simulator. Presented at the 2005 International Conference on Intelligence Analysis: The Office of the Assistant Director of Central Intelligence.
Morse, E., Steves, M.P. and Scholtz, J. (2005). Metrics and methodologies for evaluating technologies for intelligence analysts. Presented at the 2005 International Conference on Intelligence Analysis: The Office of the Assistant Director of Central Intelligence.
Newcombe, N.S. (2007). Taking science seriously: Straight thinking about spatial sex differences. Washington, DC: APA Books. Pp. 1-10.
Newcombe,N.S. and Uttal, D.H. (2006). Whorf versus Socrates, round 10. TRENDS in Cognitive Sciences. 10 (9): 394-396.
Niewoehner, R.J. (2006). A critical thinking model for engineering. Presented at the 2nd International CDIO Conference. Linkoping University: Linkoping, Sweden. Pp. 1-12.
Noble, D. (2005). Structuring open source information to support intelligence analysis. Presented at the 2005 International Conference on Intelligence Analysis: The Office of the Assistant Director of Central Intelligence.
Ntuen, C.A. (2008). The process of sensemaking in complex human endeavors. 13th International Command & Control Research and Technology Symposium C2 for Complex Endeavors.
Ntuen, C.A. and Gwang-Myung, K. (2008). A sensemaking visualization tool with military doctrinal elements. 13th International Command & Control Research and Technology Symposium C2 for Complex Endeavors.
Ohlback, H.J., and Lorenz, B. (2005). Geospatial reasoning: Basic concepts and theory. A1-D2. Rewerse: Reasoning on the web. Pp. 1-18.
Osborne, D. (2006), Out of bounds: Innovation and change in law enforcement intelligence analysis. Center For Strategic Intelligence Research: JMIC Press: Pp. 1-177.
Office of the Director of National Intelligence. (2006). The US intelligence community’s five year strategic human capital plan: An annex to the US national intelligence strategy. Washington, DC: Government Printing Office.
Ohlbach, H.J., and Lorenz, B. (2005). Geospatial reasoning: Basic concepts and theory. Department of Computer Science; University of Munich. pp. 1-18.
Osias, D. (2005). Presentation of analytic uncertainties. Presented at the 2005 International Conference on Intelligence Analysis: The Office of the Assistant Director of Central Intelligence.
Padgett, T., Maniquis, A., Hoffman, M., Miler, W., and Lautenschlager, J. (2005). A semantic visualization tool for knowledge discovery and exploration in a collaborative environment. Presented at the 2005 International Conference on Intelligence Analysis: The Office of the Assistant Director of Central Intelligence.
Pepper, J.E. (1999). Competitive intelligence at Procter & Gamble. Competitive Intelligence Review, 10 (4) 4-9.
Perry, J., Janneck, C.D., Umoja, C., and Pottenger, W.M. (2009). Supporting Cognitive Models of Sensemaking in Analytic Systems. DIMACS Technical Report 2009-12.
Personick, M., Bebee, B., Thompson, B., Wang, Y., Jaworowski, M., Parsia, B., Clark, K., and Soechtig, C. (2005). An RDF prototype system for federation and semantic alignment of disparate counter-terrorism information sources. Presented at the 2005 International Conference on Intelligence Analysis: The Office of the Assistant Director of Central Intelligence.
Pfautz, J., Fouse, A., Roth, E., and Karabaich, B. (2005). Supporting reasoning about cultural and organizational influences in an intelligence analysis decision aid. Presented at the 2005 International Conference on Intelligence Analysis: The Office of the Assistant Director of Central Intelligence.
Pherson, R.(2005). Overcoming analytic mindsets: Five simple techiques. Emerging Issues in National and International Security. American College of Law: Washington D.C.
Pherson, R. (2009). Teaching structured analytic techniques breakout sessions II and IV. International Association for Intelligence Education (IAFIE). Pp. 1-4.
Pherson, R. (2009). Using analysis of competing hypotheses (ACH) to find the DC sniper. LEIU/IALEIA Training Conference.
Phythian, M. (2009). Intelligence analysis today and tomorrow. Security Challenges. 5(1): 67-83.
Pioch, N.J., Barlos, F., Fournelle, C., and Stephenson, T. (2005). A link and group analysis toolkit (LGAT) for intelligence analysis. Presented at the 2005 International conference on Intelligence Analysis: The Office of the Assistant Director of Central Intelligence. Pp 1-6.
Pirolli, P., & Card, S. (1999). Information foraging. Psychological Review, 106(4), 643-675.
Pirolli, P. and Card, S.K. (2005). The sensemaking process and leverage points for analyst technology. McLean, VA: Office of the Assistant Director of Central Intelligence for Analysis and Produciton.In the Proceedings of the 2005 International Conference on Intelligence Analysis.
Plumert, J.M., Hund, A.M. and Recker, K.M. (2007). Organism-environment interaction in spatial development: Explaining categorical bias in memory for location. The Emerging Spatial Mind. Pp. 25-51.
Pope, S. and Jøsang, A. Analysis of competing hypotheses using subjective logic. 10th International Command and Control Research and Technology Symposium. The University of Queensland, Australia. CRC for Enterprise Distributed Systems Technology (DSTC Pty Ltd).
Potts, J.T., Cook, D.J., Holder, L.B., and Coble, J. (2005). Learning concepts from intelligene data embedded in a supervised graph. Presented at the 2005 International Conference on Intelligence Analysis: The Office of the Assistant Director of Central Intelligence.
Pustejovsky, J. and Mani, I. (2005). Event and temporal awareness for intelligence analysis. Presented at the 2005 International Conference on Intelligence Analysis: The Office of the Assistant Director of Central Intelligence.
Quek, F., Rose, R.T. and McNeill, D. (2005). Multimodel meeting analysis. Presented at the 2005 International Conference on Intelligence Analysis: The Office of the Assistant Director of Central Intelligence.
Raeth, P. (2005). Target nomination for infrared surveillance and persistent imaging: Applying predictive anomaly detection to data reduction for operational sensors. Presented at the 2005 International Conference on Intelligence Analysis: The Office of the Assistant Director of Central Intelligence.
Raeth, P. (2005). Target nomination for infrared surveillance and persistent imaging: Applying predictive anomaly detection to data reduction for operational sensors:(slides) Presented at the 2005 International Conference on Intelligence Analysis: The Office of the Assistant Director of Central Intelligence. Pp. 1-31.
Random, R. A. (1958). Intelligence as a science. Stud. Intel. 2(2): 75-79.
Ratcliffe, J. (2000). Implementing and integrating crime mapping into a police intelligence environment. International Journal of Police Science & Management. 2 (4). Pp. 313-323.
Robson, D.W. (2005). Cognitive rigidity: methods to overcome it. Presented at the 2005 International Conference on Intelligence Analysis: The Office of the Assistant Director of Central Intelligence.
Rode, B. (2005). Towards a model of pattern recovery in relational data. Presented at the 2005 International Conference on Intelligence Analysis: The Office of the Assistant Director of Central Intelligence.
Rodriguez, A., Boyce, T., Lowrance, J. and Yeh, E. (2005). Angler: Collaboratively expanding your cognitive horizon. Presented at the 2005 International Conference on Intelligence Analysis: The Office of the Assistant Director of Central Intelligence.
Rohwer, R. (2005). Probability and information: The essential facts and concepts. Presented at the 2005 International Conference on Intelligence Analysis: The Office of the Assistant Director of Central Intelligence.
Rohwer, R. (2005). Probability and information: The essential facts and concepts. (slides). Presented at the 2005 International Conference on Intelligence Analysis: The Office of the Assistant Director of Central Intelligence. Pp. 1-90.
Rossmo, D.K., Thurman, Q.C., Jamieson, J.D., and Egan, K. (2008). Geographic patterns and profiling of illegal crossing of the southern u.s.. border. Security Journal (21). Pp 29-57.
Rothwell, K. (2007). The right questions to ask. Competitive Intelligence Magazine. 10 (6) 45-46.
Rowe, N.C. (2005). Automatic detection of fake file systems. Presented at the 2005 International Conference on Intelligence Analysis: The Office of the Assistant Director of Central Intelligence.
Rubin, D. Vidich, M., Kletter, D., and Russ, S. (2005). Transforming intelligence using industry best practices - The terrorism value chain. Presented at the 2005 International Conference on Intelligence Analysis: The Office of the Director of Central Intelligence.
Russell, D.M. and Slaney, M. (2004). Measuring the Tools and Behaviors of Sensemaking. Submitted to CHI 2004. 1-4.
Russell, D.M., Slaney, M, Qu', Y., and Houston, M. (2005). A cost structure analysis of manual and computer-supported sensemaking behavior. Presented at the 2005 International Conference on Intelligence Analysis: The Office of the Assistant Director of Central Intelligence.
Russell, D.M., Stefik, M.J., Pirolli, P., and Card, S.K. (1993). The cost structure of sensemaking. Paper presented at the INTERCHI '93 Conference on Human Factors in Computing Systems, Amsterdam.
S. Pope, A. Jøsang, and D. McAnally. "Formal Methods of Countering Deception and Misperception in Intelligence Analysis". In the proceedings of the 11th ICCRTS Coalition Command and Control in the Networked Era, Cambridge, 2006.
Sanfilippo, A. Baddeley, B., Cowell, A.J., Gregory, M.L., Hohimer, R., and Tratz, S. (2005). Building a human information discourse interface to uncover scenario content. Presented at the 2005 International Conference on Intelligence Analysis: The Office of the Assistant Director of Central Intelligence.
Santos Jr., E., Zhao, Q., Johnson Jr., G., Hguyen, H., and Thompson, P. (2005). A cognitive framework for information gathering with deception detection for intelligence analysis. Presented at the 2005 International Conference on Intelligence Analysis: The Office of the Assistant Director of Central Intelligence.
Sawka, K. and Fiora, B. (2005). Tailoring scenario analysis for short-term-policy challenges. Presented at the 2005 International Conference on Intelligence Analysis: The Office of the Assistant Director of Central Intelligence.
Schaner, E.X. (2008). The human terrain system: Achieving a competitive advantage through enhanced “population-centric” knowledge flows. Naval Postgraduate School. pp. 1-87.
Schneider, D., Matuszek, C., Shah, P., Kahlert, R., Baxter, D., Cabral, J., Witbrock M., and Lenat, D. (2005). Gathering and managing facts for intelligence analysis. Presented at the 2005 International Conference on Intelligence Analysis: The Office of the Assistant Director of Central Intelligence.
Scholtz, J., Morse, E. and Hewett, T. (2005). An analysis of qualitative and quantitative data from professional intelligence analysts. Presented at the 2005 International Conference on Intelligence Analysis: The Office of the Assistant Director of Central Intelligence.
Schone, P., McNamee, P., Morris, G., Ciany, G., and Lewis, S. (2005). Searching conversational telephone speech in any of the world's languages. Presented at the 2005 International Conference on Intelligence Analysis: The Office of the Assistant Director of Central Intelligence.
Schraagen, J.M., Eikelboom, A., Dongen, K.V., and Brake, G.T. (2005). Experimental evaluation of a critical thinking tool to support decision making in crisis situations. Proceedings of the 2nd International ISCRAM Conference (B. Van de Walle and B. Carle, eds.). Brussels, Belgium.
Seidenberg, J. (2005). Cultural Competency in Disaster Recovery: Lessons Learned from the Hurricane Katrina Experience for Better Serving Marginalized Communities. University of California, Berkeley School of Law; Berkeley: CA. pp 1-30.
Sieck, W. R., Klein, G., Peluso, D.A., Smith, J.L. and Harris-Thompson, D., Klein Associates, Inc. (2007). Focus: A model of sensemaking. United States Army Research Institute for the Behavioral and Social Sciences. Pp. 1-15.
Siegel, N., Shepard, B., Cabral, J., and Witbrock, M. (2005). Hypothesis generation and evidence assembly for intelligence analysis: Cycorp's nooscape application. Presented at the 2005 International Conference on Intelligence Analysis: The Office of the Assistant Director of Central Intelligence.
Sinclair, R.S. (2010), Thinking and writing: Cognitive science and intelligence anaysis. Revised edition of a monograph originally published by CSI in 1984. Center for the Study of Intelligence.
Silverman , B. G. (2007) Human Terrain Data: What should we do with it? Proceedings of the 2007 Winter Simulation Conference. Henderson, S.G. Biller, B. Hsieh, M-H, Shortle, J. Tew, J.D. and . Barton, R.R. eds.
Silverman, B. 2007. Human terrain data – What should we do with it? In: Henderson, S.G. et al. Proceedings of 2007 Winter Simulation Conference.
Silverman, B.G., Rees, R.L. and Toth, J.A. (2005). Tutorial: " Role playing strategy games for intelligence analysis". Presented at the 2005 International Conference on Intelligence Analysis: The Office of the Assistant Director of Central Intelligence.
Silverman, B.G., Rees, R.L., Toth, T.A., Cornwell, J., O'Brien, K., Johns, M., and Caplan, M. (2005). Athena's prism-A diplomatic strategy role playing stimulation for generating ideas and exploring alternatives. Presented at the 2005 International Conference on Intelligene Analysis: The Office of the Assistant Director of Central Intelligence.
Smith, B.L., Cothren, J., Roberts, P. and Damphousse, K.R. (2008). Geospatial analysis of terrorist activities: The identification of spatial and temporal pattern of prepartory behavior of international and environmental terrorists. Terriorism Research Center in Fulbright College: Pp 1-86.
Smith, J.R., Campbell, M., Naphade, M., Natsev, A., and Tesic,J. (2005). Learning and classification of semantic concepts in broadcast video. Presented at the 2005 International Conference on Intelligence Analysis: The Office of the Assistant Director of Central Intelligence.
Smith, M.A., Bair, W., and Movshon, J.A. (2002). Signals in macaque striate cortical neurons that support the perception of glass patterns. The Journal of Neuroscience. 22(18): 8334-8345.
Srihari, R.K., Li, W., Crist, L., and Niu, C. (2005). Intelligence discovery portal based on corpus level information extraction. Presented at the 2005 International Conference on Intelligence Analysis: The Office of the Assistant Director of Central Intelligence.
Strang, S.J. (2005). Project SLEIPNIR: An analytical technique for operational priority setting. Presented at the 2005 International Conference on Intelligence Analysis: The Office of the Assistant Director of Central Intelligence.
Stapleton-Gray, R. (2005). Watchin' the analysts. Presented at the 2005 International Conference on Intelligence Analysis: The Office of the Assistant Director of Central Intelligence.
Starr, H. (2005). Territory, proximity, and spatiality: The geography of international conflict. International Studies Review. Vol. 7; pp. 387-406.
Stech, F.J. and Elsaesser, E. (2005). Deception detection by analysis of competing hypotheses. Presented at the 2005 International Conference on Intelligence Analysis: The Office of the Assistant Director of Central Intelligence. Pp.1-6.
Steingold, S., Fournelle, C. and White, J.V. (2005). Clustering and threat detection. Presented at the 2005 International Conference on Intelligence Analysis: The Office of the Assistant Director of Central Intelligence.
Sticha, P., Buede, D. and Rees, R.L. (2005). Apollo: An analytical tool for predicting a subject's decision making. Presented at the 2005 International Conference on Intelligence Analysis: The Office of the Assistant Director of Central Intelligence.
Stofan, K. (2008). Estimating pashtun sub-tribal populations in mizan district, zabul province, afghanistan using quickbird satellite imagery and dasymetric mapping. Geographic Information Systems for the Geospatial Intelligence Professional Summer 2008 Capstone Project. Pp. 1-5.
Stokes, J. (2005). The blind painter and the cartesian theater. New Scientist.
Strohman, T., Metzler, D., Turtle, H., and Croft, W.B. (2005). Indri: A language-model based search engine for complex queries. Presented at the 2005 International Conference on Intelligence Analysis: The Office of the Assistant Director of Central Intelligence.
Strzalkowski, T., Small, S., Hardy, H., Yamrom, B., Liu, T., Kantor, P., Ng, K.B., and Wacholder, N. (2005). HITIQA: A question answering analytical tool. Presented at the 2005 International Conference on Intelligence Analysis: The Office of the Assistant Director of Central Intelligence. Pp 1-6.
Talbot, P.J. and Ellis, D.R. (2002). Computational antiterrorism solutions using a general-pupose evidence fusion engine. Technology Review Journal. pp 23-36.
Taylor, S.M. (2005). The several worlds of the intelligence analyst. Presented at the 2005 International Conference on Intelligence Analysis: The Office of the Assistant Director of Central Intelligence.
Tecuci, G., Boicu, M., Ayers, C., and Cammons, D. (2005). Personal cognitive assistants for military intelligence analysis: Mixed- initiative learning, tutoring, and problem solving. Presented at the 2005 International Conference on Intelligence Analysis: The Office of the Assistant Director of Central Intelligence.
Thompson, P., National Center for the Study of Counter-Terrorism and CyberCrime, Santos Jr., E.,Zhao, Q., Johnson, G., and Nguyen, H. (2005). Counter denial and deception and utility-theoretic information retrieval for intelligence analysis. Presented at the 2005 International Conference on Intelligence Analysis: The Office of the Assistant Director of Central Intelligence.
Tovey, M. (Editor) (2008). Collective intelligence: Creating a prosperous world at peace. Earth Intelligence Network (EIN), Oakton, Virginia.
Treverton, G.F., Gabbard, C.B. (2008). Assessing the tradecraft of intelligence analysis. Intelligence Policy Center (IPC) of the RAND National Security Research Division (NSRD).
Tsou, B.K.Y., Yuen, R.W.M., Kwong, O.Y., Lai, T.B.Y., and Wong, W.L., (2005). Polarity classification of celebrity coverage in the chinese press. Presented at the 2005 International Conference on Intelligence Analysis: The Office of the Assistant Director of Central Intelligence.
Turner, A., Hetzler, E., Cheney, B., Williams, L., and Zabriskie, S. (2005). Method and system for prospective analysis of alternative futures. Presented at the 2005 International Conference on Intelligence Analysis: The Office of the Assistant Director of Central Intelligence.
Tzoukermann, E., Davis, A., Houghton, D., Rennert, P., Rubinoff, R., Sibley, T.V., and Udani, G. (2005). Knowledge discovery via content indexing of multimedia and text. Presented at the 2005 International Conference on Intelligence Analysis: The Office of the Assistant Director of Central Intelligence.
United Nations Office on Drugs and Crime. (Approximate publication date, 2002). Criminal intelligence training: Manual for Analysts. Regional Programme Office Southeastern Europe.
United States, (2009). Intelligence guide for first responders. ITACG: Interagency Threat Assessment and Coordination Group. Washington, D.C.
Valtorta, M., Dang, J., Goradia, H., Huang, J., and Huhns, M. (2005). Extending Heuer's analysis of competing hypotheses method to support complex decision analysis. Presented at the 2005 International Conference on Intelligence Analysis: The Office of the Assistant Director of Central Intelligence.
Vane, R., Griffith, D., Starr, C., and Schenaker, M. (2005). Agent augmented structured arguments. Presented at the 2005 International Conference on Intelligene Analysis: The Office of the Assistant Director of Central Intelligence.
Waclar, H., Christel, M., Hauptmann, A., and Ng, T.D. (2005). ENVIE: Extensible news video exploitation for intelligence analysis. Presented at the 2005 International Conference on Intelligence Analysis: The Office of the Assistant Director of Central Intelligence.
Waller, D., Loomis, J.M., Golledge, R.G., and Beall, A.C. (2002). Place learning in humans: The role of distance and direction information. Spatial Cognition and Computation, 2(4): Pp. 333-354.
Waltz, E. (2005). Integrating methods and tools to counter denial and deception. Presented at the 2005 International Conference on Intelligence Analysis: The Office of the Assistant Director of Central Intelligence.
Wang, R., Kogut, P., Zhu, S., Leung, Y., and Yen, J. (2005). Semantic web enabled collaborative agents for supporting analyst teams. Presented at the 2005 International Conference on Intelligence Analysis: The Office of the Assistant Director of Central Intelligence.
Wang, Z., Chow, E. and Rohwer, R. (2005). Experiments with grounding spaces, pseudo-counts, and divergence formulas in association-grounded semantics. Presented at the 2005 International Conference on Intelligence Analysis: The Office of the Assistant Director of Central Intelligence.
Ward, D. (2005). The findability quotient: Making Intel accessible. Presented at the 2005 International Conference on Intelligence Analysis: The Office of the Assistant Director of Central Intelligence.
Wells III, L. and Horowitz, B. (2005). A methodology for the ranking of suicide bomber recruitment preferences using multiple sources of data. Presented at the 2005 International Conference on Intelligence Analysis: The Office of the Assistant Director of Central Intelligence. Pp. 1-6.
Westby, J.R. (2002). A shift in geo-cyber stability & security. ANSER Institute of Homeland Security Conference "Homeland Security 2005: Charting the Path Ahead". Pp. 1-25.
Wheaton, K. J. (2009). Evaluating Intelligence. Retrieved April 27, 2010 from www.sourceandmethods.blogspot.com [28]
Wheaton, K.J. (2008). What do words of estimative probability mean? Retrieved April 27, 2010 from www.sourceandmethods.blogspot.com [28]
Wheaton, K.J., and Chido, D.E (2006). Structured analysis of competing hypotheses: Improving a tested intelligence methodology. Competitive Intelligence Magazine. 9 (6) 12-15.
White, J.V. and Fournelle, C.G. (2005). Threat Detection for improved link discovery. Presented at the 2005 International Conference on Intelligence Analysis: The Office of the Assistant Director of Central Intelligence.
Wineera, J. (2009). Inter-Bella: Understanding the area of operations ecosystem. Colloquium; 2(2): pp. 1-11.
Wolfberg, A. (2005). Investing in the social capital of knowledge. Presented at the 2005 International Conference on Intelligence Analysis: The Office of the Assistant Director of Central Intelligence. Pp. 1-6.
Wolverton, M., Harrison, I., Lowrance, J., Rodriguez, A., and Thomere, J. (2005). Supporting the pattern development cycel in intelligence gathering. Presented at the 2005 International Conference on Intelligence Analysis: The Office of the Assistant Director of Central Intelligence.
Wright, E.J. and Laskey, K.B. (2006). Credibility models for multi-source fusion. Proceedings of the 9th International Conference on Information Fusion.
Wright, R., Thompson W.L., Ganis, G., Newcombe,N.S., and Kosslyn, S.M. 2008. Training generalized spatial skills. Psychonomic Bulletin & Review 15(4): 763-771.
Wright, W., Schroh, D., Proulx, P., Skaburskis, A., and Cort, B. (2005). Advances in nSpace-the sandbox for analysis. Presented at the 2005 International Conference on Intelligence Analysis: The Office of the Assistant Director of Central Intelligence.
Yang, Y., Yoo, S., Zhang, J., and Kisiel, B. (2005). A cross-benchmark evaluation of adaptive filtering methods. Presented at the 2005 International Conference on Intelligence Analysis: The Office of the Assistant Director of Central Intelligence.
Yore, L.D. (2008). Quality science and mathematics education research: Considerations of argument, evidence, and generalizability. University of Victoria, Victoria, Canada.
Yuan, M., Buttenfield, B. P., Gahegan, M., and Miller, H. (2001). Geospatial Data Mining and Knowledge Discovery. UCGIS White Paper, accepted by Council vote June 2000, revised November 2001. Washington: DC.
Yun, Y.W. and Kim, Y.O. (2007). The effect of depth and distance in spatial cognition. Proceedings, 6th International Space Syntax Symposium, İstanbul.
Zelenko, D., Aone, C. and Tibbetts, J. (2005). Trainable evidence extraction system (TEES). Presented at the 2005 International Conference on Intelligence Analysis: The Office of the Assistant Director of Central Intelligence.
Zhang, L. and Guan, Y. (2005). Topology-aware single message attack traceback. Presented at the 2005 International Conference on Intelligence Analysis: The Office of the Assistant Director of Central Intelligence.
Zhang, P., Soergel, D., Klavans, J. L. and Oard, D. W. Extending Sense-Making Models with Ideas from Cognition and Learning Theories. The ASIS&T 08 Annual Conference (Columbus, Ohio, Oct, 2008).