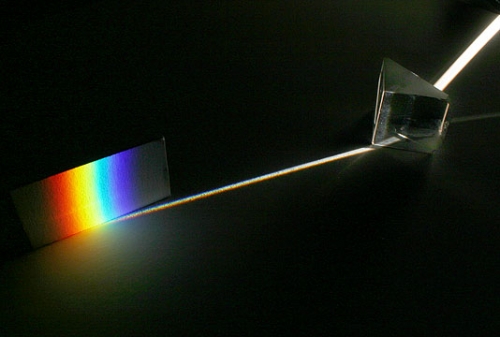
If you have ever seen a rainbow in the sky, or if you have ever seen light pass through a prism and appear to emerge as a rainbow, you have seen a spectrum. What you have witnessed in either of these two cases is white light being dispersed. The different colors of light bend by different amounts when they pass through a glass prism or water droplets. That is, when white light passes through water droplets in our atmosphere, the waves of red light get bent by a different amount than the waves of blue light, so the white light coming to you appears spread out into a rainbow.
When astronomers refer to a spectrum of light, they usually mean one of two things. They either mean an image that has been taken of the dispersed light from a source, such as this example:
(Or, as another example, a detailed spectrum of the sun),
or they mean a two dimensional graph of one of these images that plots the intensity (or brightness) of the light at a given color (which is represented usually by wavelength or frequency). See this example:
A Hubble Space Telescope spectrum of a peculiar type of star called a blue straggler.
In the blue straggler plot, a wavelength (or color) where the intensity is near 1.0 means a lot of light was received from the source with this color. On the other hand, wavelengths where the intensity is near 0.0 received very little light from the source with this color. The dips in the graph that fall to nearly zero correspond to the dark bands you see in the spectrum of the Sun, above.
We will use the word "spectrum" interchangeably to refer to these two different representations of the dispersed light from an object—either an image or a two dimensional plot—but, in both cases, what we can determine is how much light with a specific wavelength was received from an object. The Sloan Digital Sky Survey has an even more detailed set of information about astronomical spectra and how they are analyzed.
Try This!
To get a better feel for how astronomers go from images of spectra to the 2D plots of these spectra, use the “Mini-spectroscope” at the following link: Mini Spectroscopy (Note: This uses Java, so if you do not see anything but text on the linked page, try another browser or update your Java installation)
- Observe the images of the spectra of different light sources in the upper panel by selecting fluorescent lamp, Sun, red LED, etc., from the drop down menu.
- Compare the image of the spectrum to its 2D plot in the panel beneath it.
- Note that where the image is brightest, there will be peaks in the plot, and where the image is darkest, there will be dips in the plot.
These narrow features are usually referred to as “emission lines” if they are peaks, or “absorption lines” if they are dips or troughs in the spectrum. We will discuss these more in the next section.