
Mountain Glaciers
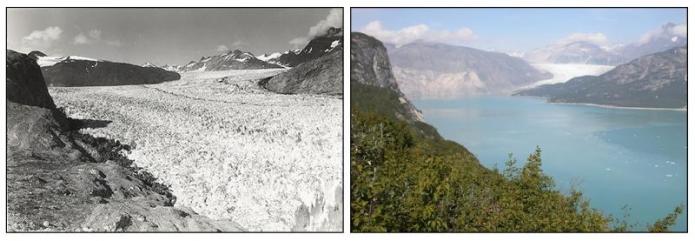
We’ll start with some striking images taken by glaciologists around the world — these are photos of mountain glaciers taken from the same spot at different times, and they provide us with some fairly shocking observations on just how much glaciers can change and have done so recently.
For another Alaskan example, we turn to satellite imagery of Columbia Glacier, which obviously does not reach back into time as far, but nevertheless, there are some dramatic changes evident here:
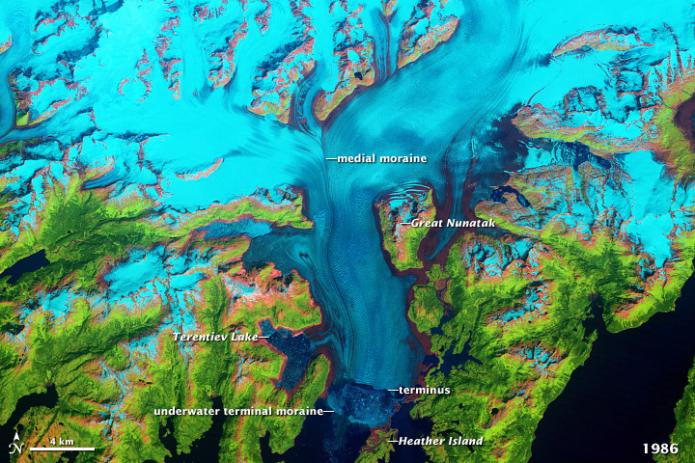
The above scene is from 1986, and at this point in time, the end of the glacier (terminus) is located down near the bottom of the image. Below, we jump forward in time to 2011:
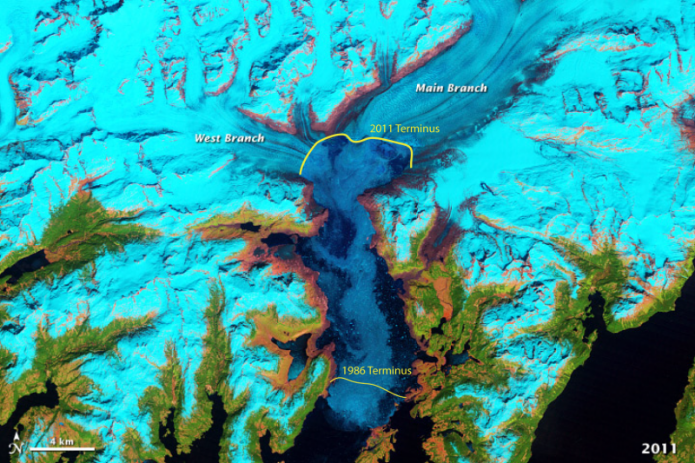
As you can see, the terminus here has retreated by about 15 km in just 25 years — a very impressive rate.
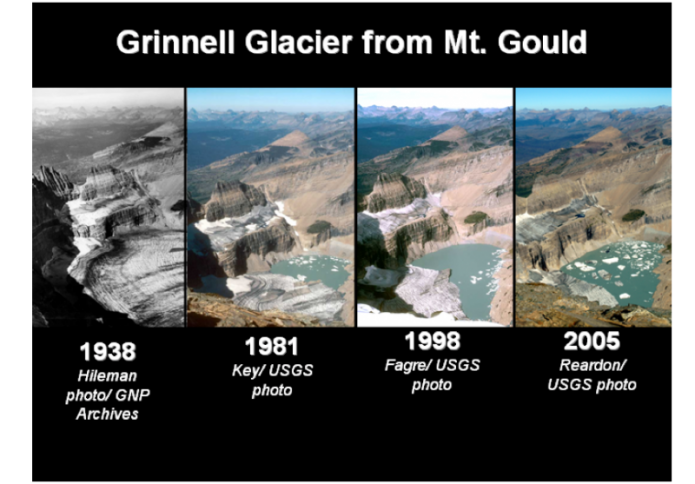
Grinnell Glacier, in Glacier National Park, Montana, as seen from the same vantage point over a 67 year period. The glaciers in this famous national park are all in such rapid retreat that the park may need a new name in a few decades.
Glaciers in the Alps are shrinking too. Check out SwissEduc Glaciers online to see one good example — at the bottom of the page is a comparison that flips back and forth from the past to the present as you move your mouse over the image.
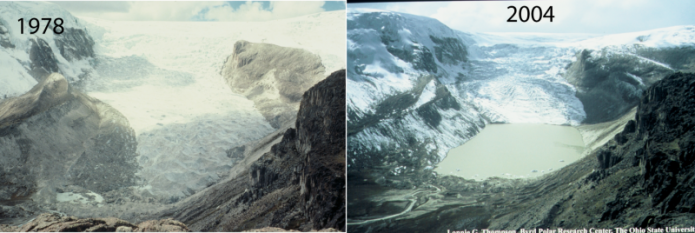
The same story as seen in Alaska, Montana, and the Alps holds for glaciers in more tropical settings, as can be seen from the images of Qori Kalas glacier in the Andes Mountains of Peru, below.
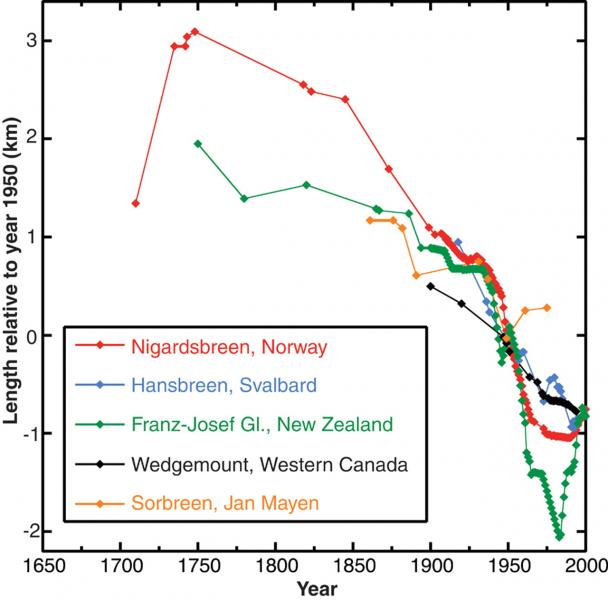
Studies of glaciers around the world show that an overwhelming majority are losing mass over time. In most cases, this loss of mass is reflected in the glaciers' retreating, so the length of the glacier becomes smaller. The figure below shows a selection of data from glaciers around the world, documenting this pattern of retreat.
The vast majority of glaciers on Earth are melting, and this melting began about the time that the temperature records indicate the beginning of warming, around the beginning of the 1900s.
If you combine the records of glacier length changes from around the world into one graph, we can get a pretty clear idea of what is happening.
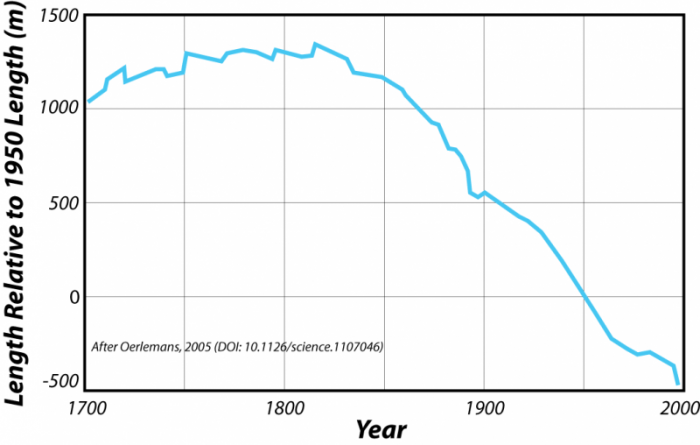
On the graph above, the y-axis plots the length of the glaciers relative to their length in 1950 — so this is a kind of length anomaly. A positive number means that on average, glaciers were longer than they were in 1950; negative numbers mean they were shorter. Here, we can see that beginning around 1850, glaciers around the world begin to shrink, and this trend continues to the present. The average glacier has retreated almost 2 kilometers in this time.
It is possible to estimate the magnitude and history of temperature change needed to produce this history of glacial retreat, and Oerlemans (2005) did this using a simple model; the results are shown below.
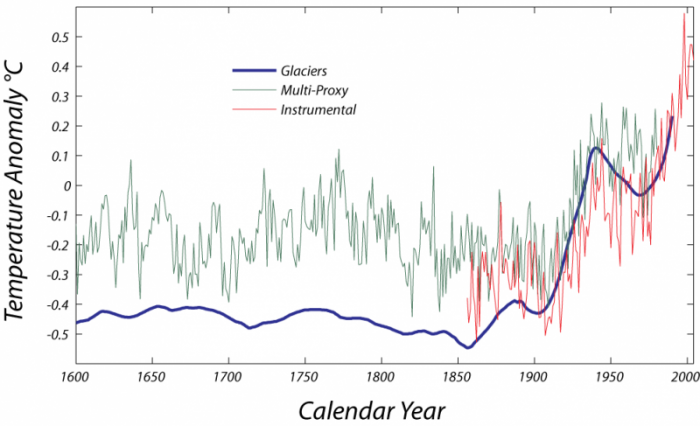
The thick blue line here is the temperature history needed to produce the timing and magnitude of the glacial retreat history shown in the previous figure. For comparison, we also see the instrumental temperature record in red (Jones and Moburg, 2003) and the temperature reconstruction based on multiple climate proxies (Mann et al., 1999). Note the excellent match with the instrumental record in the last century.