Correlation is a measure of the strength of the linear relationship between two quantitative variables. The equation for the correlation coefficient is:
Correlation coefficient takes a value between -1 and 1. As you can see in the following video, a correlation coefficient of 1 indicates a strong positive linear relationship between two variables and a correlation coefficient of -1 shows a strong negative linear relationship. And if two variables are not related or not linearly related, the correlation coefficient can take a value close to zero.
Strength of linear association
The video shows a graph with the explanatory variable on the x-axis and the response variable on the y-axis. There are many points on the graph. The correlation value is shifted from -1 to 1. What the correlation is -1 the points are in a linear, negatively sloped line. As the correlation value changes until the correlation value reached +1 where the points are now in a linear, positively sloped line.
As we learned in a previous lesson, a high correlation between spot and futures market prices makes the hedging efficient. Note that in the case of backwardation, the correlation between spot and futures would be lower.
Example:
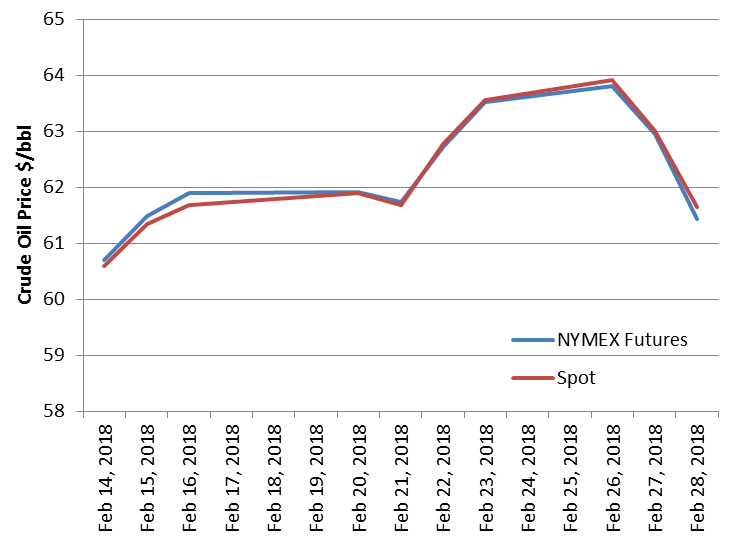
The following chart shows the last 10 prices of February 2018 crude oil spot and futures from EIA.
| Date | NYMEX Futures$/bbl | Spot$/bbl |
|---|---|---|
| Feb 14, 2018 | 60.7 | 60.6 |
| Feb 15, 2018 | 61.48 | 61.34 |
| Feb 16, 2018 | 61.89 | 61.68 |
| Feb 20, 2018 | 61.91 | 61.9 |
| Feb 21, 2018 | 61.73 | 61.68 |
| Feb 22, 2018 | 62.72 | 62.77 |
| Feb 23, 2018 | 63.52 | 63.55 |
| Feb 26, 2018 | 63.81 | 63.91 |
| Feb 27, 2018 | 62.94 | 63.01 |
| Feb 28, 2018 | 61.43 | 61.64 |
The following chart displayed the data and, as you can see, they are closely related.
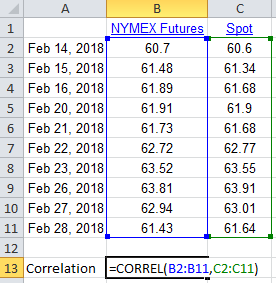
As the following graph shows, we can use the Excel function CORREL() to calculate the correlation between spot and futures for these price data as 0.994, which shows a strong relationship between them.
Note that cross hedging is using futures contracts (for commodity A) in order to hedge the price risk for the commodities (commodity B) that don’t have futures contract market. And cross hedging is possible when the futures price of commodity A are highly correlated with spot prices of commodity B.
Note that we can calculate the correlation of the returns in a similar way to what we did to calculate the volatility (calculating the standard deviation for the returns).