Energy consumption numbers are always reported a few years behind, so we are always looking into the past before we plan for the future. As of 2021, The world's total primary energy consumption was about 176,000 TWhs (580 Quadrillion Btus).
Table 2.1 below shows various regions and total primary energy consumption history.
| Region | 1980 | 1985 | 1990 | 1995 | 2000 | 2005 | 2010 | 2015 |
|---|---|---|---|---|---|---|---|---|
| North America | 91.6 | 91.0 | 100 | 109 | 118 | 121 | 118 | 119.9 |
| Central and S. America | 11.5 | 12.3 | 14.5 | 17.6 | 20.8 | 23.2 | 26.9 | 29.7 |
| Europe | 71.8 | 72.9 | 76.3 | 76.7 | 81.5 | 85.8 | 83.8 | 81.2 |
| Eurasia | 46.7 | 55.7 | 61.0 | 42.2 | 39.2 | 43 | 42.8 | 44.8 |
| Africa | 6.8 | 8.5 | 9.5 | 10.7 | 12.0 | 14.5 | 16.3 | 19.3 |
| Asia & Oceania | 48.9 | 58.1 | 73.4 | 93.5 | 111 | 149 | 194 | 239.9 |
| WORLD TOTAL | 283 | 307 | 346 | 363 | 400 | 459 | 511 | 570.4 |
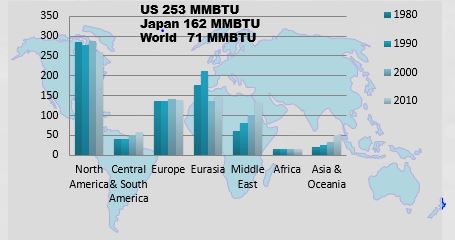
From the Table 2.1, it can be seen that the energy consumption is high for the Far East and Oceania. The amount of energy used depends on the economic prosperity of the nation and the population of the country. The North American region includes Canada, the United States, and Mexico. The Far East and Oceania include developed nations such as Japan and Australia, and densely populated developing nations such as China and India. Obviously, due to highly populated countries like China and India, total energy consumption does not reflect the quality of life of the people in those countries. Figure 2.1 shows the energy per capita consumption over the last 30 years. As can be seen from the graph that Far East and Oceania used a lot of energy as a region, but per capita energy consumption is relatively low implying that if each person in that region would consume as much as in North America, that Region's energy consumption would skyrocket.
The productivity of a country is measured by the total value (dollars) of goods and services, called Gross Domestic Product (GDP), produced by its people. Therefore, the average value of goods and services produced by each person - the GDP per capita of a country - is an indicator of the quality of life.
Energy intensity is the relationship between energy consumption and growth in gross domestic product (GDP), and it is an important factor that affects changes in energy consumption over time.
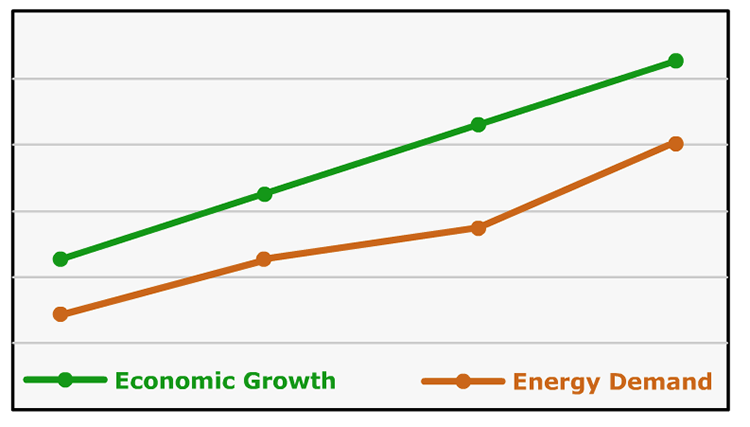
- In industrialized countries, history shows the link between energy consumption and economic growth to be a relatively weak one, with growth in energy demand lagging behind economic growth.
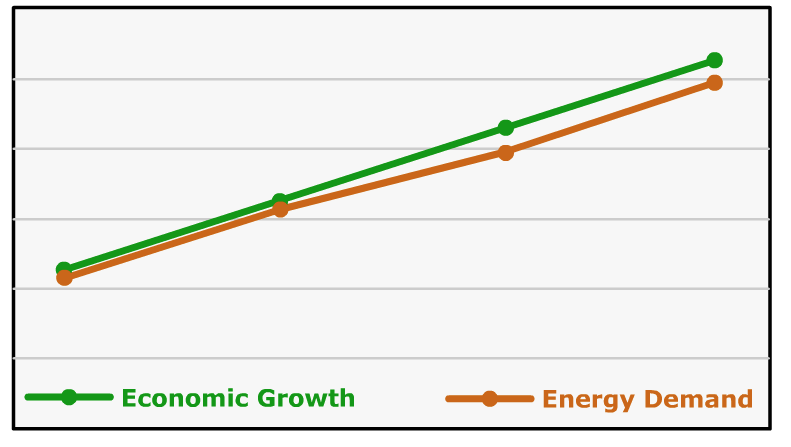
- In developing countries, however, the link between energy consumption and economic growth have been more closely correlated with energy demand growing in parallel with economic expansion.
The total primary energy consumption of the world in 2015 was 570 Quadrillion Btus and in 2017 it increased to 582.4
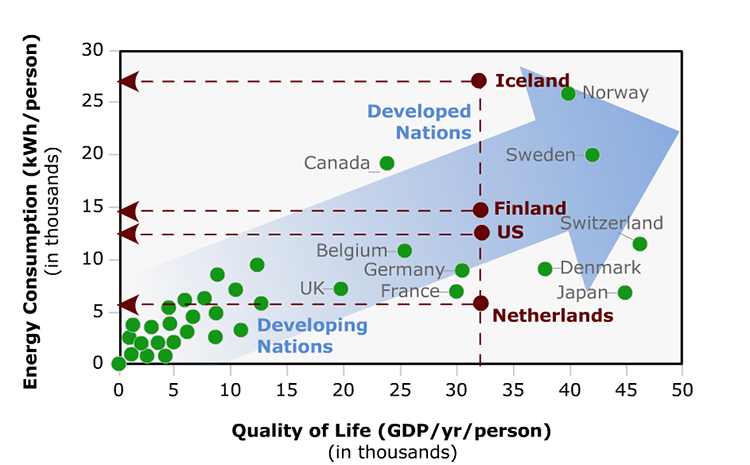
Global Energy Consumption and GDP per person
In general, as the GDP (Gross Domestic Product) per person of any country increases, the amount of energy that is consumed is also expected to increase.
- For developing nations, the correlation is much stronger.
- For developed nations, the correlation is weak.
For example, Iceland, Finland, the United States, and the Netherlands, with similar GDP per capita, have significant differences in energy consumption per capita. In other words, to produce one dollar's worth of goods and services, the U.S. uses twice the energy of the Netherlands. Similarly, Iceland uses four times the energy of the Netherlands.
Energy Consumption Differences
The differences in energy consumption among countries are the result of:
- efficiency of industrial, transportation, commercial, and residential energy,
- climatic and geographical areas of a country,
- lifestyles (use of more gas guzzling cars and SUVs and bigger sized houses), and
- the nature of the products produced by the nation's industries.