From System Requirements to New Designs
Prototyping
In this lesson, you will develop specific interfaces of your GISdesign. You could make the analogy that this is much like cooking - in the needs assessment and concept selection phases you're figuring out what ingredients you need to create the final result, and in the prototyping phase you're developing recipes with those ingredients.
Depending on the goals of your GISystem, you may need to prototype multiple components. For example, let's say you have in mind a new GISystem that will help a local health department monitor and react to disease reports. On one hand, there's a need now for interface designs for end users of the system (maybe a private interface for internal use that has more features than another interface that could be shared with the general public). On the other hand, there's a database and server architecture that must be designed. Prototypes can be created for both cases, though it's necessary to be a bit more conceptual when sketching out the back-end stuff as opposed to the front-end items.
There are two key methods for prototyping - paper prototyping and digital prototyping. The former method is easy enough that you can definitely do it on your own with little or no external support. The latter method usually requires access to prototyping tools and can involve a more substantial learning curve.
Paper Prototypes
An easy way to begin concretizing your design ideas is to start with pens and paper. Sketching out interface and system design ideas on paper is a very common and surprisingly effective method of prototyping. It requires little investment in terms of time or technology resources and the results can be easily shared with others to elicit feedback.
Paper prototypes can be constructed using note cards, post-its, and other easily movable items on top of a cardboard or other writable surface. I recommend taking advantage of movable bits and pieces as much as possible as this allows you to re-arrange your design very easily based on feedback from end-users or your design and implementation colleagues. In the example shown below, you can see that post-its and note cards are used to mock up where different features will be located.

You'll read a lot more about paper prototyping in this week's reading assignment, so we'll save some of the details on paper prototyping for that activity.
Digital Prototypes
Prototyping your designs in the digital realm allows for a great deal of flexibility in terms of the level of detail you include (i.e., the prototype's similarity to the final product, which in our case will always be a digital GIS of some sort). Digital prototypes range from static mockups to semi-interactive concepts to "light" versions of real applications that are implemented using the destination technology platform. Digital prototyping can require various types of software to complete - ranging from graphic design programs to programming languages. Therefore, there is usually a substantial learning curve associated with digital prototyping, and the ability to quickly generate multiple alternatives depends on how much time you can commit to the task and how much detail you wish to include in your designs.
Static digital prototypes are relatively easy to develop so long as you have access to graphic design tools (even MS Paint will work, although a vector illustration tool like Adobe Illustrator or CorelDRAW is a lot more powerful). Much like paper prototyping, the goal of static digital prototyping is to develop design concepts for eliciting user feedback. The figure below shows a static digital design I created for a project several years ago that was focused on developing geographic visualization tools that could handle diverse space-time datasets. In this example, the mockup includes annotations to describe how the tools could work together to solve a particular problem.

- The Analyst wants to search a "chunk" of their scenario, in this case it's a path trajectory over space and time of a vehicle
- Keywords search - Google
- Keywords are automatically selected to span the relevant geography and temporal frame to lead a basic web search. This could be extended to support a palette of common search resources, across disparate datasets (storable presets are possible - to support different types of analysis - i.e. background checks, weather info, new items, signal analysis archives, etc...)
- The Analyst grabs a chunk and drags it over to the storyboard space. The storyboard supports quick arrangement of chunks that are linked to the concept map.
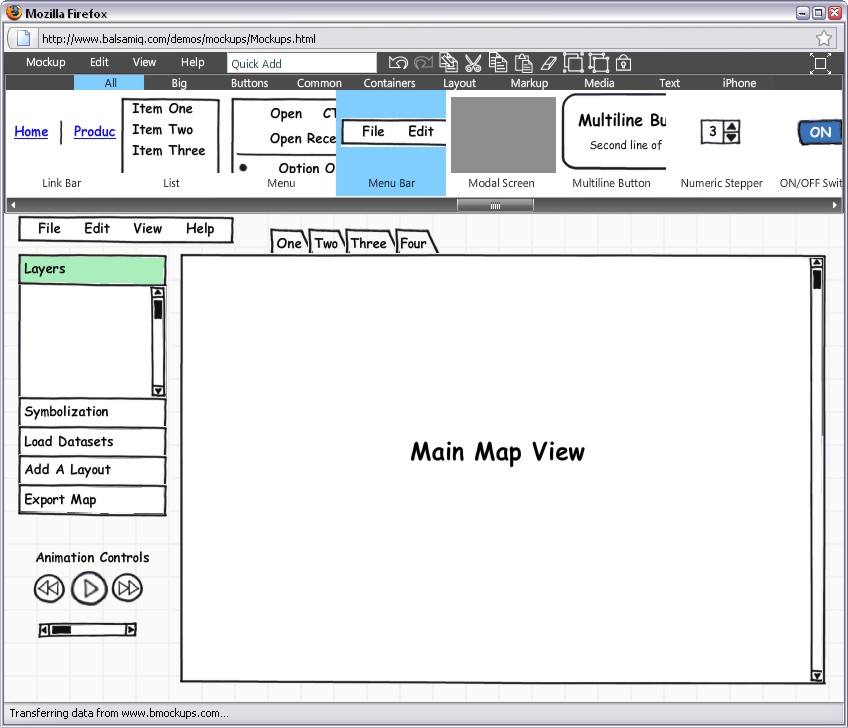
A really interesting hybrid approach is available now with dedicated digital prototyping tools like Balsamiq. Balsamiq is a simple web tool that lets you very quickly mockup a design by dragging and dropping common interface elements onto a layout. It does a nice job blending together the informal and flexible elements from paper prototyping with the flexibility of designing using digital tools. The example I created below for an animated map interface was made in about 5 minutes.