
Before we assess the climate data documenting changes in the climate system, we ought to address the question — is there evidence that greenhouse gases, purportedly responsible for observed warming, are actually changing in the first place?
Thanks to two legendary atmospheric scientists, we know that there is such evidence. The first of these scientists was Roger Revelle.
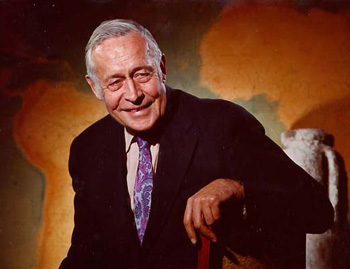
Revelle, as we will later see, made fundamental contributions to understanding climate change throughout his career. Less known, but equally important, was the tutelage and mentorship that Revelle provided to other climate researchers. While at the Scripps Institution for Oceanography at the University of California in San Diego, Revelle encouraged his colleague Charles David Keeling to make direct measurements of atmospheric CO2 levels from an appropriately selected site.
Think About It!
Why do you suppose it is adequate to make measurements of atmospheric CO2 from a single location as an indication of changing global concentrations?
Click for answer.
Revelle and Keeling settled on the top of the mountain peak Mauna Loa on the big island of Hawaii, establishing during the International Geophysical Year of 1958 an observatory that would be maintained by Keeling and his crew for the ensuing decades.
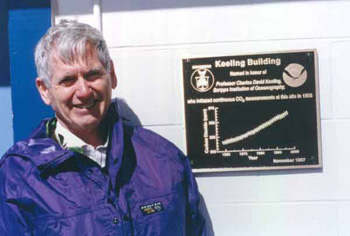
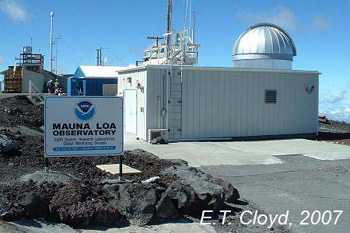
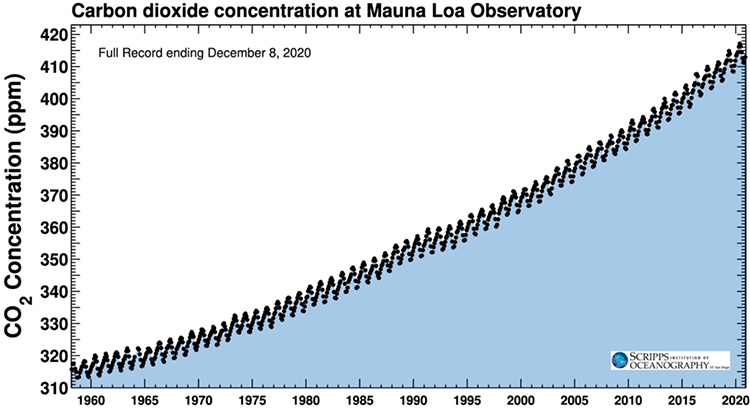
From this location, Keeling and crew would make continuous measurements of atmospheric CO2 from 1958 henceforth. Since then, long-term records have been established in other locations over the globe as well. The result of Keeling's labors is arguably the most famous curve in all of atmospheric science, the so-called Keeling Curve. That curve shows a steady increase in atmospheric CO2 concentrations from about 315 ppm when the measurements began in 1958 to over 400 ppm today (and climbing by about 2 ppm per year presently).
You might be wondering at this point, how do we know that the increase in CO2 is not natural? For one thing, as you already have encountered in your readings, the recent levels are unprecedented over many millennia. Indeed, when we cover the topic of paleoclimate, we will see that the modern levels are likely unprecedented over several million years. We will also see that there is a long-term relationship between CO2 and temperature, though the story is not as simple as you might think.
But there is other more direct evidence that the source of the increasing CO2 is indeed human, i.e., anthropogenic. It turns out that carbon that gets buried in the earth from dying organic matter and eventually turns into fossil fuels tends to be isotopically light. That is, nature has a preference for burying carbon that is depleted of the heavier, 13C, carbon isotope. Fossil fuels are thus relatively rich in the lighter isotope, 12C. However, natural atmospheric CO2 produced by respiration (be it animals like us, or plants which both respire and photosynthesize) tends to have a greater abundance of the heavier 13C isotope of carbon. If the CO2 increase were from natural sources, we would therefore expect the ratio of 13C to 12C to be getting higher. But instead, the ratio of 13C to 12C is getting lower as CO2 is building up in our atmosphere -- i.e., the ratio bears the fingerprint of anthropogenic fossil fuel burning.
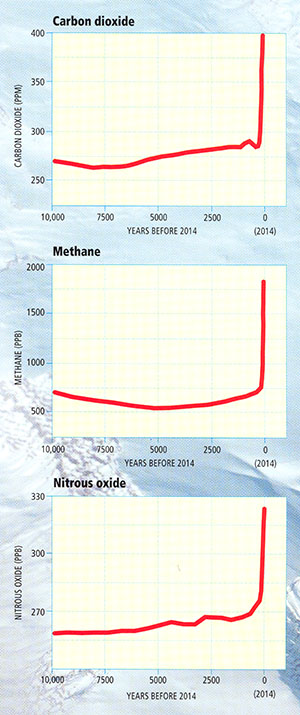
Of course, CO2 is not the only greenhouse gas whose concentrations are rising due to human activity. A combination of agriculture (e.g., rice cultivation), livestock raising, and dam construction led to substantial increases in methane (CH4) concentrations. Agricultural practices have also increased the concentration of nitrous oxide (N2O).
Using air bubbles in ice cores, we can examine small bits of atmosphere trapped in ice, as it accumulated back in time, to reconstruct the composition of the ancient atmosphere, including the past concentrations of greenhouse gases. The ice core evidence shows that the rise over the past two centuries in the concentrations of the greenhouse gases mentioned above is unprecedented for at least the past 10,000 years. Longer-term evidence suggests that concentrations are higher now than they have been for hundreds of thousands of years, and perhaps several million years.
© 2015 Pearson Education, Inc.
We are continuously monitoring these climate indicators. This website shows the latest values as well as their change since the year 1000.