Module 11: Terrestrial Ecosystems in Peril
Module 11: Terrestrial Ecosystems in Peril
Video: Earth 103 Endangered Species Module (1:05)
TIM BRALOWER: Good morning. Today, we're at Shaver's Creek Environmental Center, Pennsylvania, and I'm here to talk about endangered species. When we think about endangered species, we don't normally think about birds. But this bald eagle just behind me was recently removed from the endangered list. When we think about birds, the major problem today are domestic and feral cats. In the U.S. each year, alone, between two and three billion birds are killed by domestic and feral cats. So, obviously, this is a massive problem when we translate these numbers globally. In this module, we're going to learn about a number of different endangered species, including polar bears, birds, frogs, honeybees, and other groups that are in danger today. We're going to learn that if we continue business as usual, CO2 emissions, the problem of endangered species will expand rapidly in the future. Thank you very much.
Introduction
Imagine this. Martians come back to Earth 10 million years from now to study the apparent disappearance of what is described as a once thriving planet. They find textbooks with diagrams of the geological timescale and its divisions into eras, separated by the main mass extinctions. Then they take cores and sample bones in sediment deposits. What they find is the final mass extinction that took place 9.8 million years before their arrival, and 200,000 years before that, the beginning of a new era, the Anthropocene.
Now, the Martian part of this tale is fiction, but sadly the Anthropocene part is not. We have already entered that era, and paleontologists and ecologists combined believe that the sixth-largest mass extinction event in Earth’s 4.6 billion year history has already begun. Rates of species loss are as high as any other time in the last 65 million years, since the time the dinosaurs went extinct. And without a revolution in our stewardship of the planet we call home, these rates are bound to accelerate in the future.
Terrestrial ecosystems are in peril. Let's make it clear, climate change is not the sole culprit here. Humans have messed with ecosystems in numerous other ways. In this module, we will see how this has happened and what is at stake in the future. We will begin by presenting how extinction happens from a theoretical view. Then, we will present one threatened representative from many of the major phyla to observe the impact of human activities on them and attempt to predict their future fate. Finally, we will observe a few “winners” of the loss of global species diversity.
Goals and Learning Outcomes
Goals and Learning Outcomes
Goals
On completing this module, students are expected to be able to:
- describe the record of extinction in deep geologic time;
- explain factors that place species at risk of extinction;
- describe how climate change and other factors have put species from a variety of different groups at risk for extinction;
- evaluate the factors used to place species on the critically endangered category and recommend conservation strategies to save them.
Learning Outcomes
After completing this module, students should be able to answer the following questions:
- What caused three of the five mass extinction events in Earth history?
- What is the rationale for naming the current time the Anthropocene?
- What is the cause of range shift?
- What is the significance of “adapt, move, or die”?
- What are the reasons islands, mountains, and high latitudes are vulnerable to climate change?
- How is extinction risk gauged?
- What are the major categories of the Red List of Threatened Species?
- How are biodiversity hotspots distributed?
- What are the causes and impacts of colony collapse disorder?
- What are the reasons birds as a group are threatened?
- What are the reasons amphibians as a group are threatened?
- What are the key elements of the ecology of polar bears?
- Why are polar bears threatened?
- How are fire ants winning from climate change?
- What is the impact of invasive species such as cane toads?
Assignments Roadmap
Below is an overview of your assignments for this module. The list is intended to prepare you for the module and help you to plan your time.
| Action | Assignment | Location |
|---|---|---|
| To Do |
|
|
Extinction Over Earth's History
Extinction Over Earth's History
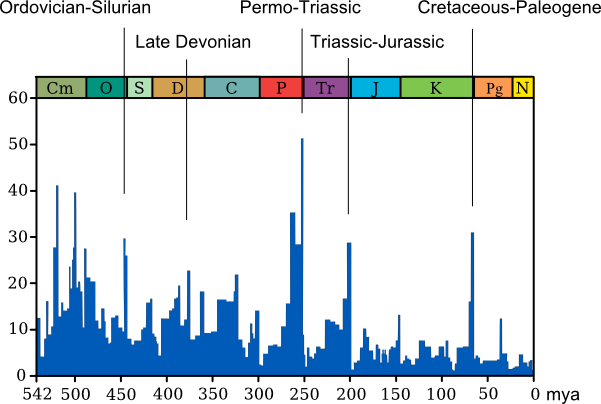
Species are amazingly resilient to environmental change. We know this from the groundbreaking paleontological compilation of the global diversity of genera by David Raup and Jack Sepkoski from the University of Chicago (illustrated below). The compilation, based on a tabulation of all of the occurrences of fossil genera in the paleontological literature, shows millions upon millions of years with relatively low extinction rates punctuated by five intervals with extremely high rates. These five intervals represent major mass extinctions that had a profound impact on the history of life.
The graph shows sea level rise in millimeters on the y-axis (0 to 220 mm) from 1880 to 2016 on the x-axis. It features three data sets: a black line representing observed GMSLR, a blue line for tide gauge data, and a red line for satellite altimeter data. The observed GMSLR (black) starts near 0 mm in 1880, rises steadily, and reaches around 200 mm by 2016. The tide gauge data (blue) aligns closely with the black line from 1880 to the 1990s, while the satellite data (red) begins around 1993 and also tracks closely with the observed GMSLR, confirming the upward trend.
- Graph Overview
- Title: Global mean sea level rise (GMSLR)
- Type: Line graph
- Time Period: 1880 to 2016
- Axes
- Y-axis: Sea level rise (0 to 220 mm)
- X-axis: Year (1880 to 2016)
- Data Sets
- Observed GMSLR
- Color: Black line
- Trend: Rises from 0 mm to ~200 mm
- Tide Gauge Data
- Color: Blue line
- Period: 1880 to ~1990s
- Trend: Matches observed GMSLR
- Satellite Altimeter Data
- Color: Red line
- Period: 1993 to 2016
- Trend: Matches observed GMSLR
- Observed GMSLR
- Trend
- Description: Steady increase in sea level over the period
The three youngest mass extinction events were caused by extraordinary perturbations to the environment, associated in two cases (the Permian-Triassic and Triassic-Jurassic) by gigantic volcanic eruptions, and in the Cretaceous-Paleogene by the impact of a 10km wide asteroid with the Earth. The exact cause of death (referred to as the killing mechanism) of species during these events is still hotly debated, however.
In the case of the Permian-Triassic event, by far the most severe mass extinction in Earth history, when up to 96% of marine and 70% of terrestrial species were eradicated, it is possible that many species were asphyxiated or poisoned by low oxygen and excessive amounts of hydrogen sulfide and CO2. For the Triassic-Jurassic event, ocean acidification is the purported cause. And in the case of the Cretaceous-Paleogene boundary, a combination of repercussions of the impact, weeks to months of darkness, global wildfires, ocean acidification, and metal poisoning, were likely responsible. The survivors of these events were either uniquely adapted to the environmental perturbations or lived in a refuge and escaped the extremity of the geologic conflagration. For example, the dinoflagellates, the same organisms that are responsible for modern red tides (Module 7), survived the Cretaceous-Paleogene event by resorting to their resting stage, while the calcareous plankton, including the coccolithophores and planktonic foraminifera (see Module 1) were nearly rendered extinct. The deep-sea benthic foraminifera also went through the Cretaceous-Paleogene relatively unscathed, as their habitat was not perturbed to nearly the same extent as the surface ocean and land.
Now, the species that went extinct during these mass extinction events were hit with environmental perturbations so severe that they could not adapt to them. By comparison, species have been able to adapt much better to more typical climate changes that have occurred during the majority of Earth history, and this explains the more modest background extinction in the compilation. Faced with environmental change, a species has three choices, in the words of biologist G. R. Coope from the University of London: adapt, move or die. The key part of any species’ survival is that it has developed tolerance to a range of environmental conditions, and if conditions change slowly enough, most species have the ability to adapt. If it cannot adapt, it can certainly move. If it cannot move any further, as we will see later in the module, it will become extinct.
In the paleontological record, species have gone extinct as a result of climate change because their populations have become so isolated that they cannot maintain a population size to remain viable. Frequently, it is likely that climate has caused the change of some other type of environmental variable that has led to the extinction. And in almost all cases, competition with other species for resources has ultimately caused the species’ demise.
Even though there are millions of extinct species to study in the paleontological record, and paleontologists have devoted a great deal of attention to unraveling the causes of their demise, we still cannot determine the exact reason for the extinction for the vast majority of them. Solving this puzzle requires constraining the environment at the time of the extinction, while proxies on which we rely for environmental information generally cannot give us sufficient detail on the range of parameters we require. More seriously, the geological record generally only provides us with time resolution at the millennial scale, while the fatal environmental changes likely occurred over decades and centuries.
As we will see in the remainder of this module, ecologists are making incredible progress understanding the causes of the demise of modern species. However, even with its shortcomings, the paleontological record offers important information about adaptation, species resilience, and their extinction risk. Times in the past when the climate warmed very rapidly, such as the Paleocene-Eocene thermal maximum (PETM) (Module 1), are of particular interest.
So, now, let's see how humans are causing the sixth-largest mass extinction.
Causes of Extinction
Causes of Extinction
All species have a range and a niche. The range of a species is the distribution of all populations of individuals belonging to it. The niche of a species is like its job, how it obtains resources and interacts with other species. Climate change is impacting the range and the niche of all modern species. We will provide several examples of range shift, changes in the distribution of species as a result of climate change, and how it can result in species extinction. Prediction of the future niche of a species, literally whether it will keep or lose its job, is much more difficult, as we will see.
As we saw in Module 7, corals have a significant possibility of extinction in coming centuries as a direct result of anthropogenically-related climate change. With the exception of a few deep-sea species, corals are restricted to a limited upper five meters of the ocean. They need to live in this zone to receive sunlight critical for their algal symbionts. This depth range is forecast to become inhospitable to corals, as decreasing saturation levels and increased temperature and consequent bleaching will render calcification more difficult. Corals will have nowhere to go. They cannot move deeper, so if they cannot adapt, they will become extinct. Remember, adapt, move, or die.
There is ample evidence that climate is impacting the abundance and distribution of modern terrestrial ecosystems as well. Terrestrial species have and will continue to become extinct when they reach the limits of their feasible range and are unable to adapt to the new conditions.
There is overwhelming data, for example, that warming is causing a shift in the ranges of species, generally towards higher latitudes (i.e., towards the poles) and higher elevations in mountainous areas, where conditions are cooler. Species can literally be driven off the top of a mountain as they, or their predators, seek a cooler habitat. A good example of this is the Toucan, a large-billed bird that inhabits mountainous areas of Central America and is being forced to relocate to higher elevations to seek out cooler and wetter conditions. The omnivorous Toucan has become a predator of the infant Quetzal, an extremely beautiful bird that lives in its new habitat elevations. The Toucan picks the baby Quetzals out of their nest with its long beak and is causing Quetzal populations to drop.
Birds
In the higher latitudes, species can be forced to the margins of a continent or have their natural habitat or food supply profoundly altered by climate change. Cases in point are the polar bears, discussed in significant detail later in this module, and penguins. Both Adelie and Emperor penguin populations have decreased by more than 50% in Antarctica as a result of melting sea ice and their continual poleward range shift in search of a stable habitat.
Island inhabitants are extremely sensitive to extinction as a result of climate change and other impacts of humans' activity. Island species have a limited gene pool and often have a very specialized niche. Range shift is an extremely effective extinction mechanism; there is literally nowhere to move to. The widely cited case in point are birds that were endemic to islands in the Pacific, from Micronesia to Polynesia and New Zealand. Research shows that the magnitude of bird extinction as a result of human colonization of the Pacific Islands was staggering, about two-thirds of bird species went extinct between the time humans colonized the island and the first European settlers arrived. As we saw in Module 10, islands are extremely susceptible to sea level rise and loss of habitat is also a potential extinction mechanism in the future. In the past, snakes have become extinct at high rates on Mediterranean islands as sea level rose in the last 18,000 years.
With the exception of high latitudes, mountainous regions and islands, range shift is not generally an extinction mechanism on its own. More threatening to the livelihood of a species is when its niche changes due to competition, or when other human-induced agents become involved. One of the most serious impacts on species' ability to thrive is invasive species and other introduced agents such as pathogens. Later in this module, we will see that pathogens may be responsible for the demise of the Golden Toad and the decline of the honey bees.
Cane Toads
There is almost nothing as disturbing to an ecosystem as an invasive species. And possibly the best example of the havoc an invasive species can wreak is the Cane Toad. Native to Central and South America, the Cane Toad is a large amphibian species that is a voracious consumer of insects. The toad was introduced to Caribbean Islands, Australia, and elsewhere in the hope that it would help control agricultural pests. The toad was brought to Australia in 1935 to help prevent the destructive cane beetle from consuming the sugar cane crop. This experiment has been a dramatic failure, and today the Cane Toad is possibly the most infamous invasive species in the world and the most hated creature in Australia.
The Cane Toad does eat voraciously. But unfortunately, it has not just fed on the cane beetle. Today it preys upon small rodents, snakes, and marsupials. One species that has become endangered as a direct result of Cane Toad predation is the Northern Quoll. Certain species of lizards and snakes have also declined. However, this is not the end of the story. The Cane Toad population has surged as a result of its ability to reproduce rapidly and the lack of a natural predator. An individual female can produce 8000-25000 eggs at once in gelatinous strings that are up to 20 meters in length. Juvenile toads grow rapidly and readily reach sexual maturity. As a result, the Cane Toad population in Australia has grown from the initial introduction of 100 individuals to over 200 million today. Because the toads are so large they can move rapidly, up to 40 kilometers per year, so they have spread over much of the northern tier of the continent.
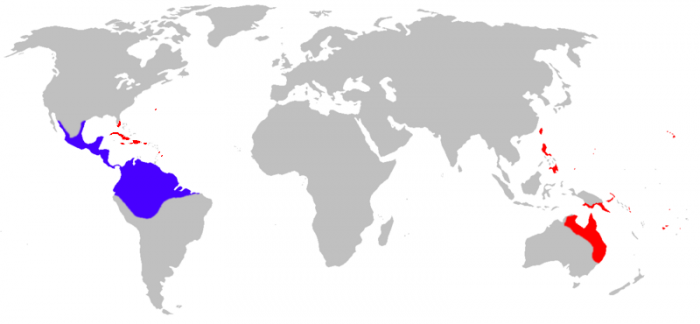
The trait that makes the Cane Toad so potentially threatening, besides its explosive growth, is the poisonous secretions produced by its salivary glands when threatened. Even tadpoles are highly toxic. The toxins are particularly deadly to small animals, but they also threaten populations of crocodiles and turtles. The long-term impact of the Cane Toad is yet to be determined. However, the toad is a serious threat to ecosystems, and methods to control their populations have been unsuccessful. In the process of their remarkable expansion, Cane Toads have become an enemy of the Australian public, who fight them off with cricket bats and golf clubs.
Check Your Understanding
Extinction Risk
Extinction Risk
Ecologists have a great deal of difficulty predicting the future. As we have already described, and as we will see throughout this module, the threats to species today are extremely complex and difficult to quantify. However, because of the importance of predictions in conservation and policy, modeling extinction risk has become a part of the toolkit of ecologists. A wide array of data and methods are applied. However, the key aspect of a model of extinction risk is the population size and the area and the rate with which those parameters are likely to change with projected climate change. Extinction risk models often use climate and environmental projections (temperature drought) from the different emission scenarios (Module 5). Forecasts of extinction often cause great alarm. An infamous case was the 2004 prediction by conservation biologist Chris Thomas of the University of York that up to a million species would become extinct by 2050. The paper in which the models were described has become one of the most scrutinized publications in ecology. The consequent wrangling over technique and interpretation has exposed just how problematic forecasts are.
Without some kind of assessment of risk, however, it is not possible to develop a strategic plan for species conservation backed up by sound environmental policy. The International Union for Conservation of Nature (IUCN) was founded in 1948 with the goal of assessing the magnitude of the extinction threat of modern species and the measures that are being taken towards their conservation. The organization collects the latest ecological data on threatened species and evaluates their status and extinction risk. The IUCN compiles an up-to-date Red List of Threatened Species [10] that summarizes the current status using a set of categories illustrated in the figure below.

The key categories in the Red List system are Critically Endangered, Endangered, and Vulnerable, and each of these categories is defined by very specific information on changes in the abundance and distribution of the species. For example, here are the requirements for a species to be considered Critically Endangered, quoted directly from the official Red List criteria (this information is provided to give you an appreciation of the metrics, you are not required to remember the details!).
A taxon is Critically Endangered when the best available evidence indicates that it meets any of the following criteria (A to E), and it is therefore considered to be facing an extremely high risk of extinction in the wild:
A. Reduction in population size based on any of the following:
1. An observed, estimated, inferred or suspected population size reduction of ≥90% over the last 10 years or three generations, whichever is the longer, where the causes of the reduction are clearly reversible AND understood AND ceased, based on (and specifying) any of the following:
(a) direct observation
(b) an index of abundance appropriate to the taxon
(c) a decline in area of occupancy, the extent of occurrence and/or quality of habitat
(d) actual or potential levels of exploitation
(e) the effects of introduced taxa, hybridization, pathogens, pollutants, competitors or parasites.
2. An observed, estimated, inferred or suspected population size reduction of ≥80% over the last 10 years or three generations, whichever is the longer, where the reduction or its causes may not have ceased OR may not be understood OR may not be reversible, based on (and specifying) any of (a) to (e) under A1.
3. A population size reduction of ≥80%, projected or suspected to be met within the next 10 years or three generations, whichever is the longer (up to a maximum of 100 years), based on (and specifying) any of (b) to (e) under A1.
4. An observed, estimated, inferred, projected, or suspected population size reduction of ≥80% over any 10 year or three generation period, whichever is longer (up to a maximum of 100 years in the future), where the time period must include both the past and the future, and where the reduction or its causes may not have ceased OR may not be understood OR may not be reversible, based on (and specifying) any of (a) to (e) under A1.
B. Geographic range in the form of either B1 (extent of occurrence) OR B2 (area of 1). Extent of occurrence estimated to be less than 100 km2, and estimates indicating at least two of a-c:
- Severely fragmented or known to exist at only a single location.
- Continuing decline, observed, inferred, or projected, in any of the following:
(a) extent of occurrence
(b) area of occupancy
(c) area, extent, and/or quality of habitat
(d) number of locations or subpopulations
(e) number of mature individuals.
3. Extreme fluctuations in any of the following:
(a) extent of occurrence
(b) area of occupancy
(c) number of locations or subpopulations
(d) number of mature individuals.
4. Area of occupancy estimated to be less than 10 km2, and estimate indicating at least two of a-c:
a. Severely fragmented or known to exist at only a single location.
b. Continuing decline, observed, inferred, or projected, in any of the following:
(i) extent of occurrence
(ii) area of occupancy
(iii) area, extent, and/or quality of habitat
(iv) number of locations or subpopulations
(v) number of mature individuals.
c. Extreme fluctuations in any of the following:
(i) extent of occurrence
(ii) area of occupancy
(iii) number of locations or subpopulations
(iv) number of mature individuals.
C. Population size estimated to number fewer than 250 mature individuals and either:
- An estimated continuing decline of at least 25% within three years or one generation, whichever is longer, (up to a maximum of 100 years in the future) OR
- A continuing decline, observed, projected, or inferred, in numbers of mature individuals AND at least one of the following (a-b):
a. Population structure in the form of one of the following:
(i) no subpopulation estimated to contain more than 50 mature individuals,
OR
(ii) at least 90% of mature individuals in one subpopulation.
b. Extreme fluctuations in number of mature individuals.
D. Population size estimated to number fewer than 50 mature individuals.
E. Quantitative analysis showing the probability of extinction in the wild is at least 50% within 10 years or three generations, whichever is the longer (up to a maximum of 100% years).
The differences in the definitions between Critically Endangered, Endangered, and Vulnerable are largely related to the percentages in the above definitions; Endangered percentages are 50% and 70% and Vulnerable involves percentages of 10% and 30%. Species can be moved from one category to another if none of the relevant criteria has been met for a period of five years.
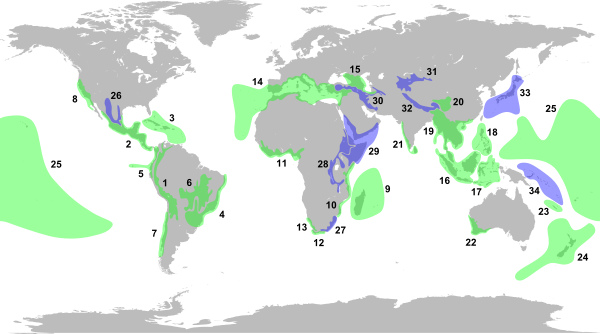
The other means of describing extinction risk is by defining extinction "hot spots" areas, where species are generally more threatened by human activities. A current map of hotspots is shown below. You can see that they are focused in the tropics and subtropics, as well as islands and mountains.
The rest of the module is devoted to telling the stories of species that have become extinct or are in the extinction crosshairs.
Check Your Understanding
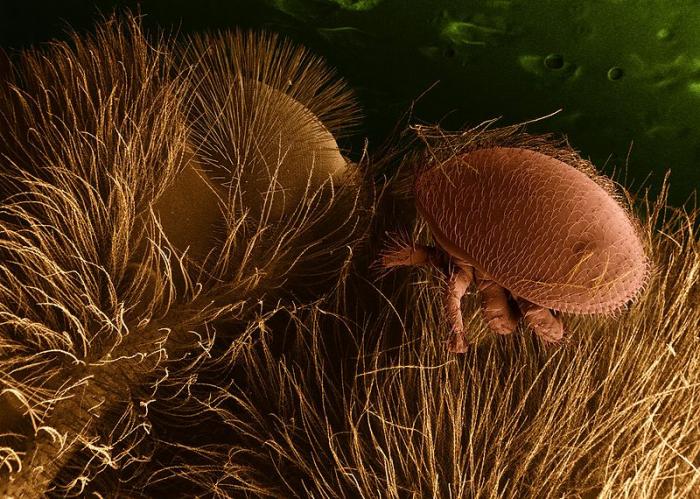
Collapse of the Honey Bees
Collapse of the Honey Bees
Possibly the most threatened insects on the planet are the honey bees, an organism that plays a vital role in agriculture through pollination. The first signs of trouble were noticed in the US in 2006 when beekeepers noticed losses of up to 90% of their hives. Loss of hives is not uncommon over the winter months, but the magnitude of these losses was almost unprecedented. This problem, officially termed colony collapse disorder or CCD, is accelerating in the US and has spread to other Northern Hemisphere countries. When a colony is struck by the collapse disorder, it loses its function. Typically, the queen and immature bees remain, but few other adult bees are left in the hive. There is no honey, and, oddly, no dead bees are found.
Since 2006, annual losses in the number of colonies averaged about 33 percent each year, with a third of that amount resulting from CCD. However, the losses got dramatically worse in 2012. In the last year, 50% or more of all hives have been lost to CCD and the situation is really precarious.
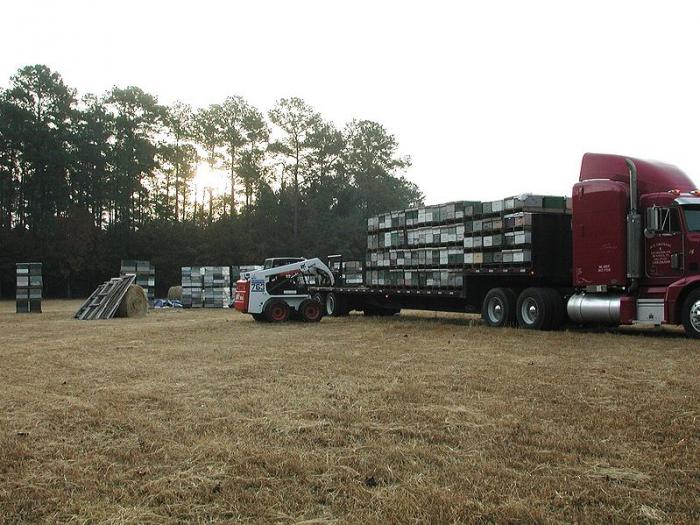
Honey bee pollination is a crucial part of agriculture, responsible for some $15 billion in produce each year with crops including a diverse array of berries, fruits, and vegetables. These crops represent about one of every three bites of food in a typical diet. Honey bees are not the only potential pollinators for most crops, but they are the most prolific and easy to manage in agriculture. The one crop that can’t pollinate without honey bees is almonds. Almonds in the US are grown almost exclusively in California and are a multi-billion a year industry. The almond industry is very hive intensive, with about 800,000 acres devoted to the crop, requiring at least two hives per acre.
Researchers are still completely stumped by the causes of CCD. There are a number of hypotheses that are actively being investigated, but at this time, no one has been isolated as the main culprit. Quite possibly, the causes are synergistic, acting in concert with one another. Here are the candidates:
- Varroa mites, a virus-transmitting parasite of honey bees, have frequently been found in hives hit by CCD. Thus, the mites of the virus have been one of the postulated causes of the disorder. However, there are numerous other possible culprits.
- Pesticides, such as Coumaphos, that are used to treat bees for the Varroa mites, are damaging honey bee brains, interfering with the insect's ability to learn and remember.
- Herbicides and fungicides that are laced with regulators keep bees from maturing.
- Pathogens are common in CCD incidents, and several different pathogens have been identified. However, no one pathogen has been found in a majority of cases. Possibly, the pathogens are carrying viruses and bacteria that are responsible for the disorder.
- The third group of causes is associated with the way the pollination industry handles honey bees. Overcrowding and bee stress are associated with transportation over large distances.
- Scarcity or poor quality of pollen, drought, and contaminated water are possible culprits.
- Cell phone towers may also be a cause. The idea is that electromagnetic fields from the towers cause bees to become disoriented so they stop seeking out food and begin swarming.
However, new evidence is pointing to a type of pesticide called a Neonicotinoids. It is applied in really small doses and often embedded in seeds so that the plant itself kills the insects feeding on it. The problem with these pesticides is that they do not degrade rapidly, as do other varieties, and bees can carry contaminated pollen back to their hives where other bees feast on them for months. These chemicals have now been banned by the European Union.
The number of professional bee pollination services has declined over the course of the 20th century, even before the onset of CCD. The prospects are bleak for the honey bees, but it is unlikely that CCD will cause their extinction. The losses though will definitely threaten the viability of the bee pollination industry and undoubtedly the cost will be passed along to consumers in food prices.
Birds
Birds
Bird populations around the world face a series of profound threats. Climate change and associated modification of the landscape is playing a major role in isolating bird populations and may play a huge role in the future. Development and conversion of agricultural land and forest to urban areas are literally isolating bird populations on "islands", making them vulnerable to extinction. This is increasingly significant, as the largest threat to birds today is not related to climate, but caused by humans and domestic animals.
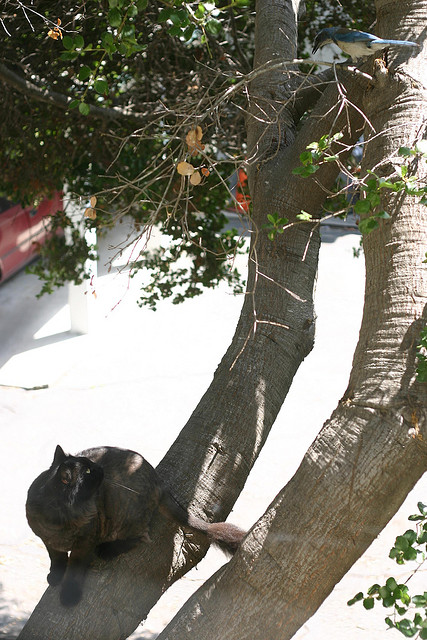
In terms of sheer numbers of casualties, domestic and feral cats pose an enormous threat to bird populations. Introduced by humans either to help keep mice and rat populations at bay or merely for companionship, cats are natural hunters of small mammals and birds. Domestication in cats has not resulted in the same level of changes in behavior and anatomy as it has in dogs, so cats have maintained their ability to hunt and to survive in the wild, and still reproduce readily with feral cat populations. Domestic and feral cats possess strong night vision, a keen sense of smell and an ability to hear high-pitched sounds. Cats’ paws and claws are designed to keep very quiet when stalking prey. Once the prey is caught, the cat typically breaks its neck with its sharp canine teeth and its powerful jaws. In a nutshell, domestic and feral cat populations are lethal hunters.
Cats’ hunting ability and the threat to birds has long been appreciated, but only recently are we gaining an understanding of the magnitude of this threat. Cameras mounted on cats, together with extensive field studies, have provided more accurate estimates of the carnage, and it is staggering. In the US alone, cats kill between 1.4–3.7 billion birds annually, with feral populations accounting for the majority of that number. Each owned cat kills an average of between 4 and 18 birds, and each feral cat between 23 and 46 birds per year. Translate these numbers globally, and the problem is clearly massive.
Although domestic and feral cats represent a major threat to wild bird livelihood, the extinction risk is hard to determine at this point. For one, in the US at least, the list of prey species is extensive with no particular species impacted significantly more than others. However, the largest threat certainly exists on islands where populations are isolated or on the mainland for species that are already endangered.
Besides owning cats and letting them roam outside, humans are responsible for bird mortality in many other ways. An area of responsibility that has received a lot of recent press is wind farms. There have been numerous reports that wind turbines caused a significant number of bird and bat deaths, either from direct impact with blades or indirectly by disruption of their flight paths. However, reports of significant mortality have been contested, and it appears that if wind turbines are sited away from migratory paths and from endangered species, they pose no greater threat than other man-made structures. In fact, because of their sheer number, collisions of birds with buildings, especially windows, pose a much larger overall threat.
Habitat Destruction: The Northern Spotted Owl, the Amazon Rio Branco Antbird, and the Dodo Bird
For a number of reasons, the habitat of birds is under assault. Humans are clearing areas of forest at unprecedented rates for agriculture and urbanization. Urban sprawl is eating up forest and grasslands. Both of these activities are eradicating sensitive bird habitats and threatening populations. Not all habitat change is bad for birds; there are some cases where clearing has been advantageous for bird species. However, more often than not, habitat loss causes a fragmented bird population that can begin the downward spiral towards extinction.
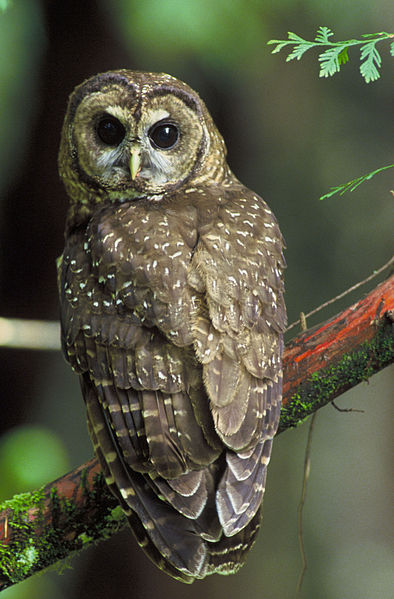
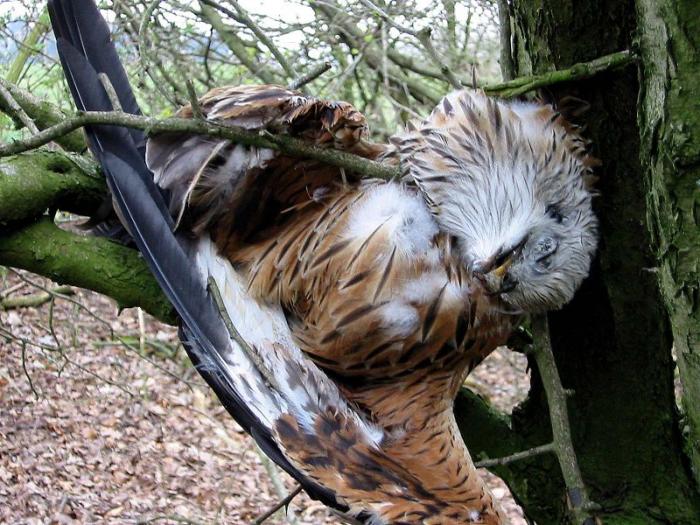
No example epitomizes this problem better than the Northern Spotted Owl of the Pacific Northwest of the US. This beautiful species has been thrust into the battle between the logging industry and developers that seeks to remove the lush cedar, fir, hemlock, and spruce forests in which it nests and forages, and conservationists who are desperately trying to protect it. The billion-dollar logging industry has removed about 90% of the original “old-growth” forest, and the number of spotted owls has dwindled to approximately 2,000, most of them inhabiting federally-owned lands. After years of politically charged debate, the spotted owl was designated as an endangered species in 1990 and lumber companies were required to leave 40% of the old growth forests within 2 km of all spotted owl nests.
The spotted owl controversy is an interesting ethical debate. Should saving an endangered species prohibit the livelihood of citizens? It has been estimated that protection of the owl has cost billions of dollars in losses to the logging industry and over 25,000 jobs. On the other hand, it has been estimated that continued logging at the rate before the regulations were imposed would have removed all forest in about thirty years and forced all the mills to close anyway. The debate will certainly continue. Meanwhile, even with protection, the Northern Spotted Owl remains in rapid decline, especially in the northern part of its range. In British Columbia, there are only 20 breeding pairs left, and the species is predicted to be locally extinct in a few years.
Probably the most serious habitat loss for birds, as for many other groups, is in the Amazon. A third of all birds reside in the largest tropical rainforest in the world. Deforestation of the Amazon (as we observed in Module 10) has removed twenty percent of the original rainforest, and the rate is truly staggering, a football field area worth every minute! In the next 20 years, estimates are for a further twenty percent of the forest to be removed to create land for cattle grazing and growth of crops. Much of the clearing has been done by large commercial agribusinesses.
Besides removing nesting sites, clearing has destroyed food sources and made the remaining forest more susceptible to drought. Bulldozers and chainsaws used to clear land have caused noise pollution, fires have caused air pollution, and roads have disrupted habitats. The impact on birds and other creatures has been staggering, with 100 species now on the endangered list, ten of them critically endangered, meaning that extinction is likely.
One bird that has just been added to the list is the Rio Branco Antbird, a small bird that, as its name implies, survives on ants. This species is losing its battle with agribusinesses consuming its forest habitat in Northern Brazil and southern Guyana at a rapid clip. Based on current rates of deforestation, the bird will become extinct within twenty years if measures are not taken to preserve its habitat.
However, the risk of deforestation is not just for native birds. The area is a major winter feeding place for birds that breed in temperate latitudes in North America and South America. The impact of habitat loss on these species is hard to determine, however.
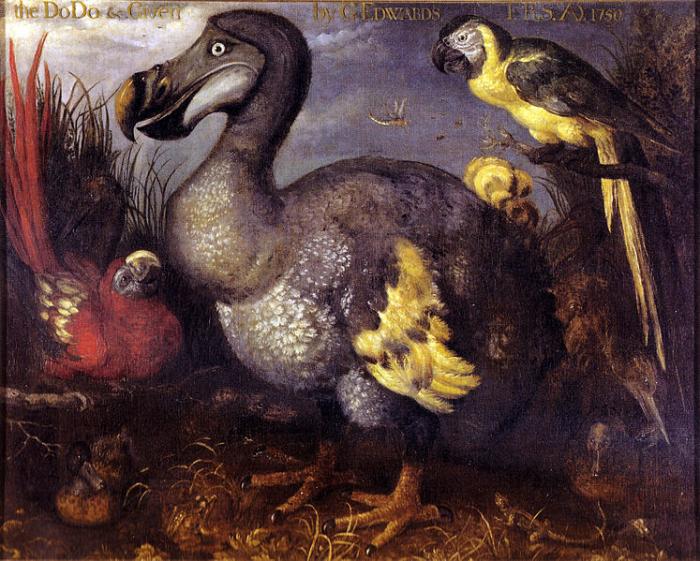
Islands represent some of the most delicate ecosystems to human destruction because migration is difficult and sometimes impossible. In fact, humans’ arrival on islands in the Pacific including Hawaii and Fiji 4000 years ago led to the extinction of about 169 species of large birds through habitat destruction and hunting. In New Zealand, one in four bird species has been wiped out since humans populated the island. The main victims are flightless birds such as the giant moa that can’t escape predators readily, as well as birds that nest on the ground or lay few eggs.
The grey colored Dodo Bird was approximately 3 feet tall, had a long hooked bill, yellow legs, and a tuft of curly feathers high on its tail (all known from drawings). It lived in New Zealand, Mauritius, and Micronesia, and was thriving when humans arrived in the 17th century, along with a brood of domestic animals. The Dodo was not accustomed to these newcomers and, because it was unable to fly, it became a very vulnerable prey. Accounts indicate that pigs, in particular, ate the bird and its eggs, and that humans cut down its forest habitat. The Dodo was completely extinct within decades of humans arrival.
Summary
Current global estimates are for ten bird species each year to go extinct unless humans make major modifications in behavior and put more resources towards conservation of at-risk species.
Amphibians
Amphibians
Introduction
For the last 250 million years of their 350 million years evolutionary record, amphibians have been vulnerable to a number of natural threats. The group evolved in the Devonian and were one of the main predators on land for the first 100 million years of their range. However, after that point, the amphibians gave rise to the more versatile reptiles that rapidly diversified and became dominant. Since that time, amphibians, including frogs, toads, and salamanders, have occupied a very specialized niche. Today, this niche is becoming increasingly vulnerable to climate change and a litany of other human inflicted problems. Nearly 500 species of amphibians are threatened today.
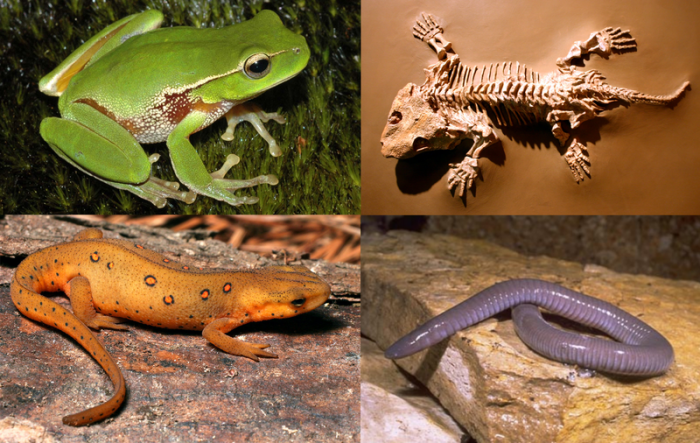
The basis of an amphibians’ existence is the need to reproduce in water or in a moist substrate. The group lays gelatinous, unshelled eggs that readily desiccate. When the amphibians evolved from the fish, this strategy gave them the ability to search for new sources of food, namely plants on land. Thus, even though amphibians could forage away from the water, they had to return to it to reproduce. Later on, some amphibian species developed the ability to lay their eggs in moist substrates such as leaf litter. Because of their need to be near moisture for reproduction, a key amphibian habitat is rainforests and cloud forests in the tropics. These regions are thought to host the highest amphibian diversity on the planet, with the Americas hosting half of the global diversity.
Today, the amphibians are as threatened as any other group, and the numbers of potential species extinctions are at the center of global diversity loss. The causes of diversity loss and extinction are complicated and likely to be synergistic (a term that means acting in concert with one another). However, one of the key threats is periodic drought in temperate, and especially tropical, areas related to climate change.
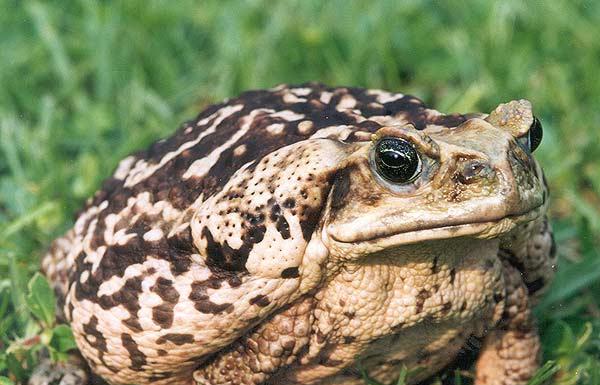
The Case of the Golden Toad
As we have seen in Module 4, periodic drought is an integral part of climate change, even in the lush rainforests of the world. One of the most diverse amphibian habitats known is in the Monteverde Cloud Forest in Costa Rica. This is an area that, until recently, had a high amphibian species diversity, including species that are endemic to the region. This diversity has encouraged a great deal of ecological investigation. Periodic drought in Monteverde related to the ENSO cycle, and reduction in the area of moist clouds to higher elevations, has put pressure on the amphibian habitat. These dry conditions limit the reproduction of amphibians in bodies of water or leaf litter, and thus species are forced to shift their habitats to moister higher elevations. In many cases, these higher habitats are already occupied by other species. Drought may have caused dehydration, alternatively, it may have made frogs susceptible to a pathogen. Monteverde has lost 40% of its frog and toad species since 1987, including the famous Golden Toad. The Golden Toad, which was endemic to Monteverde is one of the surest identified victims of extinction. In 1987, 1500 individuals were observed in breeding pools, however, the spring was dry and few tadpoles developed. The following year, only one Golden Toad was observed in the same location, and the last sighting occurred in 1989. The species is now officially extinct. Drought appears to be the trigger of the Golden Toad extinction, but it did not cause it. The chytrid fungus, which is thought to thrive in drought, causes a fatal skin disease that eventually causes convulsions, skin loss, and death.
Golden Toad
Check Your Understanding
Human Impact on Amphibians
Human Impact on Amphibians
General Impact of Humans on Amphibians
Climate change is not the only stressor on amphibian populations. Amphibians are more susceptible to pollution than other groups because their skin is permeable. For this reason, toxins are able to invade critical amphibian organs. Experimental and field studies suggest that amphibians are highly susceptible to common insecticides, pesticides, and herbicides such as Roundup. Chemicals cause a number of developmental problems including external deformities such as the formation of extra arms and legs, and the tendency of frogs to become hermaphroditic (the same individual bearing male and female reproductive organs), as well as damage to the central nervous system. Finally, increasing UV-B radiation is thought to cause genetic damage in amphibians. Many of the environmental changes and pollution don’t themselves cause the amphibians to become extinct, a related pathogen, fungus, or disease provides the final blow, similar to the Golden Toad. For example, drought may weaken the amphibian population, but a drought-related pathogen may be the ultimate cause of the frog extinction. For pesticides, the developmental or neurological problem does not appear to kill the amphibians, but it weakens them to a fungus that can cause a disease outbreak.
Human impact on amphibians
So, all of this points to a very perilous picture for the amphibians. This inconspicuous group is at ground zero of the Anthropocene mass extinction. With extinction rates over 200 times the global average and potential threatened species loss of over 25,000 times that average, coinciding with a general lack of stewardship needed to fully understand the root causes of their extinction, the amphibians will likely be the major casualty of climate and other anthropogenic activities. However, the story doesn’t stop there. And their loss may also have a direct impact on a lot of other species. Amphibians are an important part of the diet of a number of species of reptiles, birds, and mammals, as well as the main predator for a number of groups of insects; thus their extinction will have profound impacts on a broad part of the food chain. That is why many ecologists believe that the amphibians are the “canary in the coal mine” for the impact of human activities on global diversity.
Polar Bears
Polar Bears
Polar bears, perhaps the fiercest predator on Earth, are rapidly becoming one of the most vulnerable victims of climate change. The significant threat to populations is a direct loss of changing habitats and reduction in prey. Polar bears hunt ringed and other species of seals through the sea ice and cover large areas during their winter hunting season. In summer, when the ice cover recedes, bears fast. Bears catch their seal prey through breathing holes, waiting often for hours or days for the seal to emerge and quickly biting it on the head, pulling it out of the hole and crushing its skull. Bears hunt on what is known as annual ice (i.e., ice that forms in winter and melts in summer) rather than permanent ice because it is thinner and more easily punctured by seals. They feast on the seal fat and blubber because it is easy to digest and a good source of energy. Bears are generally opportunistic hunters, meaning they eat most types of readily available food. Rarely, they feast on beluga whales and walruses. While on land, bears will hunt reindeer, birds, and rodents; they will also eat vegetation and garbage when hungry.
Polar bears spend the autumn and winter on moving ice floes and ice pack following seal populations. They can find themselves several hundred of miles away from land. A typical bear can have a range of up to 350,000 square kilometers! They are adapted to extremely cold temperatures, with two separate layers of fur and a thick 4-inch layer of blubber underneath. Their clear outer layer of fur provides them with an excellent camouflage for hunting. A male bear can weigh over 750 kilograms.
In the spring and summer time, polar bears retreat to land or permanent ice and fast on the energy reserves they have generated during the winter. It is during this time of year that females reproduce, with a gestation period of eight months. During the winter, the female bear builds a den for delivery of up to four cubs the following spring. She also spends much of this time in hibernation. Bears have to consume very large amounts of food to maintain their lifestyle and also to make it through the long winter. Females, in particular, must maintain a high body mass to reproduce. On average, a bear must catch a seal every week or so during the summer to thrive. Females often refrain from mating if they do not have substantial food sources or the necessary fat reserves. And even if they do reproduce, cub survival rates may be reduced.
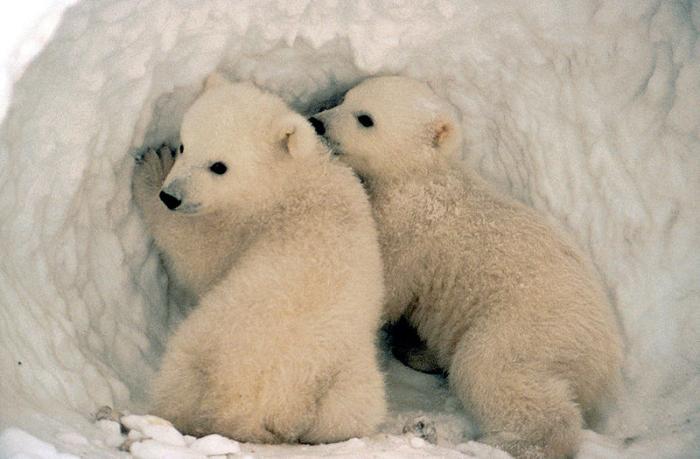
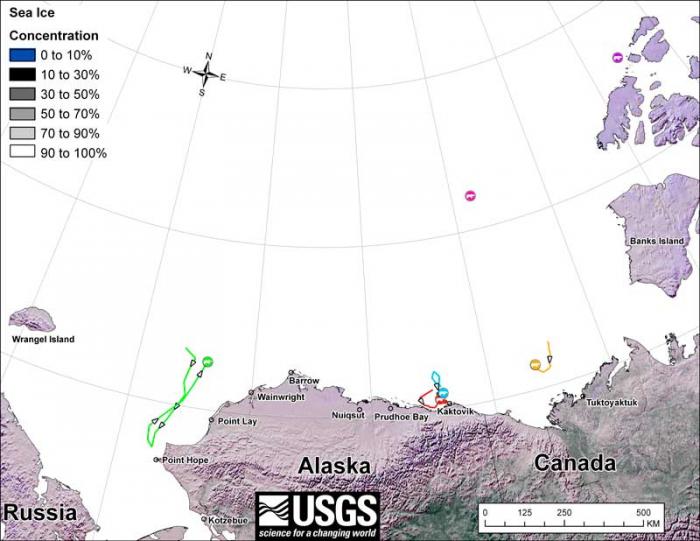
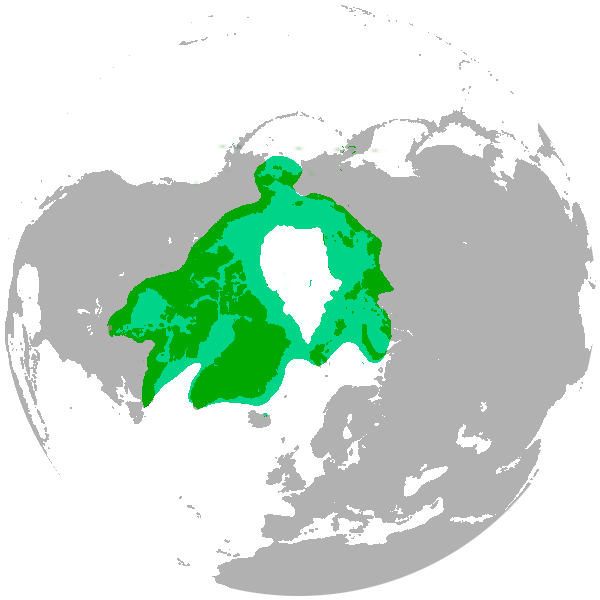
Polar bears live in groups called populations in the US, Canada, Russia, Norway, and Greenland and are rapidly becoming a victim of disappearing sea ice. As sea ice thins, bears may actually have an advantage hunting, as seals can be detected more readily through the thin cover. Some years in the late 1970s were banner years for polar bears for this reason. However, as the recession of sea ice has accelerated in the last few decades, polar bears have been forced to retreat to land earlier in the season to avoid being stranded on ice floes. A female bear needs to weigh above 200 kg to sustain herself during hibernation and pregnancy, and her cubs after birth. With insufficient body mass and energy reserves, females cease to reproduce. Data show that the average weight of female polar bears has been decreasing steadily towards this 200 kg threshold, A female reproduces every two to three years and only five times in her lifetime. Thus, when females delay reproduction for one or more years, bear populations can decline rapidly. Thus, the polar bear population is extremely vulnerable to climate change.
Polar bears have increasingly encroached on settlements surrounding their habitat in search of human garbage. This has led humans to kill dangerous bears. Moreover, climate change has also caused grizzly bears to migrate and put them in competition with polar bears for resources.
The outlook for polar bears is bleak. Today the total population is between 20,000 and 25,000, but seven of the 19 bear populations are known to be in decline and predictions are for numbers to decline by 7000 to 8500 in the next 30 years. The shrinking sea ice habitat will threaten bear populations near the south of their range, and only the northern populations will likely hang on well into the future. Various counties and agencies have listed the polar bear as threatened and endangered.

The graph shows the contribution of ocean thermal expansion to sea level rise in millimeters on the y-axis (0 to 120 mm) from 1955 to 2015 on the x-axis. The graph features a blue line representing the thermal expansion contribution, starting near 0 mm in 1955 and steadily increasing to around 100 mm by 2015. Shaded gray areas around the line indicate uncertainty ranges. The trend shows a consistent rise, reflecting the impact of ocean warming on sea level rise over the 60-year period.
- Graph Overview
- Title: Thermal Expansion Contribution to Sea Level Rise
- Type: Line graph
- Time Period: 1955 to 2015
- Axes
- Y-axis: Sea level rise contribution (0 to 120 mm)
- X-axis: Year (1955 to 2015)
- Data
- Thermal Expansion Contribution
- Color: Blue line
- Trend: Increases from 0 mm to ~100 mm
- Uncertainty
- Visual: Shaded gray areas around the blue line
- Thermal Expansion Contribution
- Trend
- Description: Consistent rise due to ocean warming
Check Your Understanding
Climate Change Winners
Climate Change Winners
Some insects are thriving as a result of climate change and human activity. One of them is the fire ant, or Solenopsis Invicta, which is a relative of the bees. This species arrived on US soil in 1968 via a container ship from South America. Today, the fire ant occupies much of the south-central to the southeastern US, from Texas all the way to southeast Virginia and southern California. The fire ant behaves like a bee, with some colonies having one queen and others hundreds of queens. A colony has several queens whose role is to reproduce and then invade new territory. And the queens do that well; they can release 3,500 eggs in one day. Fire ants bite humans and small animals by anchoring themselves to the skin, then injecting their poison from their abdomen. In most cases, people are bitten by many ants at the same time.
In most cases, the stings are merely painful, and some swelling disappears rapidly; however, some people turn out to be very sensitive to fire ant bites, developing secondary infections and neurologic complications. There have been about 60 deaths in the US since the ants arrived. Fire ants create large mounds, cause physical damage to the soil, and hinder cultivation. They spread very rapidly, and several colonies have been found to have invaded a yard overnight.
Fire ants do not live where the soil is impacted by a hard freeze, and that is where climate change comes in. As winters become less harsh, and freezing becomes less widespread, the ants have their eyes set on Washington DC and further north.
Module Summary and Final Tasks
Module Summary and Final Tasks
End of Module Recap:
In this module, you should have learned the following concepts:
- In response to climate change, species can adapt, move, or die.
- Range shift and population size are key variables in predicting extinction.
- Mountains, high latitudes, and islands are very sensitive to range shift.
- Often, other anthropogenic impacts act in concert with climate change to cause species to become threatened or extinct (you should know what some of these impacts are).
Assignments
You should have read the contents of this module carefully, completed and submitted any labs, the Yellowdig Entry and Reply and taken the Module Quiz. If you have not done so already, please do so before moving on to the next module. Incomplete assignments will negatively impact your final grade.