
Welcome to Earth in the Future!
Our planet is warming!
Our planet is warming. Data shows that the average temperature of Earth has increased by 1.1oC since 1850. In fact, June 2024 was the 13th straight month that Earth was 1.5oC warmer than 1850. The Northern Hemisphere just recorded its 558th month with temperatures above the 20th-century average. July 2023 saw the hottest daily global temperatures since records have been taken. Phoenix Arizona recorded 31 consecutive days over 110 degrees F. Intense heatwaves occurred in North America, southern Europe and Asia with temperature records shattered everywhere. The ocean temperature off the Florida Keys exceeded 100 degrees F, killing scores of sea life, and late 2023 and 2024 ocean temperatures have been so warm, climate scientists are stunned. Summer 2024 promises to be one of very active hurricanes in the Atlantic. The area of sea ice in the Arctic and off Antarctica is at historic lows. Truly devastating wildfires in Hawaii in August 2023 are almost certainly linked to climate change. The warning signs of climate change were also flashing red in Summer 2022. Devastating heatwaves struck Europe in July breaking records all over the continent. Excessive rains hit St. Louis and Kentucky in late July, causing flash flooding that killed over 30. Hurricane Ian, one of the most powerful hurricanes to hit the US, caused catastrophic damage in southwest Florida in late September and early October. Back in summer 2021, Portland Oregon, known as a city with a cool temperate climate hit 116 deg F (47 deg C) in early July and Lytton in British Columbia Canada topped at 121 deg F (49 degrees C) sparking devastating wildfires. Combined, the death toll in the US and Canada from this heat was close to 500. The following week Death Valley reached 130 deg F (54 deg C) and its average for the whole day including nighttime was 118! Two weeks later devastating floods hit northwestern Europe causing nearly 200 fatalities. In fact, the whole Earth is warming at a rate not experienced for many millions of years, if ever before. This warming and a myriad of associated environmental changes will challenge modern society throughout the 21st century. Scientists are striving to improve predictions of how the environment will change, as well as understand the impacts on humans. This course, Earth in the Future: Predicting Climate Change and Its Impacts Over the Next Century is designed to provide the state of the art of climate science, the impacts on humans and natural ecosystems, as well as ways that humans can mitigate and adapt to climate change.
The 2021 Intergovernmental Panel on Climate Change (IPCC) report
Speaking of science and scientists, the 2021 report by the Intergovernmental Panel on Climate Change (IPCC) a large group of the top climate scientists in the world flashed red warning lights about the threats of climate change and the need for immediate action.
The world has already warmed by 1.1 degrees C since preindustrial (1850) levels and it is almost inevitable that we will cross the 1.5 degrees C of warming which is the level at which most climate scientists agree the types of impacts we are seeing now will become more common and markedly worse. The big question is how fast we will reach this milestone.
The 2021 report stresses that we need to make deep cuts in carbon emissions to delay the time we reach that point. Carbon from the burning of fossil fuels remains in the atmosphere for many years and on current rates of input we will blow past 1.5 degrees C and approach much more dangerous levels of warming, 3 and 4 degrees C, where the consequences will be truly devastating, our climate will look unrecognizable, and large parts of Earth will become uninhabitable. What is notable is that this is the first IPCC report that states unequivocally that humans are to blame for the warming we are experiencing.
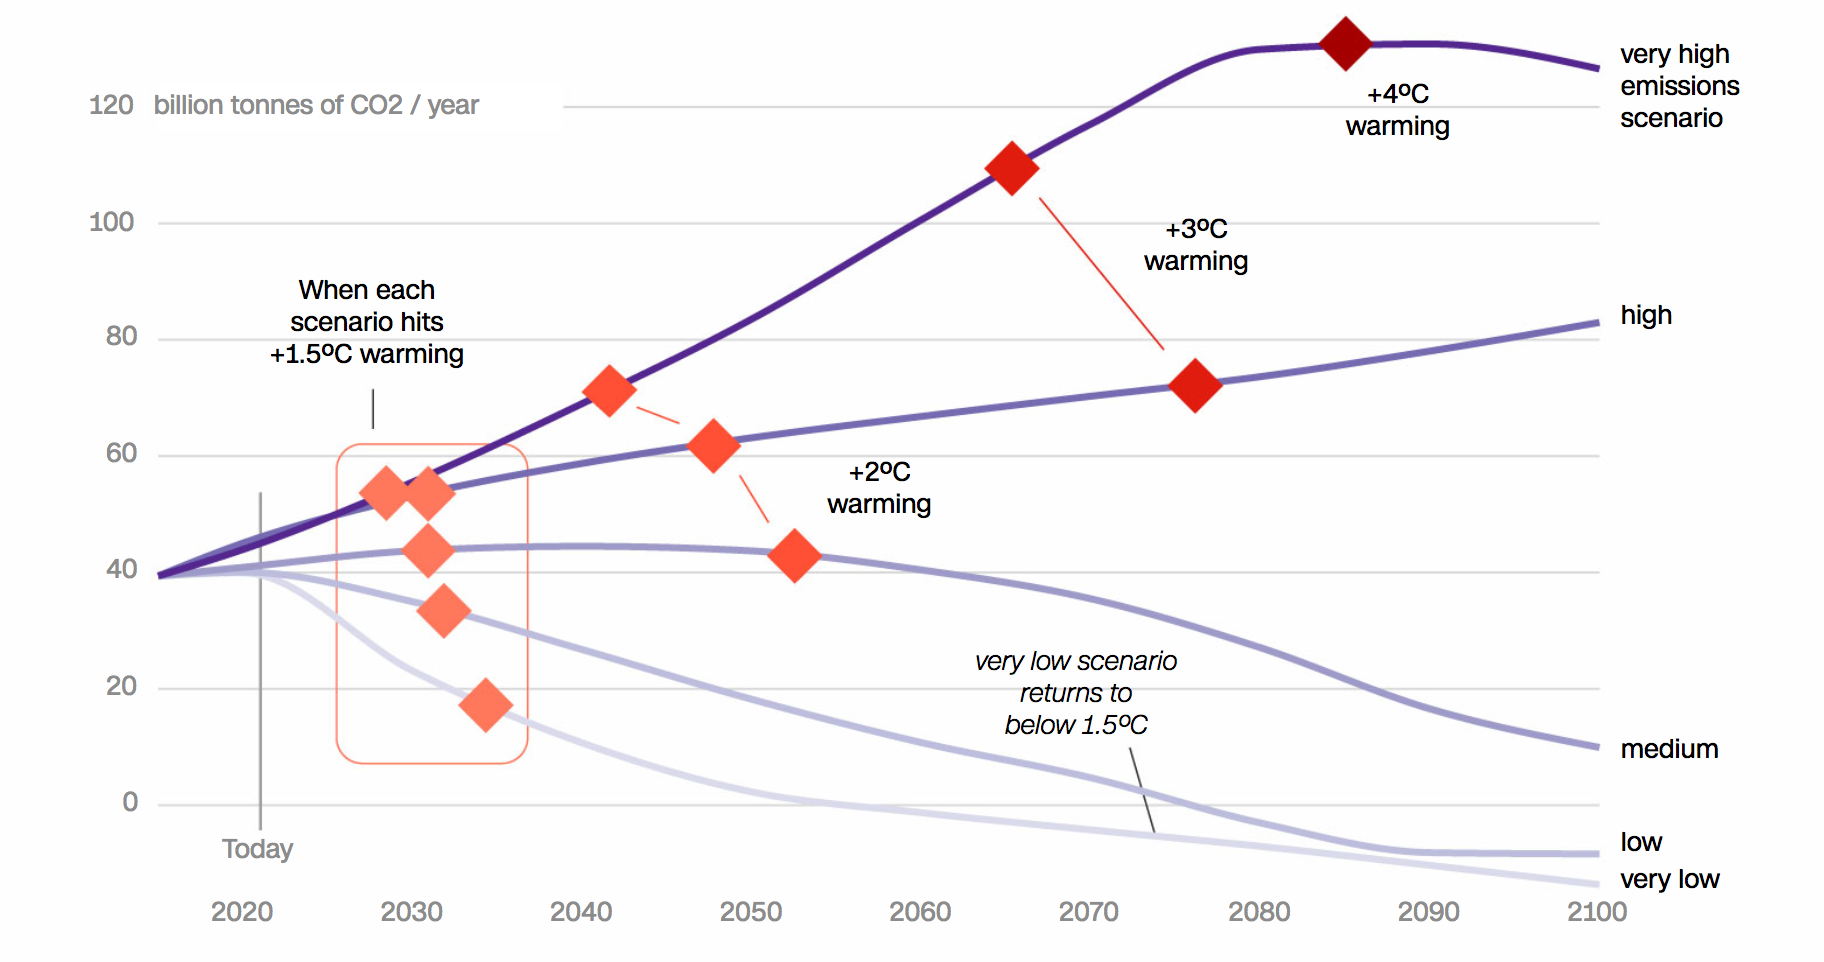
If you look at the graph above, you will see several purple lines which represent warming trends based on different projections of the amount of carbon we in the future. The darker curves are the ones where we emit more carbon, including the curve labeled “high” which is close to the rate we are emitting right now. You also see orange and red diamonds, orange for the point at which we reach 1.5 degrees C of warming, progressively darker red for 2.0 degrees C, and the dangerous 3.0 and 4.0 degree C levels. It is clear from this graph that the darker the purple line, the sooner we reach the dangerous thresholds. Moreover, what is also important is that only the lighter purple, medium, low and very low emission curves will not take us to the dangerous warming levels. So we need to make cuts now.
The changes will definitely have to be drastic. Carbon emissions due to the burning of fossil fuels such as oil, natural gas and coal are surging increased by 2 billion metric tons (or tonnes) or 6% in 2021, the largest amount in history. So we need to make major changes in how we derive our energy to make these cuts. Fortunately an agreement to do that is in place, the Paris Climate Agreement signed in 2015 by some 195 countries, this agreement is designed for countries to reduce their emissions with the goal of curbing warming to the 2 degree C level and at a best case scenario to 1.5 degrees C.
The 2021 IPCC report made some other key conclusions:
- Climate Extremes including heatwaves, droughts, and floods are becoming more frequent and hurricanes are becoming stronger
- By 2050 the Arctic Ocean could be completely ice fee in summer
- Seas will rise for hundreds or thousands of years no matter how we curb emissions, but the extent will vary dramatically. 1.5 degrees C warming will lead to 2-3 meters (6-10 feet) of sea level rise and 3-4 degrees of warming could cause levels approaching 15 meters by 2300
- Most important the report stressed that we are running out of time. The longer we wait to bring new forms of energy online the more drastic the changes will have to be.
Dramatic changes in CO2 emissions!
Video: GISTEMP Lines Rotate 2024 degF (:30) This video is not narrated.
add description here
Video: Carbon Dioxide Pumphandle (2:42) This video is not narrated.
This silent video shows two graphs showing the increase in atmospheric carbon dioxide from 1979 until January 2021 in a time-lapse. The increase is not steady, but rather a series of ups and downs, with a steep increase toward the end. Note the annual variation in CO2 levels, especially in the Northern Hemisphere. Note the comparison of ice age, pre-industrial, and 2021 CO2.
So the science is clear, the warming we are observing is a direct response to the burning of fossil fuels. The concentration of CO2, the most important greenhouse gas, now stands at 427 parts per million, the highest level in the last 800 thousand years. For context, the level was just 398 ppm when the course opened in 2012! Play the animation above left and watch the movie above right and you'll see the remarkable increase in CO2 over the short and long term. Scientists have not succeeded in making their case to the general population—only about 50% of people in the US believe that warming is a result of human activities. The goal of this course is not to focus on this ongoing debate or to take sides. The goal of this class is to understand the science of climate and consider the implications of climate change on Earth, no matter what its causes. How do we forecast the climate? What will Earth be like in the year 2100? How habitable will the planet be at that time? A key factor, completely separate from climate change, is that projections show the global population increasing from about 7 billion people today possibly up to 14 billion at the end of this century. Like climate, the population is very difficult to forecast, hence the range of estimates is very broad. In fact, habitability is a central part of population projections, with lower estimates factoring in significant increases in mortality as a result of overpopulation as well as decreases in fertility.
How our planet is changing
Let's take a quick look at how the physical nature of the planet has changed over the last fifty or so years. Mountain glaciers have lost over 4000 cubic kilometers of water and the Arctic sea ice has lost 10% of its area. Sea level has risen by 9 cm. That might not sound like a lot, but it sure made a difference to flooding during Hurricane Sandy! The ocean surface temperature has increased by 0.5oC and its pH has decreased (it has become more acidic), making it more hostile for many invertebrate animals that make shells out of calcium carbonate. For example, coral reefs are having a harder and harder time growing under increasingly acidic conditions. Today, the world’s forests are being cleared at a rate of 20 football fields per minute! And the Sahara desert is expanding southward at a rate of 48km per year. Today, by many estimates, more than 50% of the species on the planet are considered threatened. The following time-lapse videos show dramatic changes in our planet from 1984 to today, including urbanization, deforestation, and rapidly receding glaciers.
Time-Lapse Videos
Warning Signs of Climate Change
Here are some of the warning signs of climate change shown in graphic images.
Drought
Flooding
Ocean Acidification
Three images of ocean acidification: one healthy with vibrant colors (375ppm); one with faded colors (450ppm); and one that is brown and colorless
Warming and Sea Level Rise
Deforestation and Desertification
So where are we headed? Will the large ice sheets completely melt in the next 90 years? Will the oceans become so acidic that no animals and plants can live? Will grasslands and other semi-arid regions completely dry up, leading to famine for entire nations? The answer to these questions is almost certainly no. However, it is likely by the year 2100, if not considerably before, that ships will be able to sail from New York to Tokyo through the Northwest Passage (the route between the Atlantic and Pacific Oceans that runs through the Arctic) without icebreakers, that many species of coral will be extinct as a result of acid oceans and other causes, and that we will have witnessed the migration of massive numbers of people as a result of drought, famine, and sea-level rise.
Governments around the world are planning for these major changes. For example, the Pentagon is evaluating the impact of an open Northwest Passage on national security, energy policy, and fisheries. Biologists are evaluating the ability of species of coral to adapt to an ocean with lower pH and warmer temperatures. And nations from the developed and developing world are pursuing technologies that will expand the limits of habitable land.
The goal of this class is to survey the health of the planet today, with a strong emphasis on climate, and to provide an understanding of how scientists forecast this health will change in the future. We will learn that there are significant uncertainties in these forecasts that means that we must develop a playbook of strategies to deal with the possible changes that are to come. At the same time, we will monitor the impact of climate and other environmental changes on ecosystems, all the way from microscopic algae to humans.
Fortunately, Earth has witnessed rapid changes in climate and environment in the past and geologists have considerable expertise in extracting information on the exact nature of this change as well as how it affected life on the planet.
Quick Facts about Earth 103N
Authors
Drs. David M. Bice and Timothy J. Bralower, Professors of Geosciences, College of Earth and Mineral Sciences, The Pennsylvania State University
Instructor
Overview
Earth in the Future is an introduction to Earth's climate system and the challenges we will face in the near future because of these changes. Earth in the Future is required for the Certificate in Earth Sustainability and the Minor in Earth and Sustainability, and an entry-level course for Earth Science and Policy BS degree.
Topics of Study
The content of this course is divided into 12 lessons (modules). Each module will be completed in approximately 1 week.
| Module | Title |
|---|---|
| Module 1 | Past Episodes of Climate Change |
| Module 2 | Recent Climate Change |
| Module 3 | Earth's Climate System |
| Module 4 | Introduction to General Circulation Models |
| Module 5 | Global Carbon Cycle |
| Module 6 | Ocean Circulation and its Impact on Climate |
| Module 7 | Ocean Acidification, Red Tides, and Monster Jellyfish |
| Module 8 | Water Resources and Climate Change |
| Module 9 | Climate Change and Food Supply |
| Module 10 | Future Sea Level Change |
| Module 11 | Terrestrial Ecosystems in Peril |
| Module 12 | Adaption to and Mitigation of Climate Change |
Acknowledgments
Earth Futures is the brainchild of Eric Barron, founding Director of Earth System Science Center, former Dean of the College of Earth and Mineral Sciences at Penn State, and former President of Penn State. We are also deeply grateful to learning designer April Millet in the John A. Dutton Institute of Teaching and Learning Excellence, Earth and Mineral Sciences at Penn State who took the materials and brought them to life. April not only kept us on task, but she also continues to provide sage advice about the way we present science. This online course could not have been possible without her and Khusro Kidwai who gave us initial guidance. Thanks also to Dutton directors Annie Taylor and David DiBiase for encouragement, inspiration, and leadership.
Numerous people have helped point us in the right direction for parts of the course, although they are by no means to be held responsible for the content. They include Donna Green, Katrin Meissner, and Shane MacGregor at the Climate Change Research Centre, University of New South Wales, Kamini Singha at Colorado School of Mines and Erica Smithwick at Penn State, Walter Barnhardt at the USGS, Scott Wing at the Smithsonian, Ellen Currano at Wyoming, and Dennis McGillicuddy at Woods Hole. We thank the staff of the Climate Change Research Centre, University of New South Wales for their hospitality while this course was being developed.
Finally, the course would not have been possible without funding from NASA and the Australian-American Fulbright Commission.