
Module 2: Recent Climate Change
Video: Module 2 Introduction (1:13)
TIM BRALOWER: Hi, everybody. Welcome to module 2 on recent climate. And I'm standing here in Duke Gardens. It's 2019, and if you came to Duke Gardens 12 years ago, 15 years ago, you would never see so much lush subtropical vegetation. And the vegetation has changed here because climate has changed in this region, and that is happening everywhere. And the predictions are for more severe storms, and that has already borne out with Hurricane Katrina, 2005, Hurricane Sandy, 2012, that struck New York, and Hurricane Harvey in 2017 that dumped 56 inches of rain in metro Houston.
So all of the predictions are coming true for climate change, and this is what's being borne out in the recent climate record. I just wanted to mention one other thing. Last year was a devastating fire year in California, and drought and fires are definitely part of the prediction for global climate change in arid regions such as the US Southwest. So I think in this module, you'll learn a lot about the recent climate record and how that projects to the future of what we'll see with continued global climate change. I hope you enjoy the module.
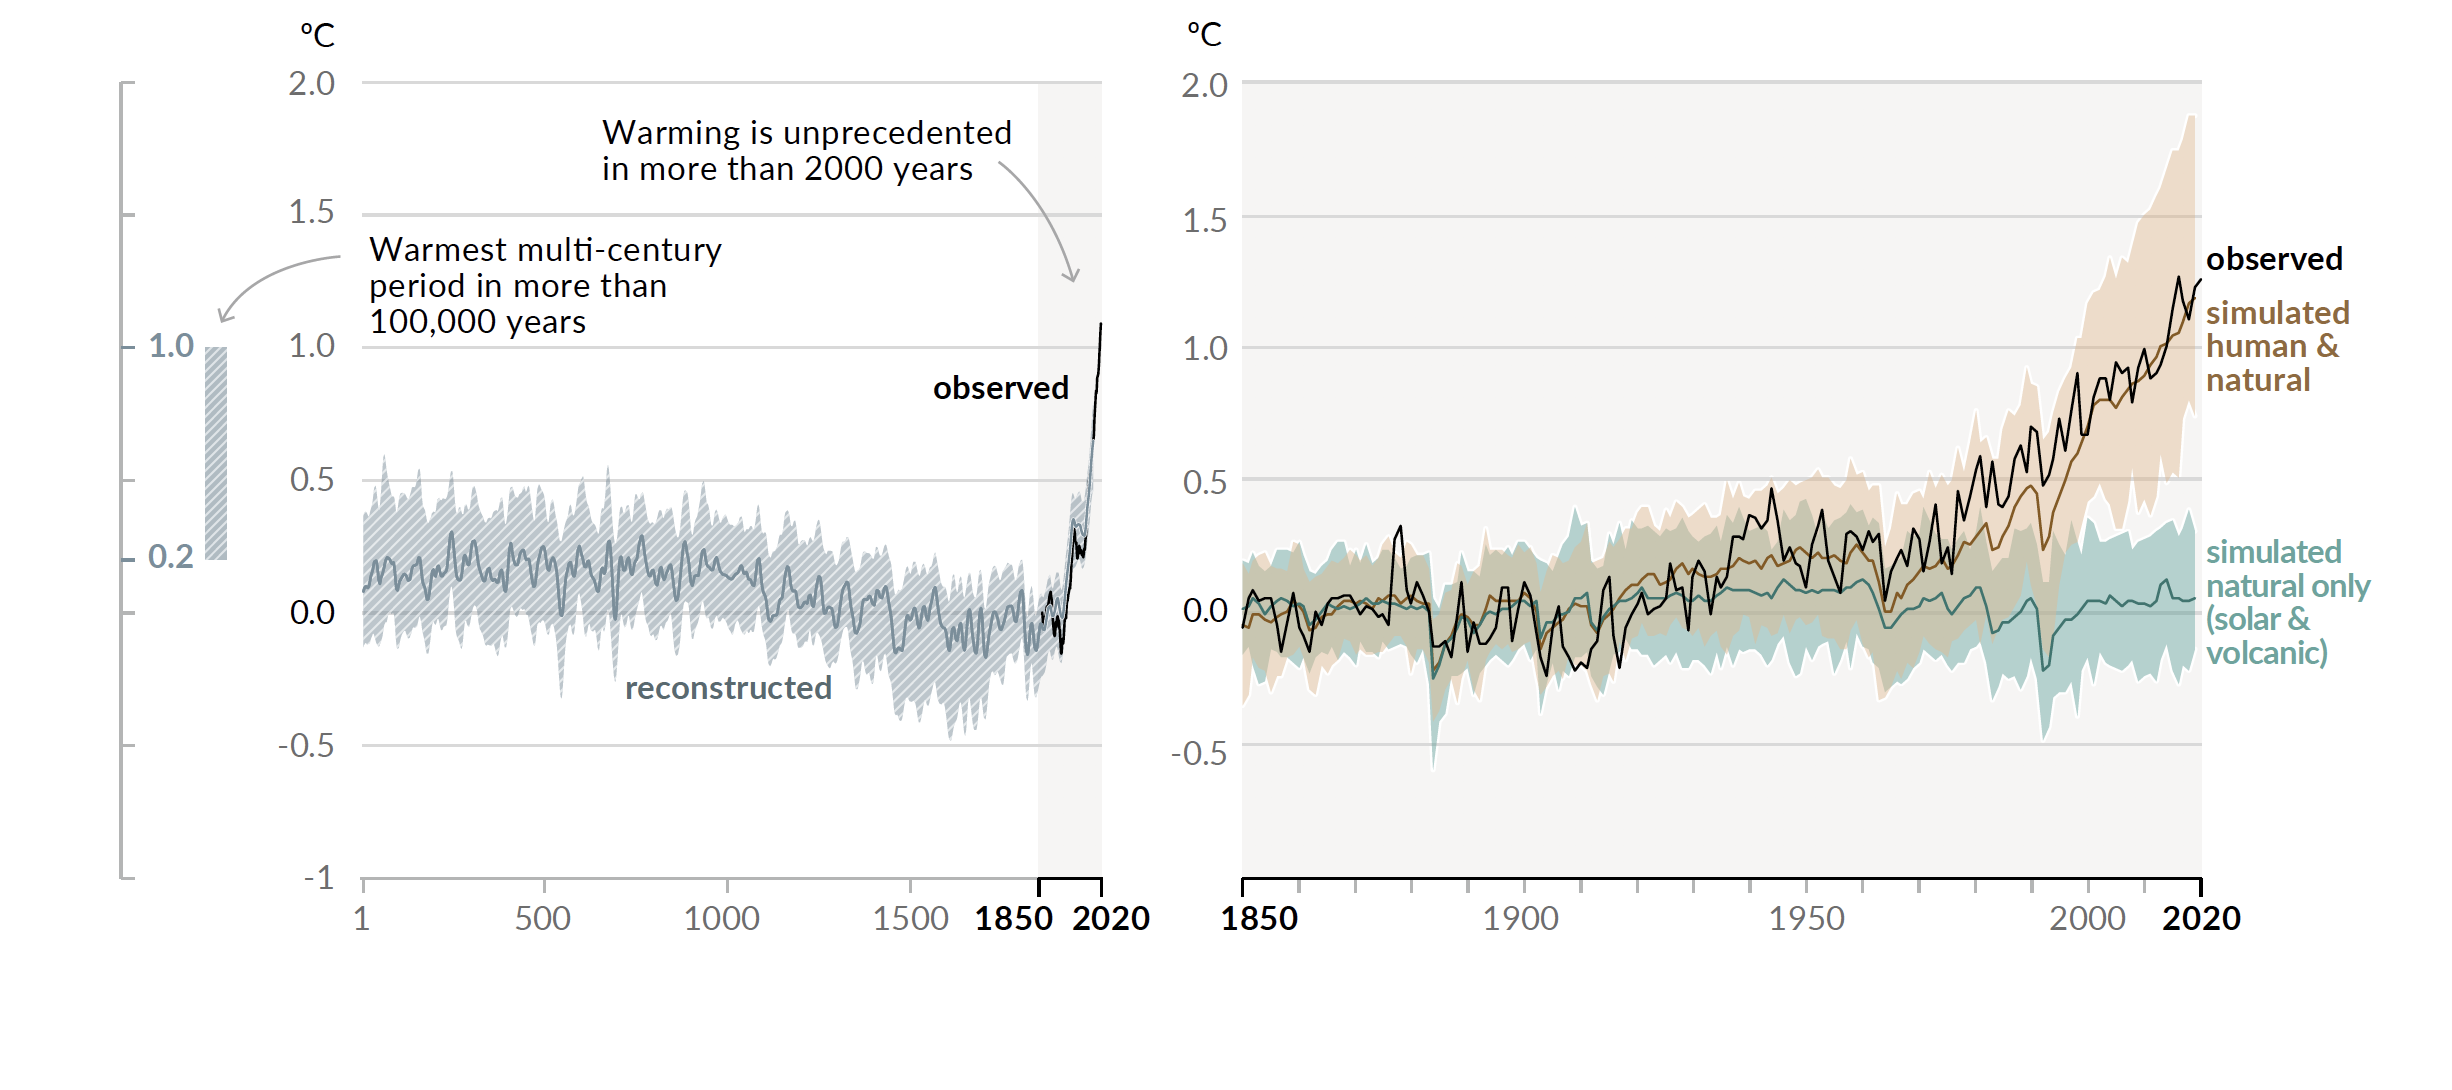
The image consists of two graphs showing global temperature anomalies over time, measured in degrees Celsius (°C), with a focus on historical climate data and the influence of human and natural factors.
- Left Graph (Historical Temperature Reconstruction):
- Time Scale: Spans from the year 1 to 2020.
- Y-Axis: Temperature anomaly in °C, ranging from -1.0 to 2.0°C.
- Data Representation: A shaded area represents the reconstructed temperature anomaly, showing fluctuations over time.
- Key Annotations:
- A label at around 1850-2020 states: "Warming is unprecedented in more than 2,000 years."
- Another label at around 500-1000 states: "Warmest multi-century period in more than 100,000 years."
- The graph shows a relatively stable temperature anomaly (around 0°C) until around 1850, followed by a sharp increase to about 1.0°C by 2020, labeled as "observed."
- Right Graph (Simulated vs. Observed Temperature):
- Time Scale: Spans from 1850 to 2020.
- Y-Axis: Temperature anomaly in °C, ranging from -0.5 to 2.0°C.
- Data Representation:
- Two sets of data are plotted:
- "Simulated human & natural" (black line with a shaded uncertainty range in beige), showing a steep rise in temperature after 1950, reaching around 1.5°C by 2020.
- "Simulated natural only (solar & volcanic)" (black line with a shaded uncertainty range in blue), showing minimal change, fluctuating around 0°C throughout the period.
- The "observed" temperature anomaly (black line) closely follows the "simulated human & natural" trend, reaching around 1.5°C by 2020.
- Two sets of data are plotted:
- Key Observation: The graph highlights that natural factors alone (solar and volcanic) cannot account for the observed warming, which aligns with the combined human and natural simulation.
The overall message of the image is to illustrate the significant role of human activity in driving recent global warming, as the observed temperature increase since 1850 far exceeds what would be expected from natural factors alone.
One of the key findings of paleoclimate research (Module 1) is that the temperatures we are experiencing today have not been observed for about 125,000 years. The left panel in the figure above shows the recent temperature record reconstructed from proxies and observations. What you see is the sharp rate of warming Earth is experiencing today has not been recorded in the past. What is also very clear is that the rate (very fast) and amount (about 1.1 degrees C) of warming we have observed over the last 120 years cannot have been caused by natural processes, for example sunspots and volcanism. Climate models can simulate the temperature records pretty well based on the physics of the atmosphere and the amount of carbon input from various sources including fossil fuels. In the right panel of the figure above, the simulated natural inputs are shown in green, the simulated natural and current fossil fuel inputs are shown in brown, and the observed temperature curve in black (the Hockey Stick we briefly referred to in Module 1). Ranges of simulations are shown in shading. What they show very clearly is that the current rate and amount of warming cannot be caused by natural processes. The only way that this rapid rate and amount can occur in the simulations is to add fossil fuels at the rate we are adding them today. This is one of the central conclusions of the 2022 Intergovernmental Panel on Climate Change (IPCC) report, and we will come back to it in Modules 4 and 5
Earth’s climate is ever-changing and this is one of the main conclusions of Module 1. Before accurate measurements of temperature existed, we have historic records in addition to proxy records. We can observe in them the fall of dynasties as a result of climate change, for example the fall of the Mayans as a result of devastating drought in Central America in 900AD. Now, fast forward just a little, and we have multiple accounts and proxy records of two significant changes in climate that impacted medieval societies— the Medieval Warm Period (AD 950 to 1250) and the Little Ice Age (AD 1450-1850) see figure below. The Medieval Warm Period is famous because of its connection to some interesting events in the European and North Atlantic regions. During this time, it appears that wine production in Great Britain was abundant, even though in today's climate, wine grapes struggle at this high northern latitude. This is also the period of time when the Vikings colonized Greenland (they originally called it "Vinland"), indicating that this region was warmer than it is today. In a recent examination of climate proxy records from around the world, Penn State’s Michael Mann and his colleagues determined that the temperatures in the North Atlantic region were indeed warmer than the 1961 - 1990 period, but globally, the climate was not as warm as today, as can be seen in the below figure.
The Little Ice Age is similarly famous for its connections to European history. During this period, the winters in Europe were cold enough that the canals in the Netherlands froze over, allowing for skaters to travel through the countryside on these frozen pathways — this activity is recorded in some of the masterpieces of Dutch painters such as Bruegel. The Little Ice Age was a time of minor advances in many of the Alpine glaciers, and it also signaled the end of the Greenland colonization experiment. This was generally a difficult period in European history, marked by plagues, famine, fighting, and political turmoil. The cause of the Little Ice Age, like the cause of the Medieval Warm Period, is not entirely settled, but it does coincide with a period of volcanic eruptions, which should cool the climate and a period of decreased solar activity known as the Maunder Minimum. It has also been suggested that a slowdown in the thermohaline circulation in the oceans (see Modules 3 and 6) may have contributed to this cooling.
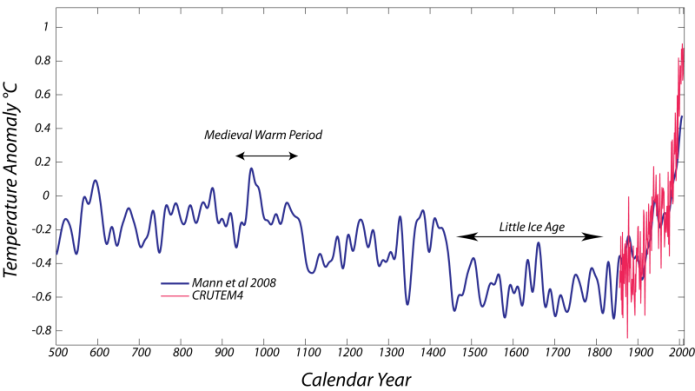
In the Medieval accounts, we can see that proxies and historic information are consistent. But the recent warming in the iconic Hockey Stick most certainly stands out in terms of its magnitude and its abruptness. In this module, we take a look at the wide range of observations that give us a sense of how the climate has been changing over past centuries but especially today. We will see the dire threats from persistent droughts, more devastating fire seasons, stronger hurricanes and melting ice sheets.