
Sea Ice
One of the most striking examples of climate change is related to the Arctic sea ice; the video below shows the drastic changes in the extent of Arctic sea ice over the last 40 years. The ocean is now permanently open to shipping in the summer.
Video: Annual Arctic Sea Ice Minimum Area 1979-2023, With Graph (00:46) (No Narration)
The graph is titled "Annual Arctic Sea Ice Minimum Area" and displays the extent of Arctic sea ice at its annual minimum, measured in millions of square kilometers (km²), over a time period from 1975 to 2025.
- X-Axis (Time): The horizontal axis represents the years, ranging from 1975 to 2025, with major ticks marked at 5-year intervals (1975, 1980, 1985, etc.).
- Y-Axis (Sea Ice Area): The vertical axis represents the Arctic sea ice area in millions of km², ranging from 3 to 7 million km², with major ticks at intervals of 1 million km².
- Data Representation: The data is plotted as a red line with red dots at each yearly data point, showing the annual minimum sea ice area.
- Trend and Observations:
- In 1975, the sea ice area starts at around 7 million km².
- From 1975 to around 1995, the sea ice area fluctuates between approximately 6 and 7 million km², showing some variability but no clear long-term trend.
- Starting around 1995, a noticeable downward trend begins.
- By 2005, the sea ice area drops below 6 million km² and continues to decline with significant year-to-year variability.
- The decline becomes more pronounced after 2010, with several years dipping below 4 million km².
- By 2025, the sea ice area reaches its lowest point on the graph, around 3 million km².
- Overall Trend: The graph shows a clear long-term decline in the annual minimum Arctic sea ice area over the 50-year period, with a more rapid decrease occurring after the mid-1990s.
The graph visually emphasizes the significant reduction in Arctic sea ice over the past five decades, likely reflecting the impacts of global warming and climate change.
This visualization shows the age of the Arctic sea ice between 1979 and 2023. Younger sea ice, or first-year ice, is shown in a dark shade of blue, while the ice that is four years old or older is shown as white. The graph displayed quantifies the area covered sea ice 4 or more years old in millions of square kilometers.
The Arctic sea ice undergoes large fluctuations over the course of a year, and, like all aspects of the climate system, there is a good deal of natural variability. So, while one or two extreme years do not necessarily make a trend, they may be part of a trend. Visit NASA's Earth Observatory to see a nice set of maps looking down on the North Pole showing the sea ice extent over the last 12 years; each map shows the long-term mean ice extent in a yellow line. One thing that becomes apparent is that there is much more variability in the end-of-summer minimum ice extent than the end-of-winter maximum; another thing that is apparent is that the reduction in Arctic sea ice is now a long term trend.
In the figure below, we see a summary of data on the ice extent, reported as an anomaly (departure from the mean), and it now becomes apparent that there has been a more or less steady decline since about 1970.
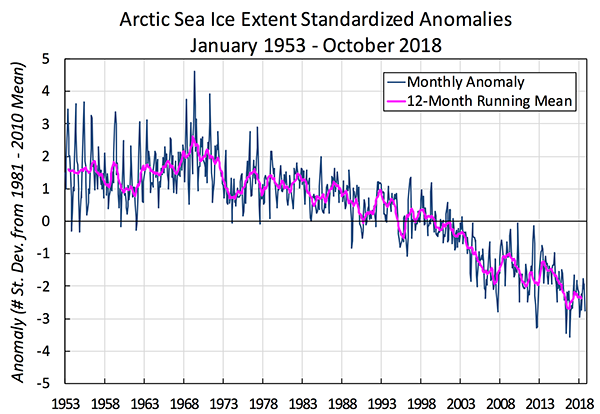
This image is a line graph titled "Arctic Sea Ice Extent Standardized Anomalies, January 1953 – October 2018." The graph shows the deviation of Arctic sea ice extent from the 1981–2010 mean, measured in standard deviations, over the specified period.
- Graph Type: Line graph
- Y-Axis: Anomaly (standard deviations from 1981–2010 mean)
- Range: -5 to 5 standard deviations
- X-Axis: Years (1953 to 2018)
- Data Representation:
- Monthly Anomaly: Blue line
- Shows high variability, fluctuating between -4 and 4 standard deviations
- Peaks around 1955 and 1975, dips significantly after 2000
- 12-Month Running Mean: Pink line
- Smoothed trend of the monthly data
- Starts around 0 in 1953, fluctuates slightly until 1980
- Shows a steady decline after 1980, reaching around -3 by 2018
- Monthly Anomaly: Blue line
- Trend:
- Early years (1953–1980): Fluctuations around the mean (0)
- Post-1980: Consistent decline in sea ice extent
- By 2018: Anomaly reaches approximately -3 standard deviations
The graph illustrates a significant and ongoing decline in Arctic sea ice extent since the 1980s, with the 12-month running mean showing a clear downward trend over the 65-year period.
In addition to the reduced area of coverage, the Arctic ice is also becoming thinner. The thickness of the ice in the Arctic has been monitored for a long time by the US Navy, using submarines. Now, satellites can measure ice thickness. The comparison below shows a 40% to 50% decrease in the thickness of ice from the average over 1958-1976 compared to the present.
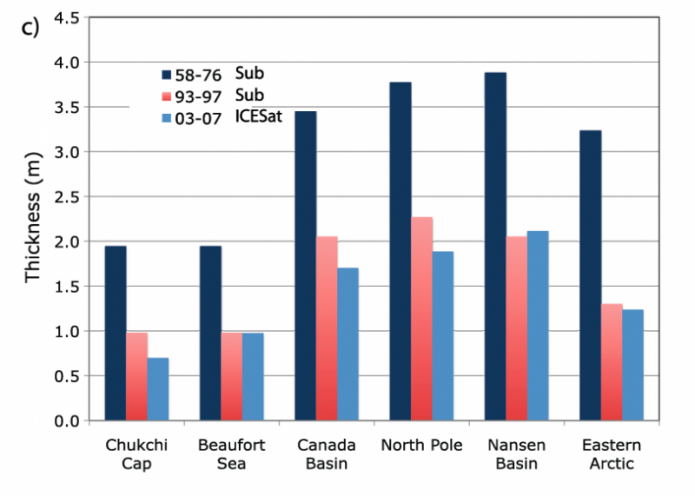
| Thickness at: | 1958-1976 | 1993-1997 | 2003-2007 |
|---|---|---|---|
| Chukchi Cap | 1.9m | 1.0m | 0.7m |
| Beaufort Sea | 1.9m | 1.0m | 1.0m |
| Canada Basin | 3.4m | 2.1m | 1.7m |
| North Pole | 3.7m | 2.3m | 1.8m |
| Nansen Basin | 3.8m | 2.0m | 2.2m |
| Eastern Arctic | 3.3m | 1.3m | 1.2m |
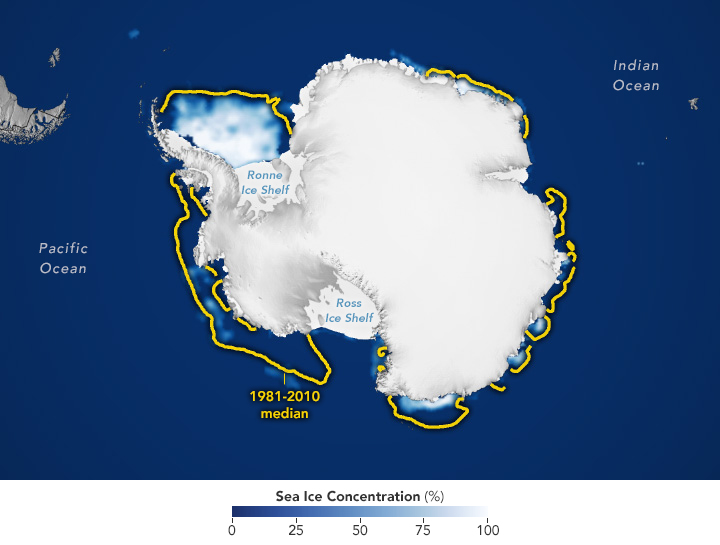
This reduction in the coverage of Arctic sea ice is significant since it means that during the summer months when the sun is at its brightest in the polar region, and there are 24 hours of daylight, the reflective ice cover is being reduced, allowing for the absorption of a much greater quantity of solar energy that can then warm the whole polar region. This change in sea ice coverage is not just an Arctic phenomenon — in the Antarctic, the sea ice is also decreasing in area as the map below illustrates.
Finally, a word on sea level. The melting of ice sheets and mountain glaciers is partially responsible for a significant rise in sea level---20 cm in the last 100 years. However, thermal expansion of seawater as a result of warming is equally, if not more, important. Also, since sea ice is already at ocean level, its melting does not contribute to sea level rise.