Heatwaves
Heat waves are days to week-long events with extremely high temperatures. These events are becoming more common with a changing climate, are forecasted to become frequent in many parts of the world in the future and occur earlier in the year (June 2022 has been a dress rehearsal for that!). Heatwaves are often part of extended droughts and associated with wildfires. They are major public health risks, especially for very young and older populations, as well as the poor who do not have access to air conditioning or basic hydration. In the developing world, heat waves can be very deadly, in India in 2015 more than 2200 people died due to excessive heat.
Some of the most drastic heatwaves occur in Australia, a continent which is also characterized by devastating drought and perilous wildfires. The last few years have seen major heatwaves across the continent, shattering local and continental temperature records. In 2013 Australia got so hot that they had to add new colors to the temperature map. There were days that year when the center of the continent topped 125 degrees F (52 degrees C).
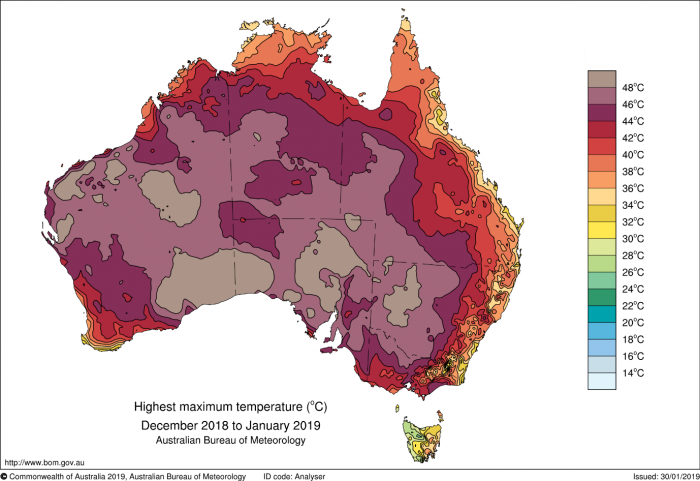
This image is a map of Australia titled "Highest Maximum Temperature (°C) December 2018 to January 2019," produced by the Australian Bureau of Meteorology. The map uses a color gradient to show the highest maximum temperatures recorded across Australia during this period.
- Map Type: Australia map
- Measurement: Highest maximum temperature (°C)
- Period: December 2018 to January 2019
- Color Scale (right side of the map):
- Range: 14°C to 48°C
- Colors: Light blue (14°C) to dark purple (48°C), with green, yellow, orange, and red in between
- Regions with Notable Temperatures:
- Extremely High (dark purple, 46°C to 48°C):
- Central Australia (Northern Territory, parts of South Australia)
- Very High (red to purple, 40°C to 46°C):
- Most of Western Australia, Northern Territory, and South Australia
- Parts of Queensland and New South Wales
- High (orange to red, 34°C to 40°C):
- Eastern Australia (Queensland, New South Wales)
- Parts of Victoria
- Moderate (yellow to green, 26°C to 34°C):
- Coastal areas of Western Australia and Victoria
- Tasmania
- Lower (blue, 14°C to 26°C):
- Small areas in Tasmania and southern Victoria
- Extremely High (dark purple, 46°C to 48°C):
The map shows that central and northern Australia experienced extremely high temperatures, often exceeding 40°C, while coastal and southern regions, including Tasmania, had cooler maximum temperatures during this period.
In 2019 Australia broke records again in a summer of wildfires, drought, and heat. On December 19, the average high for the whole continent was 107.4 degrees F (41.9 degrees C) shattering the record set the day before by over a degree C.
In the US, heatwaves in the desert southwest including Phoenix and Las Vegas are part of a normal summer. Phoenix regularly reaches 112 degrees F (44.4 degrees C) and it has been known to exceed 120 degrees F (48.9 degrees C). These are shade temperatures, corresponding temperatures can reach 168 degrees F (76 degrees C) in the sun right above the ground level. Because concrete traps heat, cities like Phoenix get particularly hot and are prone to heatwaves. In fact, this “heat island” effect makes cities as much as 7 degrees F warmer during the day. Nighttime often does not provide much relief, with temperatures above 80 deg F for many nights in a row.
June 2021 was a sign of things to come in the northwest US and western Canada, with temperatures topping out at 116 degrees F in Portland and 108 degrees F in Seattle. Lytton in British Columbia reached 121 degrees F, the hottest temperature ever recorded in Canada. These temperatures smashed records for these cities that are normally cool in the early summer.
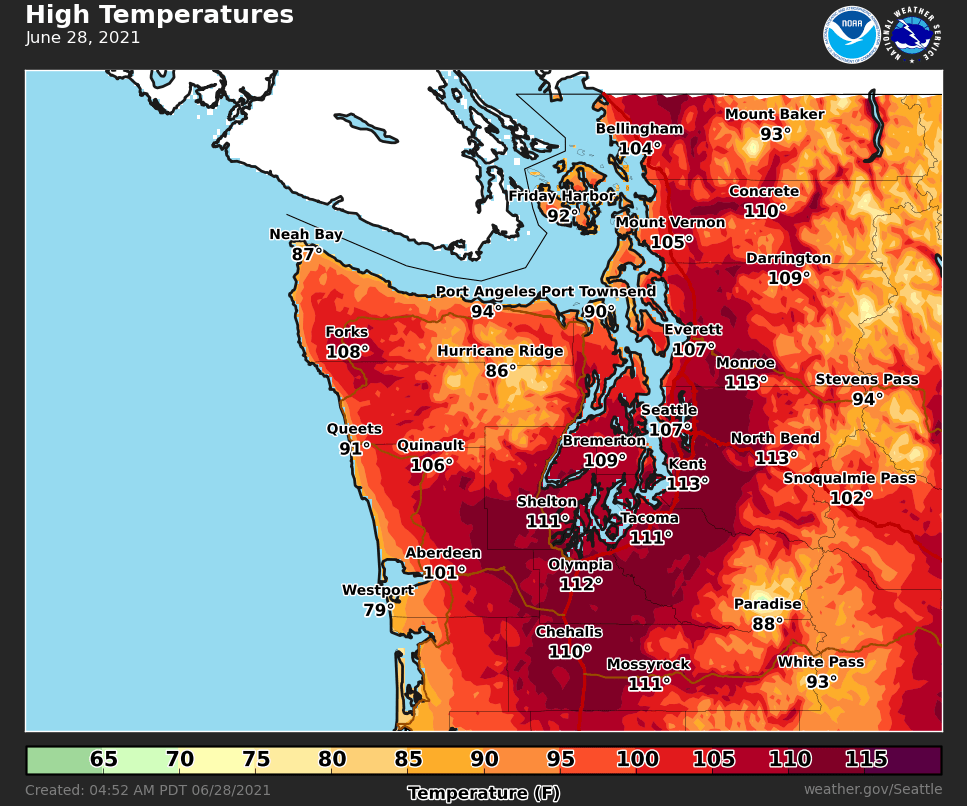
This image is a temperature forecast map for the Pacific Northwest of the United States, titled "High Temperatures June 28, 2021," produced by NOAA's National Weather Service in Seattle. The map shows predicted high temperatures in degrees Fahrenheit for various locations in Washington state on that date.
- Map Type: Regional map (Pacific Northwest, Washington state)
- Measurement: High temperatures (°F)
- Date: June 28, 2021
- Color Scale (bottom of the map):
- Range: 65°F to 115°F
- Colors: Green (65°F) to dark purple (115°F), with yellow, orange, and red in between
- Regions and Temperatures:
- Extremely High (purple, 110°F to 115°F):
- Seattle: 113°F
- Olympia: 112°F
- Bremerton: 109°F
- Kent: 112°F
- North Bend: 113°F
- Snoqualmie Pass: 102°F
- Very High (red, 100°F to 110°F):
- Forks: 108°F
- Quinault: 106°F
- Aberdeen: 101°F
- Everett: 107°F
- Monroe: 113°F
- Darrington: 109°F
- High (orange to yellow, 90°F to 100°F):
- Port Angeles: 94°F
- Port Townsend: 90°F
- Friday Harbor: 92°F
- Mount Vernon: 105°F
- Stevens Pass: 94°F
- Mount Baker: 93°F
- Moderate (green, 65°F to 90°F):
- Neah Bay: 87°F
- Westport: 79°F
- Chehalis: 110°F (outlier in a cooler zone)
- Paradise: 88°F
- White Pass: 93°F
- Extremely High (purple, 110°F to 115°F):
- Additional Info:
- Created: 04:52 AM PDT, June 28, 2021
- Source: weather.gov/Seattle
The map indicates an extreme heatwave across Washington state, with most areas experiencing temperatures above 100°F, and some coastal areas slightly cooler but still unusually warm for the region.
The heat caused a minimum of 500 fatalities in the US and Canada among vulnerable populations, including the elderly. These cities are not adapted to extreme heat, with a low percentage (about 40%) of homes having air conditioning. The heat was so extreme that up to a billion of clams and other shellfish were cooked inside their shells in an ecologic catastrophe. The heat caused major wildfires to rage throughout the area, including the town of Lytton which was virtually destroyed. Several weeks later and further south, temperatures reached 130 deg G in Death Valley, matching the world record the hottest temperature ever recorded.
July 2022 saw record breaking temperatures in Europe and notably in London where it reached 40.2 deg C or 104.4 deg F, an all-time record. That city is not adapted to temperatures that high and will have to invest significantly in areas like air-conditioning public transportation in the future.
Heatwaves will become more common and more extreme in most places in the future as the planet warms. Europe and Australia are going to experience more and more of them, as are places in India. The southern US will seem more like the Middle East in the future, with cities like Austin and El Paso becoming as hot as Dubai is today and Phoenix approaching Baghdad, Iraq temperatures. Washington DC is going to seem more like Austin in the summer, Boston will seem more like Philly and Billings, Montana more like El Paso.
More dramatically, there may be places in the Middle East and Northern India where humans may not be able to live in the future because it is impossible for the human body to cope with the searing heat. To be more precise, a wet bulb temperature that factors heat and humidity of 95 degrees F or 35 degrees C is where it is thought that a combination of kidney, heart, or even brain failure may commence, especially for vulnerable populations.
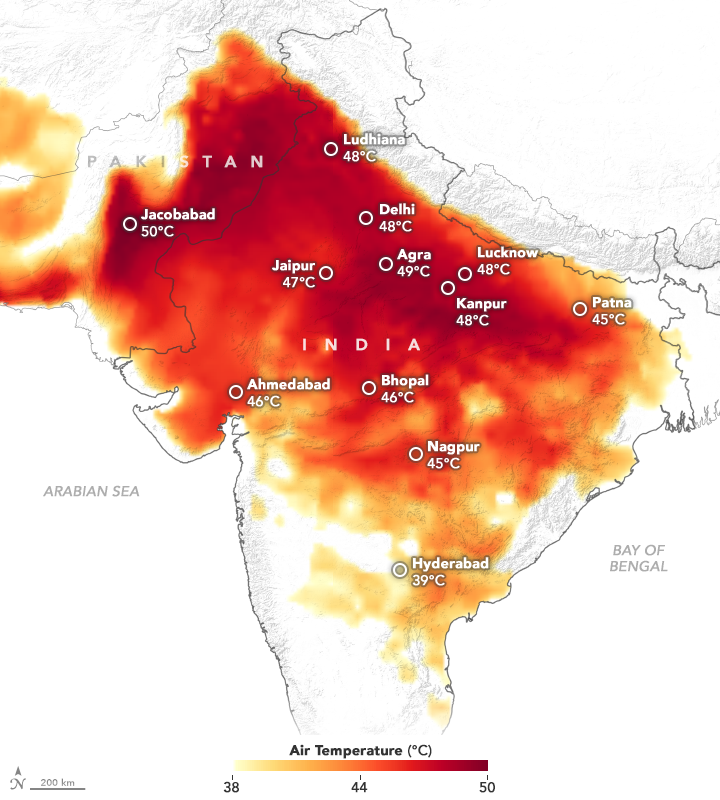
This image is a temperature map of India showing air temperatures in degrees Celsius across various cities. The map uses a color gradient to indicate temperature variations, highlighting a significant heatwave in the region.
- Map Type: India map
- Measurement: Air temperature (°C)
- Color Scale (bottom of the map):
- Range: 38°C to 50°C
- Colors: Yellow (38°C) to dark red (50°C), with orange and red in between
- Regions and Temperatures:
- Extremely High (dark red, 48°C to 50°C):
- Jacobabad (Pakistan, near the border): 50°C
- Delhi: 48°C
- Lucknow: 48°C
- Very High (red, 45°C to 47°C):
- Ludhiana: 48°C
- Agra: 49°C
- Kanpur: 48°C
- Patna: 45°C
- Bhopal: 46°C
- Nagpur: 45°C
- Jaipur: 47°C
- High (orange, 40°C to 44°C):
- Ahmedabad: 46°C
- Moderate (yellow, 38°C to 40°C):
- Hyderabad: 39°C
- Extremely High (dark red, 48°C to 50°C):
- Geographic Context:
- Surrounding areas: Pakistan, Arabian Sea, Bay of Bengal
- Scale: 200 km (bottom left)
The map shows a severe heatwave affecting northern and central India, with temperatures reaching up to 50°C in Jacobabad and exceeding 45°C in many cities, while southern regions like Hyderabad are relatively cooler at 39°C.
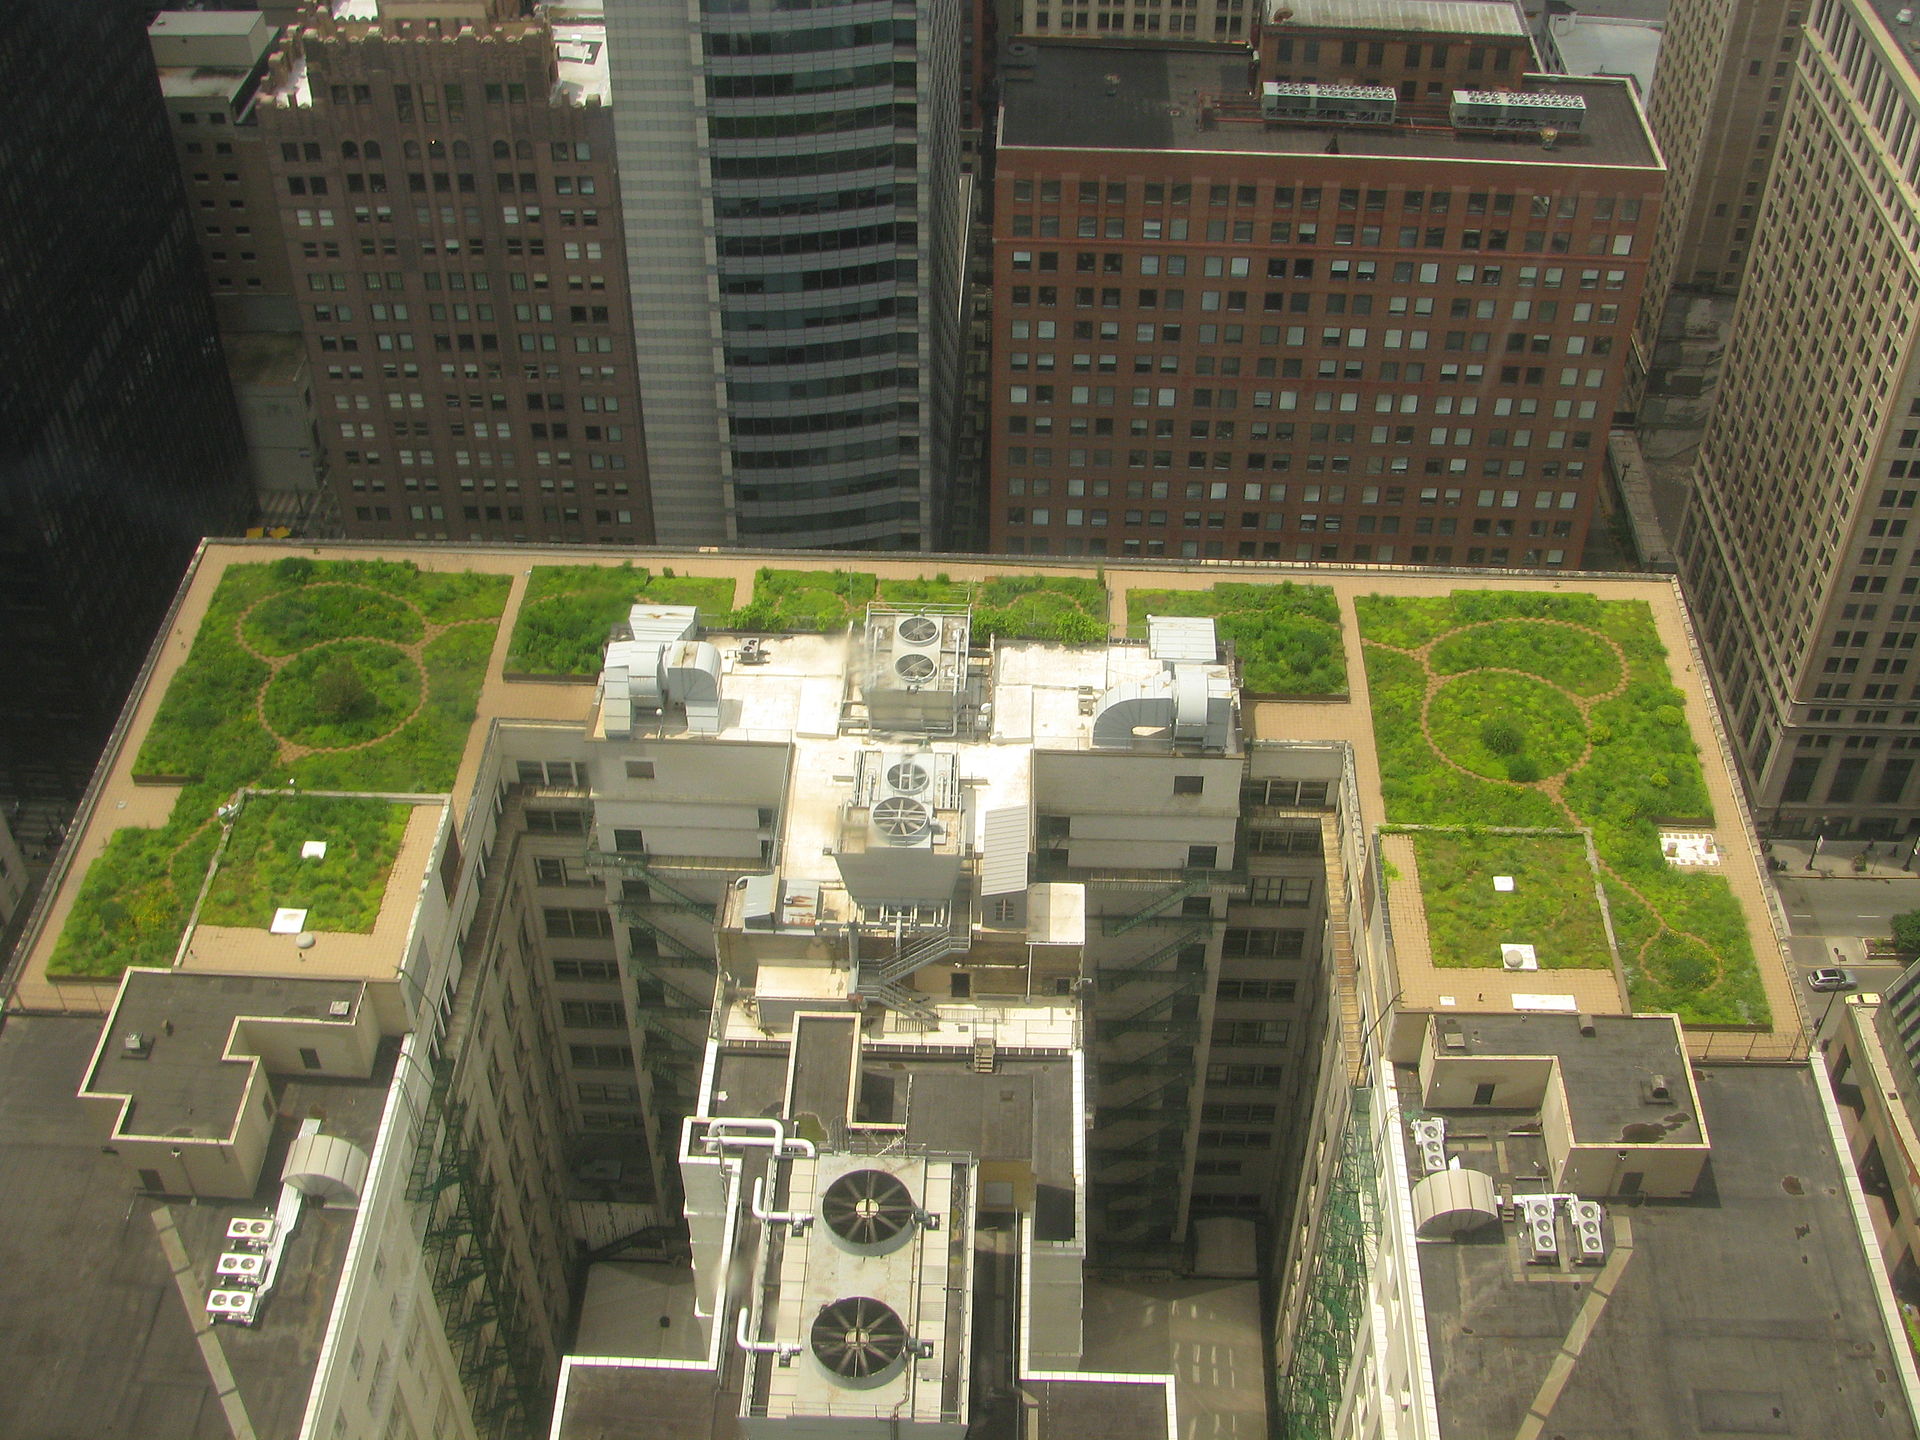
Like drought and fire, the 2022 IPCC report stresses the need for adaptation to heat. This is already taking place in the developed world where cities are reducing the heat island effect by, for example, planting more trees, making roofs green by covering with plants, and using materials for pavement that reflects heat as opposed to absorbing it. Unfortunately, these strategies are more difficult to apply in developing nations where necessities like air conditioning are also less available. Thus, it is likely that heatwaves will become increasingly deadly in coming decades.