
Atmospheric Water
We now turn our attention to water in the atmosphere. Water is a tremendously important part of the climate system, and it has a huge influence on the weather we experience every day. Clouds are made of water droplets or tiny ice crystals, and obviously, precipitation is water; but you also can sense the hidden water vapor in the form of humidity. If you don't understand the concept of humidity, plan a trip to the Magic Kingdom in Orlando, or, worse still, New Orleans in August! As we will learn in Module 3, water is one of the most important ways of transporting energy in the climate system. When water evaporates, it takes heat energy from the surface and carries that heat with it until it condenses back into liquid water, at which point it releases that heat into the atmosphere — this is what powers energetic storms. If you watch a large fluffy cloud building up on a summer day, expanding and growing up to greater and greater heights, just remember that all of that swirling movement is driven by the energy releases from water vapor.
The evaporation of water speeds up when it gets warmer. You could confirm this by doing an experiment with two pots of water on the stove, with the burner beneath each set to a different temperature — the hotter one will always evaporate faster. The same is also true with Earth's climate system — a warmer planet means more evaporation, which means more energy added to the atmosphere. And warmer air can hold more moisture than can colder air. If we study the laws of thermodynamics, we find that for a 1°C increase in the air temperature, the atmospheric water content should increase by about 7%. Until recently, it was difficult to measure the global water content in the atmosphere, but with the advent of satellites, we can now do this.
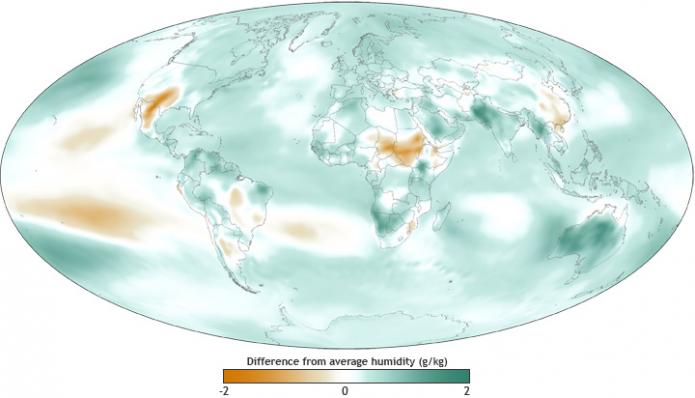
This image is a world map showing the difference from average humidity levels globally, measured in grams per kilogram (g/kg). The map uses a color gradient to indicate variations in humidity compared to the average.
- Map Type: World map
- Measurement: Difference from average humidity (g/kg)
- Color Scale (bottom of the map):
- Range: -2 g/kg to 2 g/kg
- Colors: Orange (drier, -2) to green (wetter, 2), with white at 0 (average)
- Regions with Notable Differences:
- Drier Areas (orange):
- Western North America
- Central Africa
- Parts of the Middle East
- Northern South America
- Wetter Areas (green):
- Central Asia
- Parts of Southeast Asia
- Southern Africa
- Eastern South America
- Near Average (white):
- Most of Europe, Australia, and the polar regions
- Drier Areas (orange):
The map highlights global variations in humidity, with significant drying in parts of North America and Africa, and increased moisture in regions like Central Asia and Southeast Asia.
This map above shows the relative changes in humidity (atmospheric water content) at the end of 2010 compared to the average over the period of satellite observations (1981 - 2010) — so this is a type of humidity anomaly map for the year 2011. The green areas are more humid than normal and the brown/orange areas are drier than normal. On the whole, you can see that the globe is moister than normal. You can also see that the eastern side of the equatorial Pacific Ocean is drier than normal — this is because 2010 was a La Niña year, and warm water was pooled up on the western side, cooler water on the eastern side; the cooler water evaporates less, hence the drier atmosphere above that region.
If we look at the longer record of the globe as a whole, we can see how the water content of the atmosphere has been changing over the last 40 years.
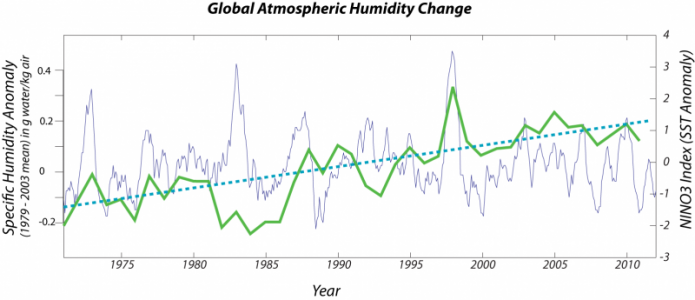
This image is a line graph titled "Global Atmospheric Humidity Change," showing changes in specific humidity from 1970 to 2010. The data is presented as an anomaly in grams of water per kilogram of air, relative to the 1979–2003 mean, with an additional comparison to the Niño 3.4 SST Index.
- Y-Axis (Left): Specific humidity anomaly (g water/kg air)
- Range: -0.2 to 0.4 g/kg
- Y-Axis (Right): Niño 3.4 SST Index anomaly (°C)
- Range: -3°C to 4°C
- X-Axis: Years (1970 to 2010)
- Data Representation:
- Specific Humidity Anomaly: Green line
- Fluctuates around 0 g/kg
- Peaks around 1998 at 0.3 g/kg, dips around 1992 to -0.1 g/kg
- Shows a slight upward trend over time
- Niño 3.4 SST Index Anomaly: Blue dashed line
- Fluctuates more dramatically
- Peaks around 1998 at 3°C, dips around 1975 and 1989 to -2°C
- Also shows a slight upward trend
- Background: Light purple shading
- Represents variability in the Niño 3.4 SST Index
- Specific Humidity Anomaly: Green line
The graph illustrates a correlation between global atmospheric humidity and the Niño 3.4 SST Index, with both showing a slight increase over the 40-year period, alongside significant fluctuations tied to El Niño and La Niña events.
The thick green line in the figure above is the global humidity anomaly (data from NOAA), with its best fit linear trend as the blue dashed line. Over this time period, the water content has risen by about 5%. The thin blue line is the history of the El Niño - La Niña oscillation — the seesaw sloshing of warm water back and forth along the equatorial Pacific Ocean. Positive values (scale on the left) indicate an El Niño year when more of the warm water sloshes over to the eastern Pacific (the South American side); negative values mean the warm water is pooled up on the western side near Indonesia. As can be seen, some of the fluctuations in global humidity correspond to the El Niño history, with more moisture generally associated with an El Niño year. But the general trend is rising humidity, and the El Niño history does not show a similar rise — this tells us that while El Niño is important, the underlying trend is more likely related to a warmer planet.
The central point here is that a warming Earth should have a more humid atmosphere and indeed that is the case, and more water vapor means more energy in the atmosphere.