
Greenland and Antarctic Ice Sheets
Just like their smaller counterparts, the huge ice sheets of Greenland and Antarctica are also shrinking. This is critical as melting of these ice sheets impacts climate through albedo feedback (Module 3) as well as global sea level (Module 10). Melting of all of the ice in these ice sheets would raise global sea level by about 70 meters (actually, Greenland would produce 6 meters and Antarctica about 60 meters). Don't worry, this isn’t going to happen any time soon, but the concern is that large glaciers on the edge of the continents are becoming increasingly unstable and will fail in coming years. The Thwaites glacier also known as the doomsday glacier is the one scientists are most concerned about. Collapse of this glacier could happen very rapidly and raise global sea level by 65 cm. We discuss this glacier in more detail in Module 10.
Given the remoteness and difficulty associated with studying these ice sheets, we only have good data on their size for the last decade, thanks to the advent of satellite systems that can monitor these glaciers. In particular, the GRACE satellite system has provided some very important data on the changes occurring in Greenland and Antarctica. This ingenious satellite system consists of a pair of satellites that are chasing each other in the same orbit around the Earth. The distance between the satellites changes according to subtle changes in gravity on the surface of Earth. As the lead satellite approaches a region of stronger gravity (due to more mass near the surface), it pulls away from the trailing satellite and then slows down as it passes the region of excess mass. In this way, the satellites can measure the subtle changes in gravity, and since the satellites pass over the same area every few days, they can detect changes in the gravity of a certain spot over time. If a big ice sheet loses mass due to melting, its gravitational effect on the satellites diminishes, and in this way, the satellites can detect the changes in the mass of these ice sheets — they are effectively “weighing” these glaciers, which is an extraordinary achievement. The results can be seen in the videos below. Note: videos do not have audio.
Video: Greenland Ice Loss as measured by GRACE and GRACE-FO (52 seconds) (No Audio)
https://svs.gsfc.nasa.gov/31156
Video: Antarctic ice sheet mass loss with superimposed ice sheet velocity streamlines (52 seconds) (No Audio)
https://svs.gsfc.nasa.gov/31158
These simulations above show the time series of Greenland and Antarctic ice mass changes from GRACE satellite data. You can see that melting is concentrated near the edges of the ice sheets and occurs in fits and starts (i.e., it is not gradual). The edges of the ice sheets, the ice shelves that float on the ocean, are holding the ice sheets back in a process known as buttressing. So once the ice shelves melt fast, this speeds up the melting of the edges of the ice sheet.
Other satellites passing over these ice sheets can measure the areas where surface melting produces small ponds of melt during the melting season. Much of the meltwater freezes back into the ice, but in some places near the edges of the ice sheets, the water sinks down into crevasses and travels all the way to the bottom of the ice, where it can lubricate the base and help accelerate the flow of the ice.
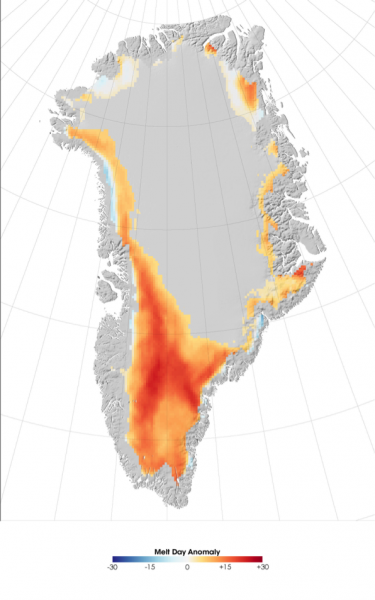
The above image shows the Greenland melt anomaly, measured as the difference between the number of days on which melting occurred in 2007 compared to the average annual melting days from 1988-2006. The areas with the highest amounts of additional melt days appear in red, and areas with below-average melt days appear in blue. Although faint streaks of blue appear along the coastlines, namely in northwestern and southeastern Greenland, red and orange predominate, especially in the south.
Video: Antarctic ice loss 2002-2016 (00:37) This video does not have audio.
The video below shows the dramatic loss of ice on Antarctica between 2002 and 2016. The loss is mostly around the edges of the continent and focused in a few areas.