
Module 3: Earth's Climate System
Video: Module 3 Introduction (1:14)
TIM BRALOWER: Hi, students. Welcome to module 3 on climate models. I grew up in London back in the 1960s, and weather forecasts were always wrong. They would predict a storm--it would be perfectly sunny. They would predict sunny weather, and there would be a storm. They were always wrong. Now we're at a time when weather prediction is really good, and that is because the computer side of the models is very strong and very advanced, and we're getting much better at predicting climate in the future as well.
So in this module, you'll learn about how CO2 levels and forecasted levels of CO2 drives climate models. The amount of CO2 in the atmosphere will definitely be related to the temperature in the future, as well as the global rainfall in the future, storm tracks, and storm intensity in the future, fire forecasts in the future, and sea level rise. And what we're going to learn about in this module is how different levels of CO2 that are controlled by human activity in the future will definitely be used to predict temperature, rainfall, hurricane intensity, as well as sea level rise. I think you're going to learn a lot about this module, how it's important for your future, and I hope you enjoy it.
Introduction
This course is all about the Earth’s climate. Thus, it is essential that you have a solid understanding of how the climate system works. This module is all about the climate system. It is by far the most technical module in the course, and our philosophy is to lay out the science in a comprehensive way, equations and all, so that you can see that Earth's climate is in part fairly simple, governed by physical relationships that describe how heat from the Sun is exchanged on the surface of the Earth and in its atmosphere. Then, there are some very complex aspects of the Earth's climate that we will not devote much time to.
Here is an example of why this module is important. The Polar Vortex has become a household name in the US in recent years. In Texas in the winter of 2021, the cold air from the vortex caused unusually cold temperatures and this crippled the power system that was not built to withstand such temperatures. The power cuts caused chaos, up to 5 million people were without power often for many days, 12 million people lost water service due to freezing pipes, and 151 people died as a result of hypothermia and carbon monoxide poisoning.
Video: Deep freeze in Texas: Millions without power, 21 dead in historic snowstorms (2:54)
[Music throughout video]
TEXT ON SCREEN: Deep freeze in Texas. Homes and roads blanked in deep snow and temperatures colder than Alaska…
[Icicles on house]
[Several scenes of snow covered streets and roads]
TEXT ON SCREEN: Historic and deadly winter storms have sent the souther US state of Texas into a deep freeze with temperatures plummeting to as low as -18C in some places. In a state more used to heat and sunshine and ill-equipped for Arctic conditions.
[Scenes of ice covered landscapes]
BURKE NIXON, HOUSTON RESIDENT: We have no water. We woke up this morning, our pipes are all frozen, and we have no water in the house. Our neighbor just got us some propane to try to thaw our pipes because they are frozen. We’re not used to this in Texas.
[Scene of a truck going down a snow-covered road]
TEXT ON SCREEN: For many, the conditions have been made tougher by being left without power. With the storm knocking out about a third of the state’s energy production capacity.
[A man filling up a generator with gasoline in front of his garage. Then starts generator.]
TEXT ON SCREEN: As of late Tuesday, more than 4 million cross the state were still without electricity.
BIRGIT KAMPS, HOUSTON RESIDENT: We were getting ready to cook dinner and all of a sudden, lights went off, power went off, everything went off. And I was like, “Wow, now what do I do?” And, I grabbed a bunch of blankets. So we cuddled up with our three dogs, one cat, my daughter and, you know, made it through the night.
[Scenes from, Louisville, Kentucky: Snowy UPS facility with planes]
TEXT ON SCREEN: Winter storms have hit vast swathes of central and southern US since the weekend.
[Scenes from, Telluride, Colorado: vehicles driving down a snow-covered street in blizzard conditions and Icicles hanging from a house]
[Scenes from, Ciudad Juarez, Mexico: a grown up and child playing in the snow]
TEXT ON SCREEN: and even seen rare snowfall and caused power outages in northern Mexico.
[Snow-covered cars on a wet road and a traffic cop with warm clothes on]
[Scenes from, Chicago, Illinois: Man shoveling snow from around a vehicle along the street]
TEXT ON SCREEN: At least 21 people have been killed across four US states,
[View from inside a vehicle while driving down a snow-covered highway]
TEXT ON SCREEN: including in falls and traffic accidents.
[Scenes from, Brunswick County, North Carolina: Arial view of homes destroyed by tornadoes]
TEXT ON SCREEN: The extreme conditions have also triggered at least four tornadoes, including one in coastal North Carolina that killed at least three people.
[Person running in a snow-covered road]
TEXT ON SCREEN: The freezing weather is expected to continue to grip much of the United States until the weekend.
[Person shoveling their pathway]
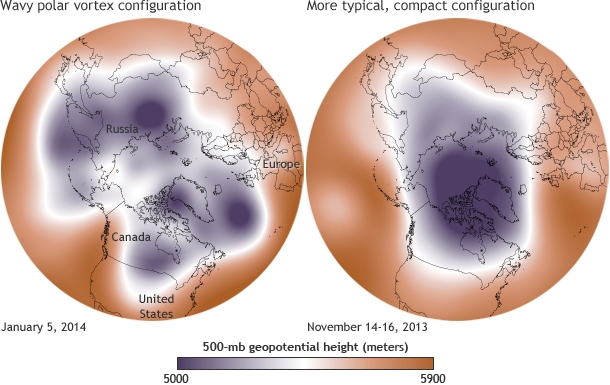
Those of us on the East Coast and Midwest of the US and our neighbors in Canada, 187 million people in all, lived through an extremely cold week at the beginning of 2014. Air temperatures, without the windchill factored in, reached -35oC in eastern Montana, South Dakota, and Minnesota. This cold was a result of the southward expansion of the polar vortex, a whirlwind of cold dense air that is normally restricted to the area around the poles. Understanding the polar vortex, and how it became unstable and swept across the Midwest and eastern parts of Canada and US, is key to interpreting the significance of the extreme cold in early 2014. Without this understanding, you might think that the expansion of cold air is a sign of cooling climate. However, it is likely that the opposite is the case; the recent cold snap is actually a result of warming. This is how it works. As you will learn in this module, the northern high latitudes are warming more rapidly than the rest of the globe as a result of melting sea ice. You will also learn that such warming leads to diminished wind velocities, including the polar vortex. As the vortex weakens, it becomes less stable and begins to wobble and stray from the region around the North Pole. It turns out that the recent cold snap was just one of these wobble events, and the projections are for polar vortices to become more common over North America in the future, just as other extreme events like extratropical hurricanes such as Sandy, heat waves and droughts become more frequent.
Now, right off the bat, we need to make it clear that the "simple" relationships are often portrayed in the module in terms of equations. You do not need to be a Math major to understand these equations, nor do we want you to memorize them. The point of showing the equations is not to cause great anxiety, but to provide an understanding of the relationship between two variables. For example, you should be looking to distinguish relationships that are linear (such as a=b*x [where * is multiplied by]) from those that are quadratic (such as a=bx2). This is the level at which we expect you to understand equations. One last word, the lab for this module is designed to strengthen the fundamentals you learn in the reading. By experimenting with climate in the lab, you should come away with a really solid understanding of the climate system.