
Blackbody Radiation
In the realm of physics, a blackbody is an idealized material that absorbs perfectly all EM radiation that it receives (nothing is reflected), and it also releases or emits EM radiation according to its temperature. Hotter objects emit more EM energy, and the energy is concentrated at shorter wavelengths. The relationship between temperature and the wavelength of the peak of the energy emitted is given by Wien’s Law, which states that the wavelength, lambda, is:
(λ is in m, T in kelvins)
But the energy emitted covers a fairly broad range, as described by Planck’s Law, as shown below:
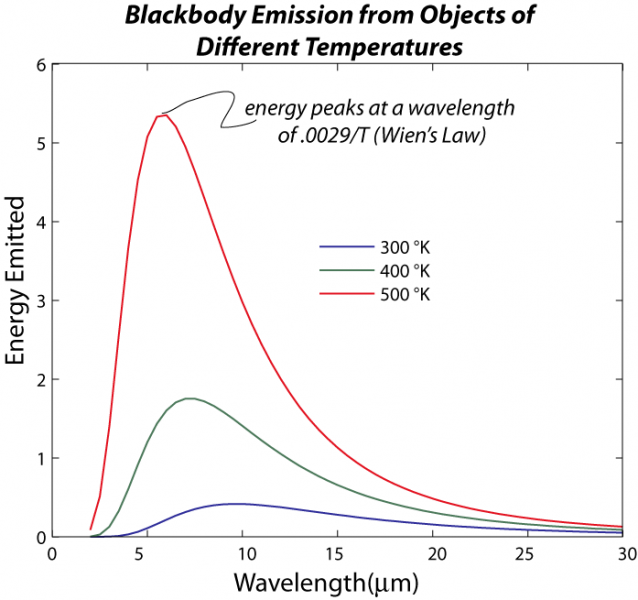
The image is a graph titled "Blackbody Emission from Objects of Different Temperatures," illustrating the energy emitted by blackbodies at various temperatures as a function of wavelength, based on Planck's law of blackbody radiation. The graph also references Wien's Law to highlight the wavelength at which the energy emission peaks for each temperature.
- Title: "Blackbody Emission from Objects of Different Temperatures" is written at the top.
- Axes:
- X-Axis (Wavelength): Labeled "Wavelength (μm)" and ranges from 0 to 30 micrometers (μm), with major ticks at intervals of 5 μm (0, 5, 10, 15, 20, 25, 30).
- Y-Axis (Energy): Labeled "Energy Emitted" with arbitrary units, ranging from 0 to 6, with major ticks at intervals of 1 (0, 1, 2, 3, 4, 5, 6).
- Data Representation:
- Three curves are plotted, each representing the energy emitted by a blackbody at a specific temperature:
- 300°K (Kelvin): Plotted in blue.
- 400°K: Plotted in green.
- 500°K: Plotted in red.
- Each curve shows the energy emitted across the wavelength range, with a distinct peak indicating the wavelength at which the maximum energy is emitted.
- Three curves are plotted, each representing the energy emitted by a blackbody at a specific temperature:
- Curve Characteristics:
- 300°K (Blue Curve): Peaks around 10 μm, with a maximum energy of about 1 unit, then gradually decreases toward longer wavelengths.
- 400°K (Green Curve): Peaks around 7.5 μm, with a maximum energy of about 2 units, showing a higher and sharper peak compared to the 300°K curve.
- 500°K (Red Curve): Peaks around 5.5 μm, with a maximum energy of about 5 units, exhibiting the highest and sharpest peak among the three curves.
- Annotation:
- A label near the 500°K curve states: "energy peaks at a wavelength of 0.0029/T (Wien's Law)," explaining that the peak wavelength is inversely proportional to the temperature (T) of the blackbody, as per Wien's Displacement Law. The constant 0.0029 is in meter-Kelvin units (m·K), so when divided by temperature in Kelvin, it gives the peak wavelength in meters (which is then converted to μm in the graph).
- Overall Trend:
- As the temperature increases from 300°K to 500°K, the peak of the emission curve shifts to shorter wavelengths (from ~10 μm to ~5.5 μm), and the total energy emitted (the area under the curve) increases significantly, consistent with the Stefan-Boltzmann Law and Wien's Law.
The graph visually demonstrates how blackbody radiation varies with temperature, showing that hotter objects emit more energy and at shorter wavelengths, which is a fundamental concept in understanding thermal radiation and its role in climate science (e.g., Earth's and the Sun's emission spectra).
The total amount of energy radiated from an object is also a function of its temperature, in a relationship known as the Stefan-Boltzmann law, which looks like this:
where σ is the Stefan-Boltzmann constant, which is 5.67e-8 Wm-2K-4 (this is another way of writing 5.67 x 10⁻⁸; so 100 is 1e2, 1000 is 1e3, one million is 1e6, etc.), T is temperature of the object in °K, and so F has units of W/m2. If you multiply this by the surface area of an object, you get the total rate of energy given off by an object (remember that Watts are a measure of energy, Joules, per second). As you can see, the amount of energy emitted is very sensitive to the temperature, and that can be seen in the figure above if you think about the area beneath the curves of different color. This sensitivity to temperature is very important in establishing the radiative equilibrium or balance of something like our planet — if you add more energy, that warms the planet, and then it emits more energy, which tends to oppose the warming effect of more energy added. Conversely, if you decrease the energy added, the planet cools and emits far less energy, which tends to minimize the cooling. This is a very important example of a negative feedback mechanism, one that works in opposition to some imposed change. The thermostat in your house is another good example of a negative feedback — it works to stabilize the temperature in your house, bringing it into radiative equilibrium.
The version of the Stefan-Boltzmann law described above applies for an ideal blackbody object, but it can easily be adapted to describe all other objects by including something called the emissivity, as follows:
Here, epsilon is the emissivity, which is a unitless value that is a measure of how good an object is at emitting (giving off) energy via electromagnetic radiation. A blackbody has epsilon=1, but most objects have lower emissivities. A very shiny object has an emissivity close to 0, and human skin is between 0.6 to 0.8.