
Process of Heat Transfer
The atmosphere and oceans are constantly flowing, and this motion is critical to the climate system. What makes them flow? In general, the movement is due to pressure differences — things flow from regions of high pressure to low pressure and the resulting surface winds distribute heat at the Earth's surface.
The image is a simple diagram illustrating a concept related to the lapse rate in the atmosphere, likely depicting how temperature changes with height in a column of air. The diagram consists of three vertical bars representing air columns at different heights, with arrows indicating a process or comparison between them.
- Overall Structure:
- The diagram shows three vertical bars side by side, each representing a column of air.
- The bars are arranged in a sequence from left to right, with arrows pointing between them to indicate a progression or comparison.
- Left Bar:
- The leftmost bar is light blue and represents an air column with a height labeled "h" on the left side.
- The height "h" is indicated by a double-headed arrow spanning the entire length of the bar, suggesting this is the initial height of the air column.
- A yellow-green arrow points from this bar to the middle bar, indicating a transition or process.
- Middle Bar:
- The middle bar is a darker teal color and is shorter than the left bar, indicating a reduced height.
- This bar likely represents the same air column after it has been compressed or cooled, as it is shorter than the initial height "h."
- A yellow-green arrow points from this bar to the right bar, indicating another transition or comparison.
- Right Bar:
- The rightmost bar is light blue, similar to the left bar, and is the same height as the left bar (height "h").
- This bar likely represents the air column after it has been restored to its original height, possibly through expansion or warming.
- Interpretation:
- The diagram appears to illustrate the concept of the lapse rate, which describes how temperature decreases with increasing altitude in the atmosphere.
- The sequence of bars may represent an air parcel being compressed (middle bar) and then expanded back to its original height (right bar), showing how temperature and pressure change with height.
- The color change (from light blue to teal and back to light blue) might indicate a change in temperature or density, with the darker teal possibly representing a cooler or denser state.
The diagram is a simplified representation of an atmospheric process, likely used to explain the relationship between height, temperature, and pressure in the context of the lapse rate, a fundamental concept in meteorology and climate science.
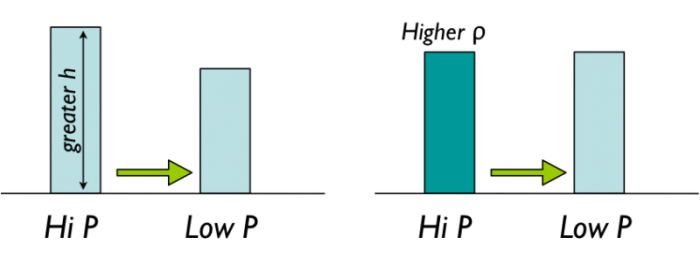
The pressure changes are themselves due to density and height differences — higher density in the air or the oceans leads to higher pressures. The density differences are due to changes in composition and temperature; this works slightly differently for air and water. In air, the important compositional variable is water vapor content — more water means lower density air. When we say more water, we mean that for a given number of molecules in a volume of air, a greater percentage of them are water, and water, as shown below, is lighter than a nitrogen molecule, which is the most abundant molecule in our atmosphere.
Density of Air
Inverse relationship with Temperature:
Higher temp = lower density → rising air
Weight of H2O= 18
Lower temp = higher density → sinking air
Weight of N2 = 28
Inverse relationship with water content:
More water = lower density → rising air
Less water = higher density → sinking air

Image Reads:
Density of Air
Inverse relationship with temperature
Higher temp = lower density ⇒ rising air
Weight of H20 18g/mol
Lower temp = higher density ⇒ sinking Air
Weight of N2 = 28g/mol
Inverse relationship with water content
More water = lower density ⇒ rising air
Less water = higher density ⇒ sinking air
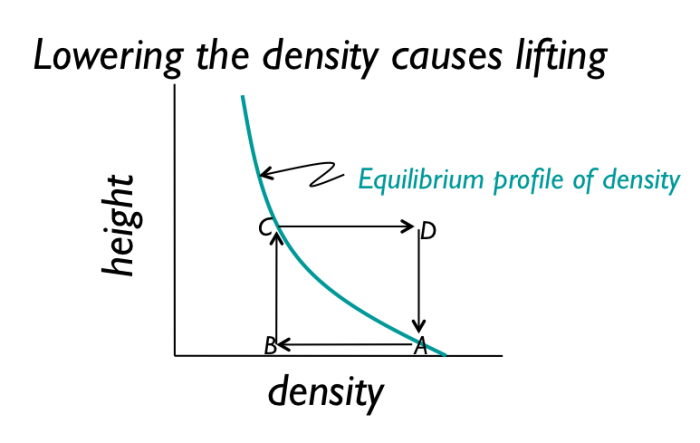
As indicated above, density differences can cause either rising or sinking of air masses. Because Earth’s gravity decreases as you move away from the surface, there is a kind of equilibrium profile of density with height above the surface, as shown by the green curve below:
The image is a simple graph labeled "Equilibrium profile of density," depicting the relationship between density and an unspecified variable, likely altitude or depth, in a fluid medium such as the atmosphere or ocean. The graph consists of a single curve on a black background with minimal labeling.
- Curve:
- The curve is plotted in cyan and shows a smooth, exponential-like decay.
- It starts at a higher value on the left side and decreases as it moves to the right, approaching a lower value asymptotically.
- The curve suggests that density decreases with increasing altitude (if the x-axis represents height in the atmosphere) or increases with depth (if the x-axis represents depth in the ocean).
- Axes:
- The graph lacks explicit axes labels or numerical scales.
- The x-axis likely represents the variable with which density changes (e.g., altitude, depth, or another parameter), increasing from left to right.
- The y-axis likely represents density, decreasing from left to right as the curve slopes downward.
- Trend:
- The curve indicates an equilibrium state where density decreases exponentially with increasing altitude (or increases with depth), which is typical in atmospheric or oceanic profiles due to gravitational effects and pressure gradients.
The graph visually represents a fundamental concept in atmospheric or oceanic science, showing how density varies in a stable, equilibrium state, likely influenced by factors such as gravity, temperature, and pressure. The lack of specific axes labels makes the exact context (e.g., atmosphere vs. ocean) ambiguous, but the shape of the curve is characteristic of such profiles.
If we lower the density of air at the surface from A to B, then the air rises from B to C. Then, if we increase the density of air at point C, moving it to D, it will sink back down to point A near the surface.
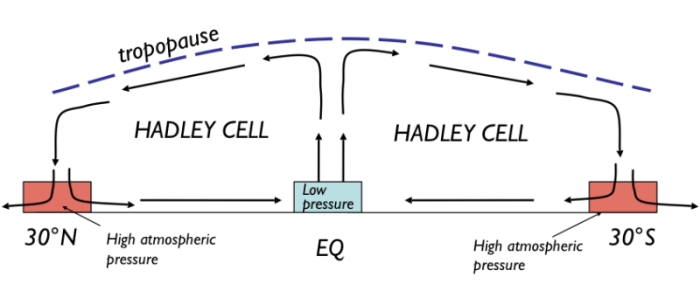
We start with the movement of the atmosphere, which we will try to make as simple as possible by first concentrating on the flow as seen in a vertical slice from pole to pole. The story begins at the equator, where air is warmed and lots of evaporation adds water to the air, giving it a low density:

The image is a simple graph depicting a temperature profile in the atmosphere, likely illustrating the concept of the lapse rate or temperature variation with altitude. The graph consists of a single curve on a black background with minimal labeling.
- Curve:
- The curve is plotted in blue with a dashed line style.
- It forms a smooth, parabolic shape, starting at a higher value on the left, reaching a peak at the center, and then decreasing symmetrically to a lower value on the right.
- The curve likely represents temperature as a function of altitude, with the peak indicating a temperature maximum (possibly at the tropopause or another atmospheric layer) and the decrease on either side representing cooling with increasing altitude.
- Axes:
- The graph lacks explicit axes labels or numerical scales.
- The x-axis likely represents altitude, increasing from left to right.
- The y-axis likely represents temperature, with the peak at the center indicating the highest temperature in the profile.
- Additional Element:
- At the bottom center of the graph, there is a small rectangular box with the symbol "L" inside it, possibly indicating the lapse rate (the rate of temperature decrease with altitude) or another related parameter.
- Trend:
- The curve suggests a temperature profile where temperature increases with altitude up to a certain point (the peak) and then decreases, which is characteristic of the troposphere-stratosphere transition in the atmosphere.
The graph visually represents a fundamental concept in atmospheric science, showing how temperature varies with altitude in a simplified manner, likely focusing on the lapse rate or a specific atmospheric layer.
This air rises until it gets to the top of the tropopause, which is a bit like a lid on the lower atmosphere. It then diverges, with some of the air flowing north and some flowing south. As it rises and moves away from the equator, the air gets colder, water vapor condenses and rains out and the air grows drier — the cooling and drying both make the air grow denser and by the time it reaches about 30°N and 30°S latitude, it begins to sink down to the surface.
- Diagram Overview:
- A simple diagram illustrating a low-pressure system in the atmosphere.
- Features a blue dashed parabolic curve on a black background.
- Curve Details:
- The blue dashed curve dips to a minimum at the center.
- Represents a pressure profile with altitude or horizontal distance.
- Indicates the lowest pressure at the center of the curve.
- Labeling:
- A light blue box labeled "Low pressure" is placed at the center below the curve.
- Marks the point of lowest pressure in the system.
- Surrounding Elements:
- Two red upward-curving shapes on either side of the "Low pressure" label.
- Indicate higher pressure regions surrounding the low-pressure center.
- Interpretation:
- Suggests the structure of a low-pressure system where air rises at the center.
- Often associated with weather phenomena like storms due to the pressure gradient.
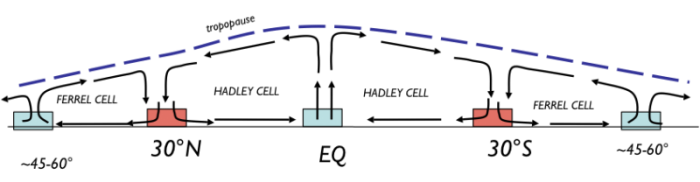
The sinking air is dense and dry, creating zones of high pressure in each hemisphere that are associated with very few clouds and rainfall — these are the desert latitudes. The sinking air hits the ground and then diverges. Some flows south and some flows north; the parts of this divergent flow that return towards the equator complete a loop or a convection cell, a Hadley Cell, named after Hadley, a famous meteorologist. Now, let’s turn our attention to the air that flows away from the equator. Moving along the surface, it warms and picks up water vapor, and so, its density decreases, and it eventually rises up when it gets to somewhere between 45° and 60° latitude in each hemisphere.
- Diagram Overview:
- A simple diagram illustrating a high-pressure system in the atmosphere.
- Features a blue dashed parabolic curve on a black background.
- Curve Details:
- The blue dashed curve peaks at the center, forming a convex shape.
- Represents a pressure profile with altitude or horizontal distance.
- Indicates the highest pressure at the center of the curve.
- Pressure Elements:
- Two red upward-curving shapes on either side of the center, indicating low-pressure regions.
- Three light blue boxes with a "J" symbol, placed at the far left, center, and far right below the curve, representing high-pressure points.
- Interpretation:
- Suggests the structure of a high-pressure system where air sinks at the center.
- Often associated with clear, stable weather due to the sinking air in the high-pressure region.
Once again, the rising air runs into the tropopause (which is lower at these higher latitudes) and diverges, with some of it returning toward the equator, thus completing another convection cell called the Ferrel Cell. The air that flows pole-ward sinks down at the poles, creating yet another convection cell known as the Polar Hadley Cell. These convection cells create bands of low and high pressure that roughly follow lines of latitude that exert a big influence on the climate at different latitudes. The air flowing within these convection cells does not simply move north and south as depicted above — the Coriolis effect alters the flow directions, giving us a surface pattern that is dominated by winds flowing east and west.
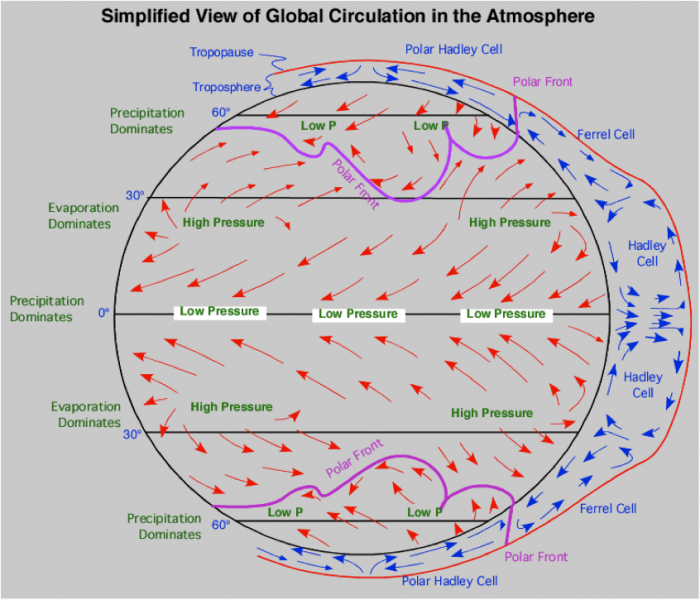
- Diagram Overview:
- A diagram titled "Simplified View of Global Circulation in the Atmosphere."
- Depicts a cross-section of Earth's atmosphere, showing circulation patterns from the equator to the poles.
- Atmospheric Layers and Latitudes:
- The troposphere is shown at the top, with the tropopause as a wavy line.
- Latitudes are marked: 0° (equator), 30°, 60°, and 90° (poles) on both hemispheres.
- Circulation Cells:
- Hadley Cells: Near the equator (0° to 30°), with rising air at the equator (low pressure) and sinking air at 30° (high pressure).
- Ferrel Cells: Between 30° and 60°, with rising air at 60° (low pressure) and sinking air at 30° (high pressure).
- Polar Hadley Cells: Between 60° and 90°, with rising air at 60° (low pressure) and sinking air at the poles (low pressure).
- Pressure and Flow Patterns:
- Red arrows indicate rising air (low pressure, labeled "LOW P") at 0° and 60°, and sinking air (high pressure) at 30° and the poles.
- Blue arrows show the direction of air movement within the cells, looping between high and low pressure zones.
- Polar fronts are marked at 60° latitude in both hemispheres, where air masses converge.
- Weather Patterns:
- Green labels indicate dominant weather patterns:
- "Precipitation Dominates" at 0° and 60° (rising air leads to rain).
- "Evaporation Dominates" at 30° (sinking air leads to dry conditions).
- Green labels indicate dominant weather patterns:
- Interpretation:
- Illustrates the three-cell model of atmospheric circulation (Hadley, Ferrel, Polar Hadley).
- Shows how pressure differences drive global wind patterns and weather, with precipitation and evaporation varying by latitude.
Note that the boundary between the Polar Hadley Cell and the Ferrel Cell (often called the Polar Front, and associated with the mid-latitude jet stream) is highly variable, with big loops in it. These loops, or waves, change over time to a much greater extent than the boundaries between the other convection cells.