The Projection Project
The Projection Project
Short version: With high confidence, warming from rising carbon dioxide will bring more very hot days and fewer very cold ones, more sea-level rise, stress for endangered species, plant fertilization but heat stress, more-intense peak rains but drying in many times and places, and many other impacts. Small changes will bring winners and losers, but losers will grow to far outnumber winners if we continue on our current path and cause very large changes.
Friendlier but longer version: For the next decade or two, the biggest uncertainties about future climate are linked to things we cannot know—will there be a big volcanic eruption in the next decade, or an extra El Nino or La Nina? The expected warming over a decade or two for any of the choices we are likely to make is more-or-less the same size as the cooling effects of a big volcano or La Nina. For a small number of decades after that, the biggest uncertainties are probably linked to things we don’t fully understand about the climate. Recall that the equilibrium warming from doubled CO2 is estimated to be between 1.5 and 4.5°C. The big difference between the high and low estimates might be reduced by better climate science, although the interactions among feedbacks mean that greatly reducing the uncertainty is quite difficult. But, by late in the century, the uncertainties related to volcanoes or climate sensitivity are smaller than the uncertainties related to what we humans choose to do. And remember at least the younger students in this class are likely to live longer than that!
Because our choices are so important, climate scientists normally don’t discuss predictions, choosing instead to provide projections: “If people decide to do xxxx, then the climate will do yyyy, with an uncertainty of zzzz.” By replacing the “xxxx” with different things we might do, the science shows policymakers and other people the changes yyyy±zzzz that their decisions would cause.
Video: Past and Future CO2 Atmospheric Concentrations (1:58)
PRESENTER: This is another figure from the IPCC from 2007, their fourth assessment report. The year 1000 is over here. So this is year, and it comes up to the year 2000 and then into the future going that way.
This is how much CO2 was in the air. And so what we're looking at here is a long period of stability. These are ice core data from breaking bubbles in various cores in Antarctica with different levels of impurities, different snowfall, different temperature but the same record.
As we come in here, what we see is that the ice cores and the instrumental record, what's measured in the air today, actually agree just beautifully and that we really, really have raised CO2. And these are various possible futures running off here to the right. And depending on sort of how the economy grows and so on, none of these include a strong effort to reduce CO2. So far we've been tracking very near the highest of these or above it a little bit, but we haven't gone very far and so it's a little hard to tell which way we're going.
The things to notice are that the rise so far from human CO2 is unequivocal. It's beautifully clear scientifically, but it's not very big compared to what's coming in all the future's envisioned. We see a much larger change in the future than in the past.
And all of these curves are still headed up as they get to the point where students today are getting old but are still not passed away. And our children and our grandchildren very clearly will live off of this. So if we don't do something about our CO2, the changes coming are very, very much bigger than the changes that have happened so far.
The graph just above shows the history of atmospheric CO2 over the last millennium as measured in bubbles from ice cores, including the very close agreement between ice-core and atmospheric data during the decades of overlap, and then shows various possible futures. These future “scenarios” were prepared to bracket likely paths we may follow, and provide enough curves so that one of them may prove to be fairly close. So far, we’re running near the highest of the projections, but close to the others because the different scenarios don’t diverge a lot until further in the future. None of these paths assumes that we take major efforts to reduce greenhouse-gas emissions, which could lower any of them.
Notice that in all of these scenarios the projected changes are much larger than those to date, with CO2 still rising beyond 2100. (The world does NOT end in 2100!) With notable uncertainties, fossil fuels may become rare by the time CO2 reaches the top of the chart around 1000 ppm, or may be common enough to drive CO2 more than twice that high, giving us two or three doublings from the relatively stable level of approximately 280 ppm before the industrial revolution.
We could estimate future temperature by taking the climate sensitivity of around 3°C for doubled CO2 (or between 1.5 and 4.5°C), and the two or three doublings, calculating a warming, and reducing that a bit because the warming lags the CO2 a little and the CO2 will start down before peak warming is reached. We get much more information by taking our best models, run by different groups in different ways, forcing them with the scenarios, and studying the results.
Warming to the Future
Warming to the Future
Video: Global Surface Warming (2:23)
PRESENTER: This is a plot from the IPCC from 2007, their fourth assessment. Down here, this is basically going to more CO2 as we go in the future.
And so these different things are scenarios for how much CO2 we face. This is the history of temperature going from 1900 up through 2000 and then the future of temperature as we look into the future.
The warming, to date, is sort of one degree. That's not terribly big. The uncertainty is somewhere between one degree Fahrenheit and one degree Celsius. And so the warming is sort of one degree.
If in the year 2000, we had stabilized the composition of the atmosphere, so no more changes happened in the air, we actually would have expected a little more warming, as shown on this orange curve down here, because the ocean has to catch up.
Right now, a lot of the heat is going from the air into the ocean. And as the ocean warms, the air will catch up. But not a lot more warming.
These others show various paths in the future, depending on how much CO2 we emit. So far, we're tracking very near or just above the uppermost of these. But we haven't gone very far yet.
Things to notice-- first of all, is it in all futures in which we don't do a lot to reduce CO2, the warming that is coming is very big compared to the warming which has happened?
Now, the world does not end in 2100. And you'll notice that all of these curves are still heading up, at least slowly and possibly rapidly, as we go into the future. Some students are going to live off of this graph.
You'll also notice over on the side that the uncertainties, as so often happens in this, are mostly on the bad side. So there's a most likely value. And it could be somewhat less or there's more room on the high side.
If it's more, it could be even more. And so what you see is that, if we don't do a lot to head off CO2 emissions, the warming, so far, is very small compared to the warming that comes, with the uncertainties mostly on the bad side.
The figure shows the past warming, which is just under 1°C or roughly 1°F, together with the future warmings for the different scenarios. The lowermost future line assumes that the atmospheric composition had been stabilized in the year 2000, with no further rise of CO2. Warming continues in that scenario because some heat is now going into the ocean, keeping the air cooler than it will be as ocean warming catches up. Note that it is already too late for us to follow that path because we have raised CO2 since 2000. Also, we are committed to some additional warming if we choose to stabilize the atmospheric concentrations at any point in any of the scenarios, again because of the slow warming of the ocean.
In all the other scenarios, if we don’t make major efforts to reduce future CO2 emissions, the future warming is projected to be quite large compared to the past warming, and the temperature is still going up as the next century starts. Also notice the uncertainty bars on the right, showing that warming may be a little less than the most-likely estimate, or a little more, or somewhat more than that.
Warming around the Globe
Warming around the Globe
Video: Projected Surface Temperature Changes (2:55)
PRESENTER: This is a moderately complicated plot that comes from the IPCC, and we're going to look at a few things here. This is not much CO2 in the future relative to what's possible. And so you see how much warming might occur for the global average out to 2020 to '29, that decade, and how much warming might occur out at 2090 to 2099 in degrees Celsius, which are listed along the bottom here.
And then these maps correspond here on the right to the warming from 2020 to 2029, the average of that decade, and what you expect late in the century that we're in now for this low emissions. And then here's the same thing for somewhat higher emissions of CO2. More warming. And here's one where we really keep burning like crazy. I'm just going to walk you through that when all of them show about the same thing, but we'll start down there.
First thing to notice is that these are how much warming is possible by late in the century here, and they show probabilities. The highest point is the most likely, and then there's a slight chance of having low values like this or low values like this. What I hope you notice is that the warming could be a little bit less or it could be a little bit more. Very, very unlikely to be a lot less, but it is possible to be a lot more.
And so there's a lop-sidedness in this. And if the scientists are wrong about what's most likely, then it's more likely that we'll get more warming. More likely more warming than what people have been telling you. OK. That's important first.
Second thing. The average warming here is just over 3 degrees Celsius, which is sort of this color, which is what you'd get out here in the ocean. Most of the world is ocean. The global average is not what happens on land where we live. It's what happens primarily in the ocean.
What you will notice is that all of the colors over here tend to be darker in red colors than what's in the ocean when you go up on land. Almost everyone on the planet gets above average warming because the land warms more than the ocean, and almost everyone lives on the land rather than in the ocean. So when people tell you the global average warming they expect, in some sense, that's very optimistic because it's the low end of what's possible and it's mostly telling you what's happening where people don't live rather than where people do live.
The figures here show the projected warming, and uncertainties. The maps are the projected warming for the next decade (2020-2029, center) and the last decade in this century (2090-2099, right), for different possible emissions scenarios, with more CO2 emitted as you go down through the maps. The estimates were made with Atmosphere-Ocean General Circulation Models (AOGCMs), the big climate models of the world. And, the maps here are the averages of the projections from all of the models participating in this effort—tests in the past have shown that this average across all the models generally does better than any single model (the “wisdom of the crowd” in models).
Warming is projected to be especially slow in those places where ocean water sinks into the deep ocean, and especially fast in the Arctic. Projected warming is generally larger over land than over ocean. Because the Earth is mostly ocean, the numbers usually given for “global warming” are closer to ocean than to land values. But, almost everyone lives on land, so the great majority of people are expected to experience above-average warming!
The panels on the left show the uncertainties in the projected warming. Notice for the 2090-2099 projections (the larger warmings, in red), that the most-likely warming tends to be towards the low end of the possible warmings. We have already seen that the most-likely impacts of a specified warming are on the low-damage side of the possible impacts, and now we see that the most-likely warming is on the low side of the possible warmings. Both of these have the same effect: the less you trust climate scientists to get the most-likely estimate correct, the more worried you probably should be about climate change, because the numbers most frequently quoted by scientists are on the optimistic side of the possibilities.
Precipitating a Change
Precipitating a Change
Video: Relative Changes in Precipitation (1:21)
This figure is from the IPCC. And it's showing precipitation, rainfall, in the future for a moderate warming scenario. And on the left here is December, January, February. This is winter. And on the right here is maybe of more interest, this is summer.
And so this is showing how much water will come out of the sky. Things will look drier than this in a warmer world because evaporation will go up. In general, what you'll notice-- let's just look at the one on the right here, from summer. And sort of these redder or oranger areas down in here are going to be drier in the summer. And these bluer areas in the middle, then, are going to be wetter in the summers, as up in here at the poles as well.
And so what you generally tend to find is that the wet areas get wetter and the dry areas get drier. But in the modern world, we grow a lot of food in these places that are going to get drier. If you add in the rain will evaporate faster and that when it comes, it will fall really fast and tend to run off more, there's real worries about drought in the future.
This slightly complex figure shows projections of future precipitation. In general, the models project that wet places will get wetter, dry places dryer, and the dry subtropics will expand somewhat into currently wetter regions toward the poles. Evaporation is also expected to go up with warming, and many of the models find summertime drying in places we grow much of our food, so agriculture may be reduced more than you might think from looking at this, as we discuss after a quick look at sea level.
LOTS of other issues come up, because climate affects so many things that we care about. A few of the larger issues include sea level rise, more floods and droughts, agriculture impacts, and impacts on people.
Sea Level Rise
Sea Level Rise
Warming causes ocean water to expand and melts mountain glaciers. (Despite a few outliers or oddities, the great majority of mountain glaciers are melting.) The big ice sheets of Greenland and Antarctica are also losing mass. With continuing warming, we expect more sea-level rise. The recent rise has been about 3 millimeters per year, or just over an inch per decade, and sea level has risen almost a foot (just under 1/3 m) over the last century or so. We expect sea-level rise to continue and probably accelerate moderately, with at least a slight chance of a large acceleration if the big ice sheets change rapidly. A foot of sea-level rise might not seem like a lot when the biggest hurricanes can have storm surges of 10 or rarely even 20 feet (3 to 6 m). But, the last foot may be the one that goes over the levee or into the subway tunnels, so even a relatively small change in sea level can have large consequences for cities and other human-built structures.
Video: Sea Level Rise (1:17)
PRESENTER: This figure comes from the US government from NOAA, National Oceanographic and Atmospheric Administration. And all it does is show regions that will go underwater-- shown by the reddish color, such as here-- for various levels of sea level rise. And this is one meter of sea level rise over here on the left.
And you see certain places that are starting to get a little bit damp. This is two meters of sea level rise, and you see big areas where a whole lot of people live are in trouble, then. And this is four meters of sea level rise. And this one over here is eight meters of sea level rise. And you see really big areas getting wet.
The worst case scenario that we can dream of is actually a good bit bigger than eight meters. Clearly, people could build walls to hold back the sea. The Netherlands has done it. It's been done around New Orleans with dikes, although though sometimes fail. But it gets expensive if you're trying to wall off that much of the coast. So one suspects that if we head towards the worst case somewhere well out in the future, that it could become very expensive or we lose a lot of land.
More Floods and Droughts
More Floods and Droughts
As noted above, there is a tendency for wet places to get wetter and dry places to get drier, with the subtropical dry zones expanding somewhat. When conditions are right to rain, warmer air holds more water (by roughly 7% per degree C or 4% per degree F), so all else equal, a warmer climate can deliver more rain in a hurry. But, evaporation speeds up with warming, too. All winter, Dr. Alley’s tomato patch is damp or frozen; in the summer, just a week or two after a downpour he needs to water the plants again. A more summer-like world is likely to have more variability in the water cycle, with more floods and more droughts.
Video: Potential for Drought by the End of this Century (1:01)
PRESENTER: This figure comes from the US government, from the Environmental Protection Agency, EPA, and it's based on just a fascinating study that was published in 2011 that takes into account the changes in temperature, evaporation. It takes into account changes in the rainfall that are expected if we keep emitting a lot of CO2 when we look out late in the century. What you see is low risk of drought is expected, so something like over here, in places up near the pole, for example, where not a huge number of people live at this time.
But what you'll notice is the high risk of drought in very big areas where actually a whole lot of people live now. And so this is one of those plots that is maybe a little bit worrisome if you look out to the future and we don't decide to change their behavior. Because there are projections that we make drought more likely in a whole lot of places where a whole lot of people now live.
Agricultural Impacts
Agricultural Impacts
Plants need CO2 to grow, and higher CO2 levels will give faster plant growth. But, plants need many other things, too; in experiments with extra CO2 added to natural ecosystems, an initial growth spurt lasts a few years before settling down to only slightly faster growth than before the CO2 addition, because the plants need more of those other things to sustain fast growth. If CO2 is added to farm plants that also are supplied those other things, faster growth can continue, but the gain is still not huge.
Working against this fertilization effect of CO2, the projected increase in floods and droughts would make farming more difficult. Farmers have learned to handle the bugs and weeds that now annoy them, but changing climate allows new ones to invade.
Perhaps the biggest concern is heat stress on crops. At present, anomalously hot weather reduces crop growth in many agricultural regions even if the plants have enough water, fertilizer and protection from bugs and weeds. For much of the world, continuing our present path until late in this century is projected to give average summer conditions hotter than the hottest summer up to 2006 (the last data available for an influential study). Record highs are rising with average temperatures, and expected to continue doing so. Thus, unless crop breeders become highly successful at developing heat-resistant varieties, heat stress may become quite damaging if we cause large warming.
Video: Net Photosynthesis (1:19)
PRESENTER: This is from the site of the United States Department of Agriculture. Maize, which is what's shown here, is corn. And we eat a lot of corn and a lot of animals eat a lot of corn. Net photosynthesis is good. This is turning sun's energy into something we can eat. And so, up here, is eat and down here is starve. We don't eat if nothing is growing. And this is temperature, going from fairly warm to really hot up here, and in degrees Fahrenheit, there's 100 right there.
And what you'll notice is for this particular one, if you look at the rate of photosynthesis, what grows as it's affected by leaf temperature, when the leaf gets hot, growth slows a lot. This is something that's worrisome. In the modern world, a lot of places where we grow corn and other crops, on the hottest day of summer they don't grow very well because it's actually too hot for them. And we face some possibility that by late in the century, the hottest summer that we've ever seen until recently will be considered cool. And given this trend, that is something that a lot of people worry about.
Note also that the tropics are the big belt around the middle of the Earth, the polar regions are the small caps on the ends, and mountain ranges taper to points at the top, so simply moving poleward or up the mountains to follow cooler conditions involves losing ground. In addition, we now grow mid-latitude crops in soil that was transported by glaciers from higher latitudes or altitudes, so moving poleward in at least some places leaves most of the soil behind. Greenlanders are doing a little farming in special places such as on raised beaches from the ice age, but much of Greenland is too rocky for good farming, as shown below. So if Greenland's ice melts, raising sea level about 7.3 m (24 feet) averaged around the globe, and flooding valuable coastal property, the land revealed beneath the former ice sheet is not likely to be a wonderfully fertile replacement.
Video: South Greenland (1:15)
PRESENTER: This is a small farm in Greenland. The ocean is out here where the big O is. And in here there are some grass-- there's some alfalfa that's being grown to feed a few sheep. When the glacier was here-- you know 20,000 years ago-- the weight of the ice had pushed the land down. And when the ice melted, the ocean actually had succeeded in flooding this area for a little while before the land came back up. And it put in a little bit of sediment, which the crops now grow on.
However, all of this stuff up here is just one rock sticking out, because the glacier cleaned off all the soil there. And you can't grow anything there and you'll see why there is there's no crops up there, because it's just hard rock. A whole lot of Greenland the looks that way.
So you know here's a person for scale, you are not going to grow crops on this. The glacier took the soil away. And so in case you hear anyone say, oh, when it gets too hot in the tropics, we'll just move towards the poles and we'll grow crops where the ice used to be in Greenland-- no.
Overall, the effects of the rising CO2 and the changing climate are expected to be mildly positive for farms for the near term, switching to negative and becoming increasingly worse beyond a few decades. One study found losses for US corn and soybeans of 30% to 82% by late in this century, depending on the scenario used and other factors.
Impacts on People
Impacts on People
Too hot or too cold cause problems for people. But, we have largely mastered the art of putting on coats, boots, hats and gloves, whereas personal air conditioning is not well-advanced. Thus, in too-hot places we tend to stay inside air conditioned places or be unhappy, whereas in cold places we go skiing or snowmobiling. As warming reduces the snowy season in some places, fewer automobile accidents and airports closed by blizzards will be beneficial. But, the arrival of unexpected heat can be dangerous—the highly anomalous European heat wave of 2003 is estimated to have killed 70,000 people. Adaptations such as expansion of air-conditioning tend to reduce the health impacts when heat continues.
Still, humans and other animals risk damage or death when conditions are too hot. How hot is too hot depends on humidity (we can take higher temperatures when it is drier), and on exercise level. A recent study found that, averaged across the world’s human population, heat already here reduces the ability for people to work outside in the hottest months by about 10%. If we continue to release CO2 rapidly, this is projected to rise to a 20% reduction in work by 2050, 40% by 2100 and perhaps 60% by the end of the next century. These losses are concentrated in the warmer parts of the world, where they can be very large.
Lots of Other Issues
Lots of Other Issues
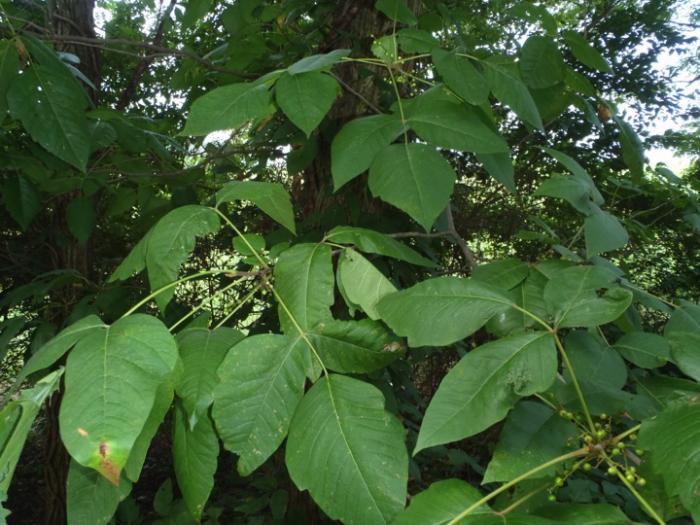
Climate affects almost everything somehow, so a great number of other issues can be raised, from huge to tiny. Vines seem to like carbon dioxide, for example, so poison ivy is expected to grow well, and vines may out-compete large trees in tropical rain forests.
More broadly, almost all ecosystems will be perturbed, often in major ways. Rare and endangered species may have difficulty migrating, especially if they are persisting in a park or preserve surrounded by human-controlled landscapes, or if they are migrating up a mountain and eventually having nowhere further to climb. Acidification of the oceans, and loss of oxygen with warming, will affect marine species and those of us who eat them. Loss of wintertime cold doesn’t mean that everyone in the high latitudes is about to get malaria, but one line of defense will go away. Changes in hurricane frequency are still highly uncertain, but the strongest storms seem likely to get stronger, and so much of the damage is done by the strongest storms. Cooling towers for power plants expect enough, and cold enough, water, and may experience troubles. And on, and on.
More Big Picture
More Big Picture
Very generally, we are adapted to the climate we have. In the short term, almost any change has associated costs. If two regions with different climates simply swapped their climates, for example, both would have wrong-sized air conditioners and heaters, too many or too few snow plows and swimming pools, less-than-optimal seeds for crops, etc. All of these can be fixed, but not for free.
If changes remain small, there are likely to be winners and losers. Warming may make beach resorts happier, but ski areas less happy. Rare and endangered species, and people trying to live traditional lifestyles, may be pushed to the edge by even small changes. For most people, if you have winter that interferes with travel and other activities, air conditioners so you can work in the summer, and bulldozers to build walls against the rising sea, a little warming is not especially costly; if you lack winter, air conditioners and bulldozers, even a little warming is likely to make your life at least a little harder.
But, if the temperature continues to rise, and the big hotter-than-we-like belt around the equator expands towards the poles, life is projected to get harder for most people in most places.
There are real uncertainties, so things really may end up better than this. But recall that, because breaking is easier than building, we don’t see how raising CO2 greatly and rapidly will create Eden, but we do see at least a slight chance of huge and damaging changes.
Video: Reducing Risks of Climate Change Damage (2:59)
PRESENTER: This is a fascinating figure from the IPCC. This is actually from the 2001 report. So this one goes back a little farther.
This part is CO2. And, actually, it's more CO2 as you move towards the left here. And that gives you more warming.
So this is how much warming you get for various possible futures. So far we're tracking on the high end. But we're really not sure where we'll end up in the long term.
And each of these over here, as we release more CO2, by late in the century, we get more warming. And so you can take the warming that you think we'll find and you can draw a line across. Maybe you think we're going to get three Celsius, because we're on the high end of the emissions. And so you draw the line across there.
Then what you see are various columns over here. So example one here is unique and threatened systems such as species extinction. If you are a rare and endangered species living in a little national park and now you need to migrate and there's cornfields in the way, even a little bit of warming is pretty bad for you.
And so you'll notice, this is going from orange up to red or into a more saturated color very, very quickly. Because even a little bit of warming causes a lot of trouble for unique and threatened systems.
If you're worried about when do we get more floods and more droughts, it doesn't take a lot of warming before you start getting to more floods and more droughts. And we'll be well into that before the end of the century. We're already seeing some of that now.
In some areas, poor people in hot places are already hurting now. Rich people in cold places-- it'll take more warming before they really get into trouble.
And because so much of the Earth's economy is in the rich people in cold places, you don't really worry about them until you get a good bit of warming. And this sort of, we killed the north Atlantic or dump the antarctic ice sheet, it takes a lot of warming until we get there.
And so in terms of the question, how much warming before we get into trouble, that bothers a lot of people, it depends what you're talking about. And for unique and threatened systems, for rare and endangered species, we're already pushing them hard, as well as for poor people in hot places.
The world's economy is not yet suffering hugely. But as the warming increases, it will tend to suffer more.
And the basic picture-- each degree of warming costs more than the previous degree and that the first degree didn't hurt a huge amount, because it's really only hurting the rare things and it's not hurting the economy. At some point, it starts to hurt the economy, too.
One way to look at the future is shown in the figure. Different things you might care about are shown by the different columns, and the risks from warming are shown by the increasingly orange-red (saturated) color going up in the columns. Another way to look at the issue is that damages are projected to go up faster than temperature; the first degree of warming is nearly free, but each degree beyond that costs more than the previous one did. The first degree has allowed us to test our models and learn that they are doing well; the next degrees really matter.
Please recognize that these projections do not include major human efforts to reduce emissions of CO2 and other greenhouse gases. And, we are certainly capable of making such reductions, or of adopting other approaches that might reduce the warming while supplying plenty of energy.
So, in the next Unit, we’ll look at some of the options. Then, we’ll return to Economics, Ethics and Policies that might address the paired issues of getting valuable energy for many people while reducing damages from climate change.
Activate Your Learning
The costs or benefits of changing climate depend on how much the climate changes. If the amount of change remains small, say 1˚C or so, who is likely to be most negatively impacted?
Click for answer.