Case Studies: Exposure, Sensitivity, and Adaptive Capacity in Real Examples
Case Studies: Exposure, Sensitivity, and Adaptive Capacity in Real Examples
To help you understand Exposure, Sensitivity, and Adaptive Capacity, you will be introduced to several case studies.
2004 Indian Ocean Tsunami
2004 Indian Ocean Tsunami
Introduction
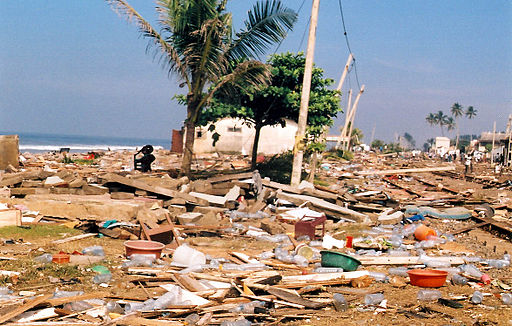
The Indian Ocean Tsunami of 2004, which we covered in Module 7, provides us with a case study to help understand how levels of sensitivity and adaptive capacity affected the level of impact and the recovery of the communities in the tsunami’s path.
The massive earthquake and tsunami that occurred on December 26, 2004, off the coast of Indonesia, was one of the most damaging disasters in recorded history. It caused at least 230,000 deaths and billions of dollars in damages in countries bordering the Indian Ocean. The tsunami impacted many countries including Indonesia, Sri Lanka, India, Thailand, the Maldives, and Somalia. Of the people who lost their lives, many vacationing westerners were included.
Following this severe hazard event, damages were unevenly distributed throughout the affected regions. The reasons for this inequity are complex and include variations in all three dimensions of vulnerability, exposure, sensitivity, and adaptive capacity. Let’s look at sensitivity and adaptive capacity.
Sensitivity
Variations in sensitivity were one of the major factors, driven by variability in economic resources and demographic factors.
Sri Lanka and housing sensitivity:
One heavily affected country was Sri Lanka, where 0.17% of the entire national population was killed and 2.5% were displaced. The Sri Lankan scholar Mohan Munasinghe observed that houses belonging to poorer individuals that were in the path of the tsunami were more likely to be destroyed due to the low quality of construction, suggesting a higher sensitivity of the physical property of poorer people. One clear way of reducing sensitivity to tsunamis in Sri Lanka would be stricter housing construction requirements at the coast. However, Sri Lanka is a poor country with limited economic resources, which could make implementing and enforcing such requirements difficult.
Adaptive Capacity
Importance of traditional family community networks for enhancing adaptive capacity:
Many community members in developing nations, despite lacking in economic resources, have access to strong traditional family and community networks. These networks are valuable, if not essential, for recovery by providing informal mutual help following a disaster, like a tsunami. In the case of Sri Lanka, Munasinghe noted that these networks improved survivors’ ability to cope with and recover from the disaster compared to wealthier groups. Therefore, in this instance, informal social ties reduced community sensitivity to the hazard event. This is an example of adaptive capacity, which will be described in a subsequent section.
Learning Check Point

Economic Recovery and Adaptive Capacity
Anthropogenic factors can sometimes exacerbate the losses from a natural hazard like a tsunami. Economic development patterns of South Asian coasts played a part in 2004, including tourist developments and shrimp farms, which had negatively impacted coral reefs and mangroves that otherwise might have diminished the intensity and inland reach of the tsunami. In some communities, the reliance on these types of economic development have limited local livelihood options to tourism-related or fishery-related jobs, instead of more traditional, diversified livelihood strategies. The damages to tourism and fisheries industries following the tsunami placed greater stress on communities that were heavily dependent on jobs in these sectors. Consequently, it was harder for local people in these communities to recover from the tsunami because of damages and the lack of other livelihood options.
Despite the widespread damage, some communities suffered less or recovered more quickly because they possessed higher adaptive capacities to this hazard event. One study found that fishing communities on Simeulue Island, Indonesia, and Surin Island, Thailand had fewer losses from the tsunami because they possessed traditional knowledge of tsunamis and had institutions in place that helped them prepare for and respond to the disaster.
Around the Indian Ocean basin, there were no early warning systems when the tsunami struck. In response to the disaster, governments almost immediately collaborated to develop the Indian Ocean Tsunami Warning and Mitigation System to reduce exposure to tsunamis. This aspect will be discussed further in Module 11.
1992 Hurricane Andrew and Housing Sensitivity in South Florida
1992 Hurricane Andrew and Housing Sensitivity in South Florida
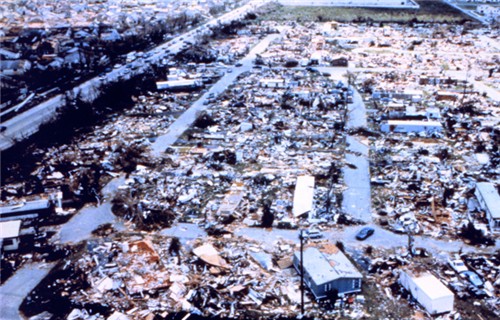
Another example of the role of sensitivity in creating vulnerability to hazards involves the impacts of hurricanes on mobile homes. As discussed in Module 6, in 1992, Hurricane Andrew struck the Florida coast as a category 5 storm. Many South Floridians still have vivid memories of Hurricane Andrew. It became the costliest storm in history at the time, causing an estimated $25 billion in damages and 17 direct deaths and many more indirect deaths, amounting to approximately 44 deaths. The storm came ashore just to the south of Miami, devastating the town of Homestead. Had it hit the coast just 20 miles to the north, it is estimated that the economic and human costs would have been multiplied more than ten-fold. In the case of Hurricane Andrew, the wind damage had the greatest impact. In the communities impacted, mobile homes received the most severe damage, and the severity of destruction was partially attributed to structural design that could not withstand the winds of a major hurricane. In fact, 90% of all mobile homes in Miami-Dade County were damaged beyond repair. In Homestead, 99% of mobile homes were completely destroyed. Many of South Florida’s poorer residents resided in this highly sensitive type of housing, so they were disproportionally impacted by the hurricane.
Many lessons were learned from Hurricane Andrew in terms of sensitivity related to insufficiently stringent building codes in general and mobile home construction codes specifically.
The production of mobile homes is regulated by the Department of Housing and Urban Development (HUD) building codes. At the time that Andrew struck, relatively lax building codes from 1976 were in place, making mobile homes especially sensitive to the major hurricane’s intense winds. After Hurricane Andrew, HUD significantly strengthened the building codes to enhance the structural integrity of mobile homes; these improved regulations went into effect in 1994. In addition, the Florida Department of Highway Safety and Motor Vehicles, which ironically treats mobile homes not as buildings but as vehicles, also placed several stricter rules on mobile home construction in 1996 and 1999.\
The revised mobile home standards have had a dramatic impact on the sensitivity of these structures (Table 1). In the very active 2004 hurricane season, which saw four hurricanes make landfall in Florida, all damages to mobile homes occurred in units built before the federal regulations changed. No mobile homes built after 1994 were damaged. This is a clear example of variable sensitivity to the same hazards based on the quality of construction.
| Hurricane | Total number of mobile homes in storms' path | Mobile homes built before July 1994 | Mobile homes destroyed | Mobile homes built after July 1994 | Mobile homes destroyed and seriously damaged |
|---|---|---|---|---|---|
| Charley | 11909 | 9011 | 2413/26.8% | 2898 | 0/0% |
| Frances | 7089 | 6961 | 99/1.4% | 128 | 0/0% |
| Ivan | 1432 | 1246 | 82/6.6% | 186 | 0/0% |
| Jeanne | 8845 | 8001 | 989/12.4% | 844 | 0/0% |
| Total | 29275 | 25219 | 3583/14.2% | 4056 | 0/0% |
Learning Check Point
Fukushima Daiichi Nuclear Disaster
Fukushima Daiichi Nuclear Disaster
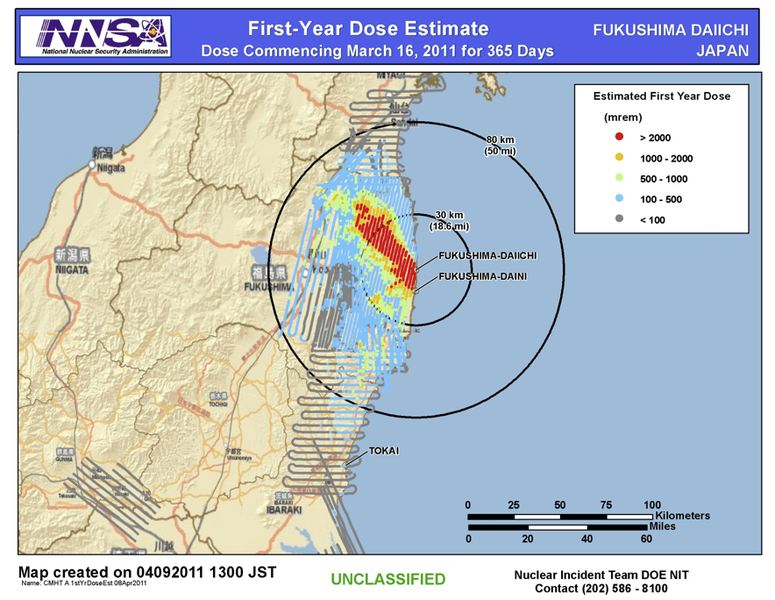
Let us return to the example of the Tōhoku earthquake and tsunami and subsequent Fukushima Daiichi nuclear disaster. Fukushima Daiichi and several other Japanese nuclear plants were all exposed to tsunami hazard, in the sense that they were close enough to the coast that a tsunami could affect their operations. The plants are designed to automatically shut down during earthquake and tsunami events, but the shutdown process itself requires power, which is provided by diesel generators. They are also protected by seawalls that are designed to prevent flooding by waters up to a specified height.
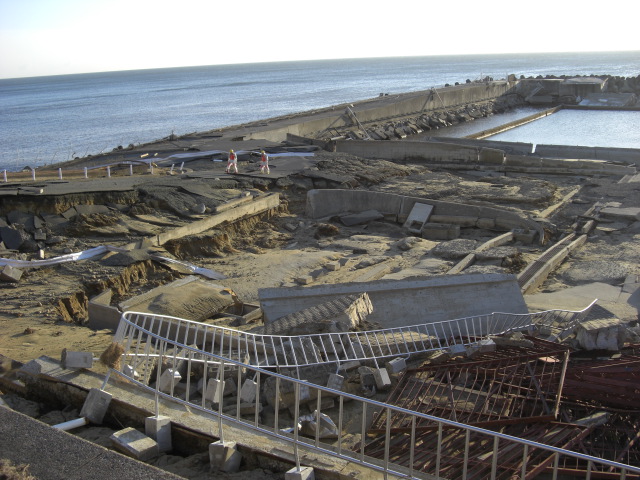
There were two major sources of sensitivity at Fukushima Daiichi, one of which applied to all of the other Japanese nuclear facilities, and one of which was particular to Fukushima Daiichi. If the on-site diesel generators at any plant flooded and failed, no additional failsafe mechanism was available, and a meltdown became possible. This potential for failure greatly increased the sensitivity of these plants and the surrounding populated places and property. More importantly, in this example, if the seawalls were too low and could, therefore, be overtopped by a tsunami, then flooding might disable the generators. This is exactly what happened at the Fukushima Daiichi plant. Its seawall was 19 feet high. Despite warnings in a 2008 report suggesting that the plant could be exposed to a tsunami of up to 33 feet, the plant was still protected only by the existing 19-foot seawall when the tsunami struck. The tsunami that made landfall reached over 40 feet high, even larger than the earlier report had suggested was possible. Because the seawall was inadequately protective relative to the magnitude of the potential hazard, the plant was more sensitive to a catastrophic meltdown, which in turn increased the sensitivity of nearby populations to exposure to radioactive materials and long-term contamination of property and natural resources.
What lessons might we learn from the Fukushima nuclear disaster that could reduce sensitivity to similar future hazard events? This is a particularly tricky question in this case. Earthquakes of the magnitude of the Tōhoku earthquake, which was the initial hazard event that triggered the tsunami and subsequent nuclear disaster, are extremely rare. However, sensitivity to a hazard of this magnitude was sufficiently great that the result was a catastrophe. The extents to which countries should prepare for very rare events with potentially extreme consequences are difficult political and policy questions.
However, setting those questions aside, there are two main ways in which sensitivity could have been reduced in this situation. First, the seawall was far too short and could have been overtopped by a much smaller seismic event and tsunami. To reduce this sensitivity, seawalls protecting nuclear power plants should be built to withstand a tsunami of the highest possible levels. Second, any additional strengthening or redundancy in the electrical power system responsible for powering shutdown during a seismic event would further reduce reactor sensitivity to a tsunami.
Learning Check Point
Please take a few minutes to think about what you just learned then answer the question below.
Tacloban, Philippines, and Super Typhoon Haiyan
Tacloban, Philippines, and Super Typhoon Haiyan
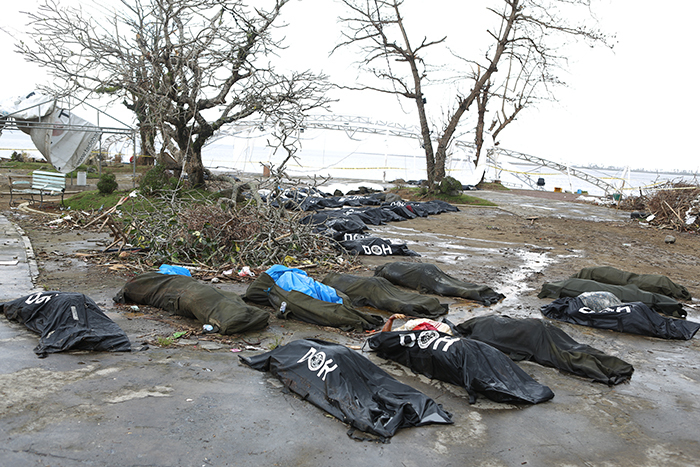
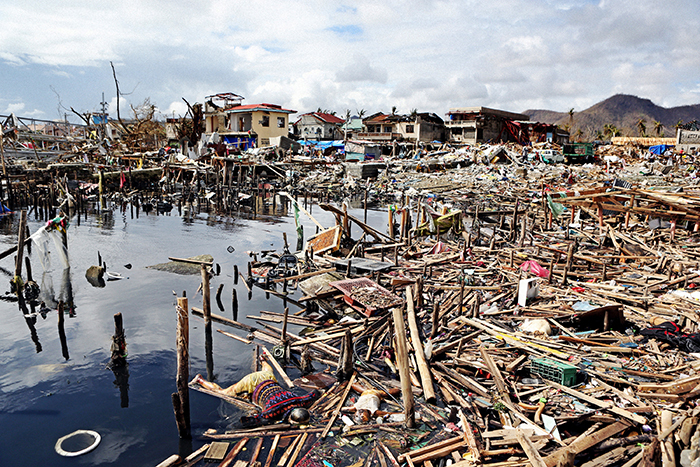
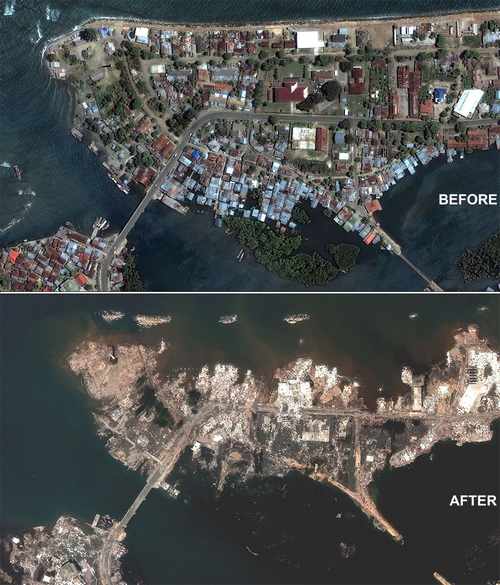
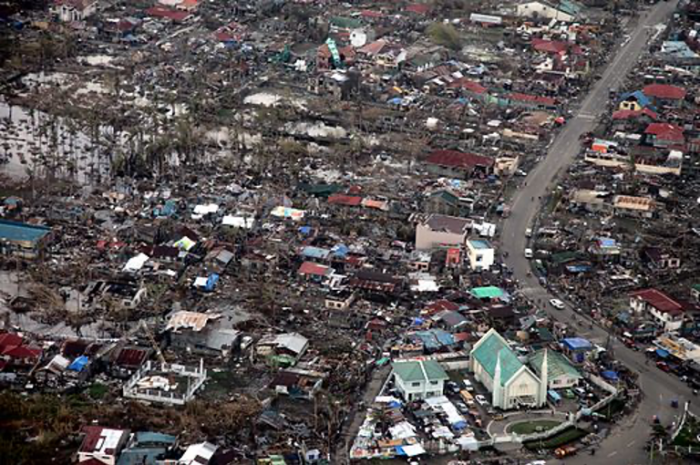
On November 8, 2013, Super Typhoon Haiyan (locally known as Yolanda) swept across the Philippines, generating a storm surge of more than 5 meters in places and winds in excess of 190 mph. Fifteen million people felt the effects of the storm directly. Across the nation, approximately 4.1 million people were displaced from their homes, and more than 6,000 lost their lives. This made Haiyan the deadliest storm recorded in the Philippines. The nature of the storm itself, the geology and geography of the Philippine Islands, as well the population distribution and economics of the people living in the affected communities all contributed to the severity of the impact of Haiyan on communities. What made Tacloban so vulnerable? We can break it down into the components of vulnerability to understand this,
Exposure
Tacloban City is densely populated with more than 240,000 residents, many of whom are poor. Much of the city sits at low elevation, with many parts, including the airport, sitting below 5 meters above sea level. The storm surge was reported to be more than 5 meters (16 feet) in height. Population density, at 1200 people per square km, or about 3,000 per square mile makes for a densely populated urban area. The Philippines is highly prone to typhoon activity, with twenty tropical cyclones crossing the island chain per year on average, with ten of those reaching typhoon status, and five of these causing major destruction. These factors render the Tacloban city highly exposed to typhoon hazards.
To appreciate the level of destruction and conditions in the immediate aftermath of the typhoon in Tacloban City and some of the factors that combined to create such levels, please read the two articles (BBC and New York Times) linked below. In the BBC article, there is a short video that really helps to bring to life the misery following a catastrophe such as this of a densely populated city such as Tacloban.
Sensitivity
Remember that by using the term sensitivity, we are referring to such measures as poverty levels and the state of infrastructure. Because Tacloban was essentially destroyed by Haiyan, everyone in the city was impacted (see maps in linked articles). But the high level of poverty that exists in the Philippines accentuated and increased the scale of suffering. According to the Humanitarian Practice Network, the Philippines ranked 165th in world GDP in 2013, and approximately 2 million people in the country were living on $2 per day. Tacloban is a relatively wealthy city within the Philippines, so this rate of poverty is not as severe in the city as some parts of the Philippines. However, even though the government had a relatively good typhoon preparation program in place, poverty levels, coupled with the sheer size of the storm, rendered preparations ineffective. Houses were not designed for the power of the storm surge and winds and were completely destroyed, leaving people homeless. The sensitivity of the low-lying infrastructure of the airport is another case in point. It sits close to sea level and was overwhelmed by the storm surge. Of course, an airport in an island nation is essential for disaster relief, so this hampered relief from reaching the stricken city immediately following the storm. It was three days before flights could land with relief supplies, and even then, only small planes could land. This led to a lack of basic supplies such as food and water for the residents. Long lines formed for scarce supplies. Refer to the BBC article in the readings linked below, which describes in detail the scenes of deprivation that ensued in the days following the typhoon. In addition, not only were roads and other transportation routes blocked, there would have been no working electricity or modern methods of communication in the aftermath of such a huge storm.
Adaptive Capacity
The poor are at a disadvantage when it comes to recovery. Those with financial means are more able to get back on their feet or bounce back from a disaster than those with few financial means. Many of those who lost livelihoods to Haiyan worked in the fishing industry and were poor. Two major elements worked to help the people of Tacloban and other communities devastated by Haiyan. One is the strong community networks that are so important, in which community members and families help each other. The other is aid from domestic and foreign governments and non-governmental organizations.
Currently, after nearly one decade, Tacloban’s economy is growing and the poverty rate has been lowered. This economic rapid bounce-back may be a phenomenon of a city that has to start from scratch. New Orleans also went through a rapid growth phase in the 10 years after Katrina. Sustaining this healthy economy will be the challenge and if Tacloban is successful, then it will prove its strong resilience and high adaptive capacity.
References and Recommended Reading
References
- Humanitarian Practice Network: Typhoon Haiyan: pushing the limits of DRR? [13]
- Humanitarian Practice Network: Assessing early warning efforts for Typhoon Haiyan in Leyte [14]
- The Guardian: Two years after typhoon Haiyan, leaders have a duty to act on climate change [15]
Recommended Reading
- Tacloban: City at the center of the storm (BBC) [16]. This article contains both images and video. Please note that the video contains disturbing images.
- Mapping the Destruction of Typhoon Haiyan (New York Times) [17] This article includes maps showing the path of the storm across the Philippines.