Salt Lake City
Salt Lake City: A case study in water development history and planning for the future
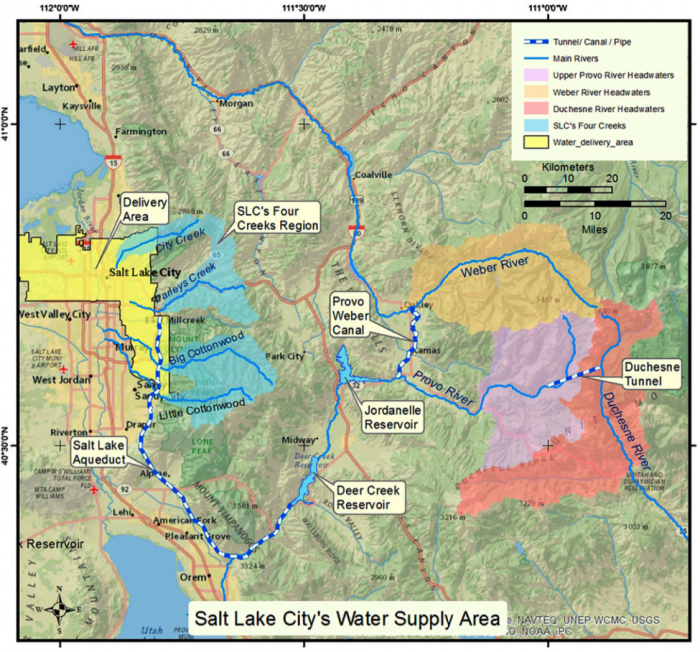
Salt Lake City (SLC) provides an interesting case study in terms of the history and future of water resource development. The first permanent settlers of Salt Lake Valley arrived in 1847 and immediately began diverting water from City Creek (northernmost of the four watersheds highlighted in blue in Figure 5). It is estimated that the early settlers hand-dug 1000 miles of ditches in the first few decades to distribute the water to agricultural fields, Salt Lake City and nearby settlements. By 1879 the population of Salt Lake County had grown to nearly 32,000 and the city authorized construction of the Jordan and Salt Lake City Canal, which was completed in 1882 with a capacity of 150 cubic feet per second, expected to provide enough water for 100,000 residents. The canal is still in use today. Several major dams were constructed as early as 1892 to 1907. Following a major water shortage in 1924, Mayor John Bowman proclaimed that ‘a city can never be greater than its water supply’ and initiated an ambitious water development program to supply reliable water for more than 400,000 residents. Several other large dams were constructed from the 1940s to as late as the 1990s to keep ahead of the rapidly growing population, but options for additional water storage via new reservoirs are now very limited.
Today Salt Lake City’s water supply is derived from several mountainous watersheds to the east of the city, in the Wasatch Front and western Uinta Mountains (Figure 5). About 50-60% of the water is derived from the four creeks just to the east of SLC (highlighted in blue), with the remaining portion delivered from the Weber, Provo, and Duchesne rivers via inter-basin transfers (tunnels, canals, and aqueducts shown as blue and white dashed lines in Figure 5) and extracted from groundwater. Around 70-80% of Salt Lake City’s water supply originates as snowmelt. Thus, the storage of water as snowpack, the timing of snowmelt, and water storage capacity within the system are all critical to ensuring reliable water supply.
Public utilities water use has remained relatively steady at 80,000 acre-feet of water per year since 1980. To put that number in perspective, imagine a tank of water an acre at its base and 80,000 feet (15 miles) tall, or the equivalent of a tank the size of Central Park in New York City flooded 100 feet deep. The fact that total public water use has remained steady over the past three decades is an impressive feat considering the population of Salt Lake County has nearly doubled from 620,000 in 1980 to nearly 1.1 million in 2014. Much of the Greater SLC area is populated by members of the Mormon religion, which has traditionally emphasized large families. More recently the size of families has decreased, but the population as a whole continues to grow.
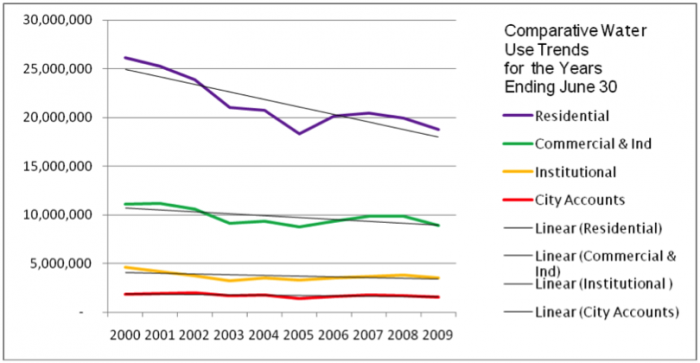
Despite a growing population, total water use has started to decline in the past decade despite the fact that this time period includes three of the hottest summers on record, due to effective public education and water conservation campaigns (Figure 6).