Lesson 2: Does the Atlantic Ocean Require a Tsunami Warning System?
Overview
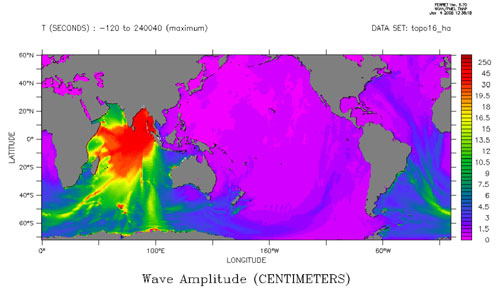
The figure below, from NOAA's Pacific Marine Environmental Laboratory, shows global maximum wave amplitudes from the tsunami caused by the great 26 December 2004 Sumatra-Andaman earthquake. In Lesson 2 we will analyze tide gauge records from this event and from the 2011 Tohoku-Oki tsunami.
The results of this analysis will inform our subsequent discussion of the potential for tsunami risk in the Atlantic Ocean. Finally, we will determine the advantages and disadvantages of developing a tsunami warning system in the Atlantic Ocean.
About Lesson 2
I first found out that the 26 December 2004 Sumatra-Andaman earthquake had happened while watching the news at my brother-in-law's house where we were visiting for Christmas. Several scientists from universities on the East Coast of the U.S. were interviewed, and more than one of them wanted to highlight the fact that the Atlantic Ocean doesn't have a dedicated tsunami warning system. They were pretty sure the Atlantic Ocean should have one. What do you think? By the end of this lesson, I want you to present your informed opinion about this. In order to make sure your opinion is an informed one, we'll examine tsunami generation, look at some data from the Sumatra-Andaman tsunami and the Tohoku-Oki tsunami and become conversant with the risks associated with tsunamis and how tsunami warning systems work.
Note:
All of the tsunami warning sign icons you will see in this lesson are from the Pacific Tsunami Museum [2]
What will we learn in Lesson 2?
By the end of Lesson 2, you should be able to:
- Describe the three types of plate boundaries, including what type of motion and stress accompanies each
- List ways tsunamis can be generated
- Calculate distance using a great circle path
- Identify high and low tides on a tide gauge record
- Identify a tsunami arrival on a tide gauge record
- Know what pieces of information are necessary in order to calculate the velocity of a tsunami from its origin to another location
- Use tide gauge data to calculate the velocity of a tsunami generated by an earthquake of known origin
- Estimate tsunami risk at a given location
What is due for Lesson 2?
As you work your way through Lesson 2, you will encounter reading assignments and hands-on exercises using authentic data. The chart below provides an overview of the requirements for Lesson 2.
Lesson 2 will take us two weeks to complete: 4 -17 Sep 2019. You should complete the reading assignments by the end of the first week to give you time for thoughtful participation in the discussions. The problem set is due at the end of the first week of the lesson, and you will submit it to a Canvas assignment. This will give you the entire second week of the lesson to participate in the discussion forum and to pull together what you've learned so you can write the paper that is the culminating assignment for this lesson.
| Requirement | Submitted for grading? | Due Date |
|---|---|---|
| Read two articles: "N.E. is not immune, scientists warn", "Cumbre Vieja Volcano -- Potential collapse and tsunami at La Palma, Canary Islands" | No | 10 Sep |
| Exercise: "Where are tsunamigenic danger zones located? | No | 10 Sep |
| Read two articles: "Learning from Natural Disasters", "Global Seismographic Network Records the Great Sumatra-Andaman Earthquake" | No | 10 Sep |
| Tsunami data problem set | Yes—Submitted to the "Tsunami data problem set" assignment in Canvas | 10 Sep (end of week 1) |
| Paper assignment | Yes—Submitted to the "Tsunami Warning System Paper" assignment in Canvas | 17 Sep (end of week 2) |
| Discussion: "Teaching and learning about tsunamis" | Yes—Posted to the "Teaching and Learning About Tsunamis" discussion in Canvas |
participation spanning 11 - 17 Sep (week 2) |
If you have any questions, please post them to our Questions? discussion (not e-mail). I will check that discussion daily to respond. While you are there, feel free to post your own responses if you, too, are able to help out a classmate.
Risk for an Atlantic Tsunami?
First, I would like you to read an article that appeared in The Boston Globe following the Sumatra-Andaman earthquake. Then, please read a short scientific paper detailing the tsunami threat from a source in the Canary Islands.
Reading Assignment: Two Articles
Daley, B. (2007, December 28). N.E. is not immune, scientists warn [3]. The Boston Globe. Retrieved April 22, 2008, from http://www.boston.com/news/world/articles/2004/12/28/ne_is_not_immune_scientists_warn/.
Ward, S., & Day, S. (2001). Cumbre Vieja Volcano -- Potential collapse and tsunami at La Palma, Canary Islands [4]. Geophysical Research Letters, 28, 397-400. (See also a press release from The Independent [5] that accompanies the scientific article.)
The first article nicely introduces the topic for this lesson, which is whether or not you think a dedicated tsunami warning system should be developed for the Atlantic Ocean. The main reason I want you to read this article is that it brings up some topics that we will want to delve into further as this lesson goes along.
When you read the first article, keep in mind the following:
- Has the Atlantic coast ever experienced a damaging tsunami?
- If so, what was the source (e.g., earthquake, volcano, landslide)?
- Do scientists have any estimates for the future risk of an Atlantic Ocean tsunami?
- Can you compare this to the risk of other natural disasters?
- The Pacific Ocean does have a tsunami warning system. What's the difference between the Atlantic and Pacific Oceans?
- How are tsunamis produced in the first place?
- How do tsunami warning systems work?
The second article is a scientific paper published in a journal. When you read this paper, keep in mind the following:
- Does it answer any technical questions you had after reading the newspaper article?
- Do you understand all the terminology? Keep a list of terms you don't know so we can discuss them.
- Who is the intended audience for this paper, compared to the first article?
- Can you give a summary of the scenario and tsunami that would result from a volcanic flank collapse such as the one detailed in this paper?
Tell us about it!
These articles do not answer all these questions, but these are the questions that I would ask if I read them without knowing anything else. What other questions do you have after reading these articles? Please post any questions to the Questions? discussion board in Canvas.
How are Tsunamis Generated?
If we are going to attempt to assess the risk of a tsunami at some particular place on the planet, we must first understand how to make a tsunami. Earthquakes and volcanoes generate the great majority of tsunamis, and the theory of plate tectonics explains the cause of earthquakes and volcanoes. So, we'll start with the world's briefest review of plate tectonics. Plate tectonics is the Grand Unifying Theory of geosciences, but it's actually not that old. In fact, my freshman advisor in college wrote the benchmark paper that outlined the mathematical model of plate tectonics, so in a sense, I'm only one "generation" removed from the pre-plate tectonics era. **Shameless plug alert**: For an in-depth look at the history of the theory of plate tectonics, take EARTH 520.
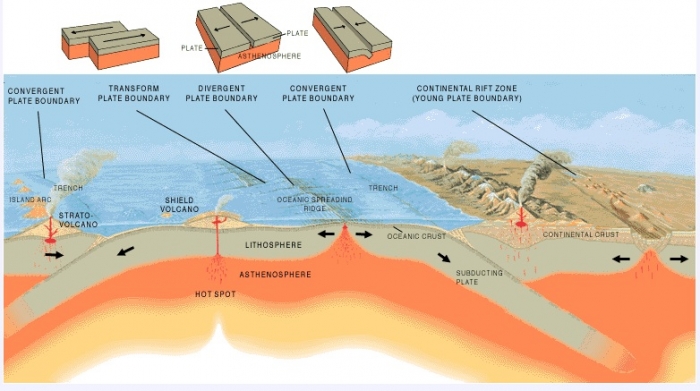
The Earth's lithosphere is broken up into a bunch of discrete pieces, called plates, that move around the surface of the planet. This motion is driven by the flow of the mantle rock beneath the plates and by the forces plates exert at their boundaries where they touch each other. There are three distinct types of plate boundaries, shown illustrated by the drawing below both as separate block diagrams as well as situated within their appropriate geologic environment.
- At transform boundaries, two plates slide past each other. The San Andreas fault in California occurs at this type of plate boundary.
- At divergent boundaries, plates move away from each other. The Mid-Atlantic Ridge is a divergent boundary.
- At convergent boundaries, plates move toward each other. The Cascadia subduction zone in the US Pacific Northwest is a convergent boundary.
Earthquakes and tsunami generation
Earthquakes happen when plates move with respect to each other because the friction and stress at the edges of plates prevent them from slipping smoothly at their boundaries. For an earthquake to generate a tsunami you need:
- Water
- Vertical motion
If an earthquake happens far away from a body of water, it probably won't disturb the water too much. Therefore, no tsunami is expected. Next, you need a vertical disturbance. Picture this: You have a bathtub full of water and a hard-backed book. If you dip the book into the bathwater spine-first and move the book back and forth longways, what do you observe? Not much, except you've ruined your book. Now if you hold the book with its flat side on the surface of the water and move the book up and down in the water, you should generate some big waves as the vertical motion you've imposed on the water column is transferred to horizontal motion as the wave travels away from the source. This is basically how a tsunami is generated.
Quiz yourself!
If "The Big One" happens on the San Andreas Fault, do we expect a large tsunami? Do we expect California to "fall into the ocean" as in the cartoon I drew? Think about why or why not based on the material you just read
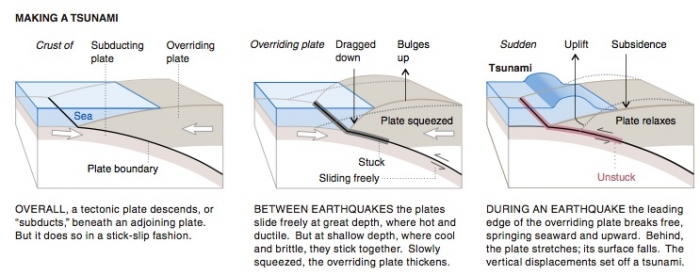
- OVERALL, a tectonic plate descends, or "subducts," beneath an adjoining plate. But it does so in a stick-slip fashion.
- BETWEEN EARTHQUAKES the plates slide freely at great depth, where hot and ductile. But at shallow depth, where cool and brittle, they stick together. Slowly squeezed, the overriding plate thickens.
- DURING AN EARTHQUAKE the leading edge of the overriding plate breaks free, springing seaward and upward. Behind, the plate stretches; its surface falls. The vertical displacements set off a tsunami.
Volcanoes and tsunami generation
Volcanic eruptions can also produce tsunamis. The rules are similar to the rules for earthquakes. In order for a volcano to produce a tsunami you need:
1. A volcano near the coast
2. An eruption that sends a large enough volume of material into the water to displace a significant volume of water.
If a large eruption sends a great volume of material into the water, it creates the vertical disturbance necessary to make a tsunami. This is one of the reasons the Cumbre Vieja volcano is worrisome: either an eruption or a landslide from a flank collapse could produce a tsunami.
Check this out!
Want to learn more about volcanoes and tsunamis? One of the earliest modern records of a devastating tsunami comes from the eruption of Krakatoa in August 1883. Read about that tsunami on the BBC News site - Krakatoa: The first modern tsunami. [7]
Where are Tsunamigenic Danger Zones Located?

Now that we know earthquakes and volcanoes are the biggest sources of tsunamis, let's find on a map of the world where these tsunamigenic danger zones are located.
Activity
Note:
You do NOT need to submit the following activity, but doing it will help you visualize where the greatest potential tsunamigenic areas are on the globe. This will aid your thinking about your culminating assignment for this lesson.
Directions
- Print out the world map below by clicking on it and printing the resulting window. This map has the three types of plate boundaries marked on it.
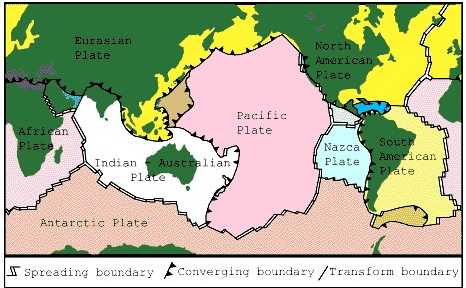 Figure 2.4 - Based on a map prepared by the U.S. Geological Survey.Credit: Oregon State University [8]
 - Remembering that water and vertical motion are the essential ingredients for tsunamis, find the convergent plate boundaries adjacent to oceans and you've found the most likely sources for tsunamigenic earthquakes. Mark these plate boundaries on your map.
- Now, look at the world map below. It has plate boundaries (black lines) and active volcanoes (red dots) plotted on it. On your map that you have printed out, mark the locations of active volcanoes near oceans. I hope you observe that these potentially tsunamigenic locations we have just found are NOT randomly distributed across the globe. In fact, the potential earthquakes and volcanoes are likely to occur near each other. This is not a coincidence. At convergent margins, one plate is forced to subduct below the other. This process is accompanied by both earthquakes and volcanism. The sticking and slipping as one plate dives into the mantle generates earthquakes. Partial melting of the lithosphere of the subducting plate and overriding plate produces a line of volcanoes inboard and roughly parallel to the subduction plate boundary.
- Observe your map and think about the following:
.gif)
- Which of the world's coastlines are most at risk for tsunamis? Does this shed light on where today's tsunami warning systems exist already?
- What tsunamigenic sources would affect the Atlantic coastlines? Where are they located?
Submitting your work
There is nothing to submit for this assignment. However, feel free to post any questions or thoughts you may have about this activity to the Questions? Discussion Board in Canvas.
A Tale of Two Tsunamis
26 December 2004 Sumatra-Andaman and 11 March 2011 Tohoku-Oki tsunamigenic earthquakes
We are going to work with some tsunami data from the 26 December 2004 Sumatra-Andaman earthquake and from the 11 March Tohoku-Oki earthquake. Before we do so, I want you to get a sense about the scientific community's study of those earthquakes, so I've picked a couple of articles that describe the techniques used to record the earthquakes and what we have learned so far.
Reading assignment
The following articles are all linked from Lesson 2 in Canvas or through the links provided.
- Hanson, B. (2005). Learning from Natural Disasters [10]. Science, 308(5725), 1125. doi: 10.1126/science.308.5725.1125.
- Park, J., Anderson, K., Aster, R., Butler, R., Lay, T., & Simpson, D. (2005). Global Seismographic Network Records the Great Sumatra-Andaman Earthquake [11]. Eos, 86(6), 57.
- Balcerak, E. (2011) Studies Provide New Insights Into Japan's March 2011 Tsunami [12], Eos, 92 (50), 467.
- Richardson, E. (2018) Lessons from the Tohoku-Oki earthquake [13], From the Prow, AGU 2018.
- Where did these earthquakes happen? What was similar and different about the tectonic setting of each one?
- How big were each of them in terms of length, area ruptured, and magnitude? In the time between these two earthquakes, were there any other earthquakes in the world about the same magnitude? Were there any other ones as destructive?
- Why did these earthquakes produce such deadly tsunamis?
- Where else on the globe are subduction zones like these two?
Check this out!
Interested in learning more? "Anatomy of a Tsunami" [14] is an interactive flash movie from Teachers' Domain and Nova Online about the Sumatra-Andaman tsunami.
Note:
"Teacher's Domain" is a free resource, but you must register with them in order to view more than 7 resources. If you like their stuff you may want to take a moment to go ahead and register with them now.
Problem Set Part 1: Analyzing Tide Gauge Records and DART Data
Tide gauge records from 2004 and DART data from 2011
In the following analysis, you'll work with tide gauge records from stations around the world that recorded the tsunami generated by the 26 December 2004 Sumatra-Andaman earthquake. Then you will work with data recorded by Pacific Ocean DART stations from the 2011 Tohoku-Oki earthquake. It is fine with me to complete this analysis in whatever way works best for you. You may all work together to do this activity or you may want to work in groups or by yourselves. No matter how you choose to go about it, please write up and submit your analyses individually and in your own words. This activity is due at the end of the first week of this lesson.
Tsunami Data Problem Set
Part 1: Checking out four tide gauges from 2004

Save the Tide Gauges Problem Set Worksheet [15] to your computer by right-clicking (control-click on a Mac) on the link above and selecting "Save link as..."
TIP!!
You should use the worksheet for writing down your answers but you should leave this web page open while you work on the problem set. WHY? Because I explain how to do most of the analysis right here. The worksheet is just so you don't have to retype the questions yourself.
Below are four record sections. These data come from tide gauges maintained by the University of Hawaii with support from NOAA. Review each record section, then answer the associated questions on your worksheet.
Record 1: Salalah, Oman
Before you begin, let's look at Salalah's record together [16]:
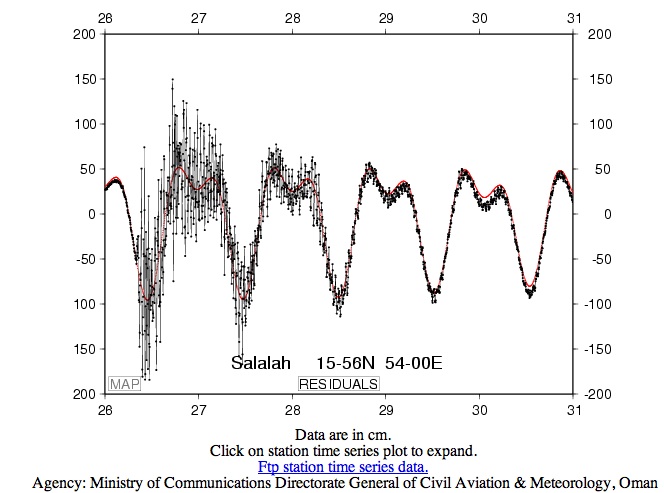
1.1 The latitude and longitude of this station are given in degrees and minutes. (i.e. 15-56 N means 15° 56' North latitude and 54-00 E means 54° 00' East longitude). Each degree contains 60 minutes. For later calculations, we will want to use decimal degrees instead of minutes. Convert the latitude and longitude of this station to decimal degrees. HINT for getting started: If the latitude were 12-13 N, meaning 12° 13' N, this would equal 12.22° because 13/60 = 0.22.
1.2 Let’s look at the axes and data now. The X-axis is showing time and the Y-axis is showing water height. The X-axis ranges from 26 to 31. These are days of December 2004. The Y-axis ranges from -200 to +200 cm. Now let's look at what is being plotted here. The black line connects data measurements shown by small black dots. The red line is a prediction of the tidal signature at this station. Okay, what are the obvious things to see here? You should be able to discern the approximate arrival time of the tsunami. When is it? Where on this record is the prediction of wave height doing a good job and where is it failing? Why does the prediction fail where it does? For about how long does the tsunami have a significant impact on the wave height at this station?
1.3 Look at the background tidal signature. Describe the tidal cycle for one 24-hour period.
1.4 What is the normal tidal amplitude? Compare this with the amplitude of the tsunami. Keep in mind that the tsunami amplitude is superimposed on top of the tidal signature.
Record 2: Ranong, Thailand
This record looks a lot different from the record at the Salalah station. This is an analog recording made with a pen connected to a cylindrical paper drum that turns continuously at a set pace. It doesn't take much perusing to see why digital data is preferred for most scientific measurements. For one thing, if somebody doesn't come along and change the paper every 24 hours, the record of each successive day prints over the record of the previous day as the tidal cycles repeat. On the other hand, I think this record looks really cool. There's something about analog records that just seem more lifelike. They aren't totally useless, either. What can we find out from inspecting this record? First, let's look at it together [17], then you can answer the questions.
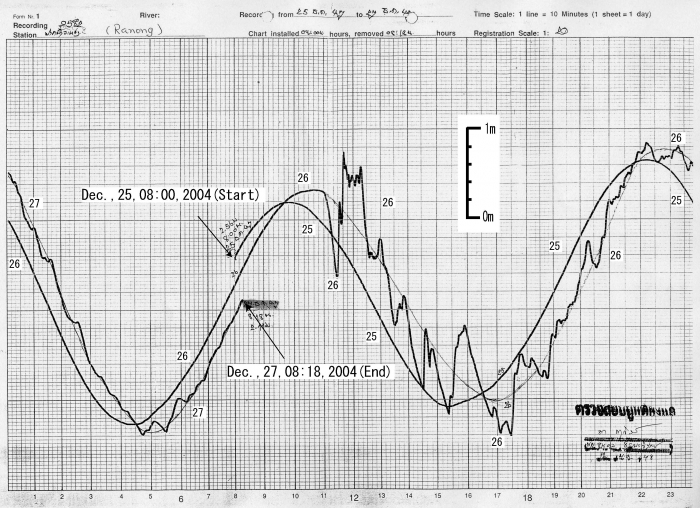
1.5 The time scale on the X-axis is given up in the right-hand corner of the record. It says "Time scale: 1 line = 10 minutes (1 sheet = 1 day)". Okay, so take a look at the grid. What do the numbers on the X-axis refer to? How many days are shown in this record?
1.6 The vertical scale is given. (It's floating in the middle of the record.) What is the normal tidal amplitude at this station?
1.7 Comment on the differences you note between the tidal cycle at this station and at the Salalah station. Comment on the differences you note between the normal tidal amplitude here and at Salalah and the differences between the tsunami amplitude at this station compared to the Salalah station. Why are there differences?
1.8 Notice that because of the fact that more than one day is shown on this record, you can see that the tidal peaks and troughs are offset slightly as the days go by. Tides do not have a period that fits exactly into one day. That is, the peak-to-peak time is not exactly 12 hours. Approximately what is the period? (If you live near the coast, or have spent any time near the ocean, you already knew that the time of the high and low tides change predictably as the days go by. Isn't it reassuring when recorded data confirms what an observant person already knows! Science works!)
1.9 When does the tsunami arrive at Ranong? What is the amplitude of the tsunami compared to the background tidal amplitude? For about how long does the tsunami affect sea level height at Ranong? Compare these answers with your observations of the records from Salalah station.
Record 3: Syowa, Antarctica
I think you should now be able to interpret this plot on your own. Try it!
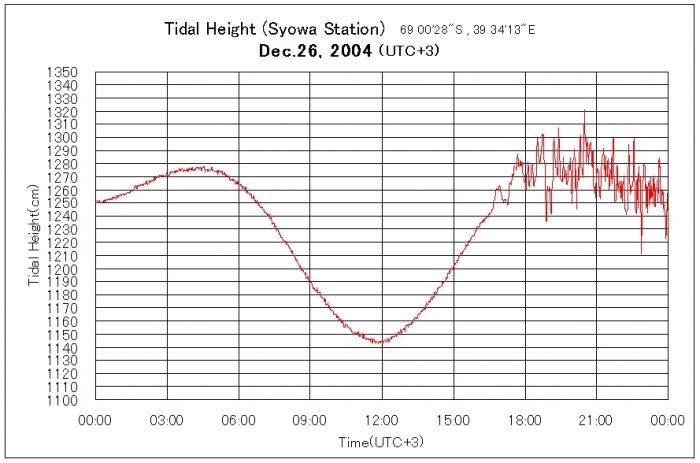
1.10 The coordinates of this station are given in degrees, minutes, and seconds. There are 60 minutes in each degree and 60 seconds in each minute. Convert the station coordinates to decimal degrees.
1.11 The local time at this station is "UTC +3". This means that this station is three hours ahead of "Universal time", which is set for historical reasons at Greenwich, England, where the longitude is zero. Find out the difference between UTC and the time in your hometown. (Your computer probably knows. Otherwise, a quick web search should accomplish this task.) Remember to cite the place where you found the answer.
1.12 What are the units of the X and Y axis on this record?
1.13 When does the tsunami arrive?
1.14 What is the tsunami amplitude compared to the normal tidal amplitude? Compare this to your observations at the previous stations.
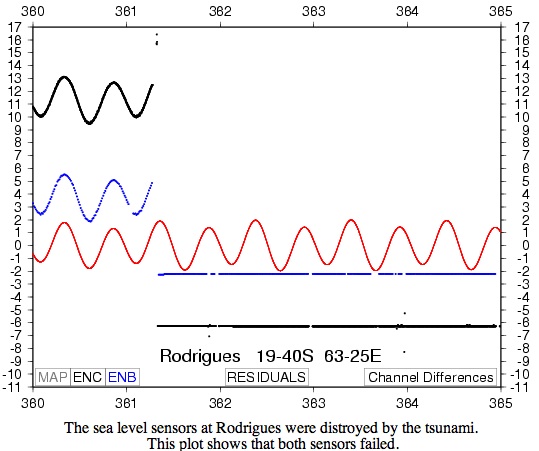
Record 4: Rodrigues Island
HMM! What is going on at this station? The red line shows the tidal prediction and the black and blue lines show data.
1.15 The latitude and longitude are given for this station in degrees and minutes. Convert to decimal degrees.
1.16 The X-axis is given in "Julian days" of 2004. Julian days are numbered consecutively from 1 to 365 (or 366 in leap years). So January 1 is Julian day 001, February 1 is Julian day 032. What is the Julian day of your birthday? Convert the values of the X-axis from Julian days to normal dates. (To get this answer, you have to recall whether 2004 was a leap year or not.)
1.17 Read the text given by the spelling-challenged station operator as part of this record section. Now, look at the data records. When does the tsunami arrive? What happens to the data at this point? Why does the red line continue uninterrupted?
Part 1 Summary
This is probably a good time to point out that data isn't always perfect. Sometimes hardware fails, as in this case. Sometimes errors and uncertainties are introduced in other ways. We will discuss measurement error and uncertainty more fully in the next part of the problem set.
You have finished Part 1 of this problem set! Proceed to Part 2 on the next page.
Problem Set Part 2: Analyzing Tide Gauge Records and DART Data
Part 2: Calculating the speed of a tsunami using DART data from 2011
On 2011/3/11 near Honshu Island, Japan (38.322°N, 142.369°E) at 5:46:23 (UTC), a magnitude 9 earthquake occurred. You will inspect the records of 13 DART stations that recorded the tsunami, use them to calculate the speed of the tsunami, plot the stations and the earthquake on a world map, and then answer a set of questions about the data and your observations. For this part of the problem set, I downloaded the freely available data and made the plots for you. Later in this class, you'll have to do the data processing yourself, but not this time. If you want to check the raw data out and see a nice map, this is where to go: 2011 Tohoku Japan DART Data [18]
Use "Part 2" of your problem set worksheet to record your work. View the DART station records for this activity [19]. You can also click on the thumbnails in the table below to see each station's data separately.
In general, you don't have to write a whole page of calculations for each station like I do in my examples, I just wanted to be thorough so you can see my procedure. On the other hand, if you don't show any work it is harder for me to give you partial credit if you make a mistake (see my grading rubric, below).
2.0 Using Google Maps, make a map of the location of both earthquakes, the tide gauge stations from Part 1, and the DART stations from Part 2. When you are done with your map, save it, make a link to it, and paste the link into your worksheet. Or you can take a screenshot of your map and insert that into your worksheet.
Video: How to Make a Map with Google Maps (3:18)
PRESENTER: So when you first get to Google Maps, it'll probably present you with a map of the place where you are, if it knows where you are. Then, if you click this little hamburger over here, and you get a menu. And one of the things you can click on is My Maps. If you've never made a map before, then you'll just get a welcome screen. If you've got something you've already made, then you will be shown a menu with those. But anyway, you can create a new map. And the easiest thing I think to do-- is to just type in the latitude and longitude of the place marker that you want to set. So why don't we put in the location of the Japanese earthquake? There. And it drops the place marker in the ocean. That's fine. So click this little plus here. And then, you want to edit this. So let's call this earthquake. We can also edit what kind of an icon it looks like. Here. And I don't know, gee, this crisis menu is a lot of fun. You can have everything from infestation, geckos, to a ninja with a throwing star, or something like that. Ooh, look, here's one that looks like a tsunami. Maybe that's going to work for us. [INAUDIBLE]. Now you're all set. Let's add another. So here we go with that close by station that we were using for all of our other examples. Drops a placemark there. And why don't we edit that? We'll call it station 21418. Great. We'll add another one just for fun. But I-- my guess is that you've figured it out now. Here is a station that is far away. And that's going to drop another place marker there. We're going to add this one. Station 32412. Save it. OK, now at the end, once you've got everything there, you might want to just zoom out and verify these things are where you think they're supposed to be. Yep, you've got an earthquake off the coast of Japan. A couple of stations. One is close by. One is not close by. At the end, you want to give your map a title. And then, click the Share button. If you forgot to give your map a title, it's going to remind you that it wants you to do that. It's just [INAUDIBLE]. And you can also get a link. And if you want me to be able to see your link without having to log into Google, you can change this so that it's public with anyone who has the link. And you can share it with grandma, too. All right. That's all.
2.1 You already worked with Julian days in Part 1. Now we are going to work with time as expressed in fractions of a day. The earthquake happened on 2011/3/11 at 5:46:23. What is the Julian day of this time, exactly, as expressed in decimal form?
Video: Julian Day (2:22)
PRESENTER: All right, so we're going to convert January 16, 2016, at nine hours, 54 minutes, and 31 seconds into Julian day. So the Julian day is 16 because we're in January. That's pretty easy. In order to convert the time, we need to know how many seconds there are in each of these parts, and then we're going to divide by the total number of seconds in the day. So what we know is that there are 60 seconds in one minute. There are 60 minutes in an hour, and there are 24 hours in a day. And that means if you multiply 60 by 60 by 24, then you can find out that there are 86,400 seconds in one day. I feel like I'm singing that song from rent. Anyway, OK, so here's what we do. We start with nine hours. And we say, all right, nine hours is nine times 3,600, which is the number of seconds in one hour, is going to give us 32,400 seconds. Then we need to convert the minutes. 54 minutes, multiply that by 60 because there are 60 seconds in a minute. And we get 3,240 seconds. And then the 31 seconds, we don't have to convert, because that's already in seconds. All right, and we're going to add up these numbers. And you get this number, 35,671 seconds. We're going to divide that by 86,400 because that's the total number of seconds in a day. All right, so divide by 86,400. And we get 0.4129. Let's do a little reality check because I like to do that when I do math. Is it possible that about nearly 10:00 in the morning, we've gone through about 40% of a 24 hour day? Yeah, that makes sense to me, because noon would be 50%, right? And we're not quite at noon yet, so this looks good. OK, so the answer here finally is that the actual day precisely is 16.4129. That's how you'd express the Julian day with decimals of this date up here.
2.2 Look at each station record and pick the arrival time of the tsunami. I have done the first one for you. Make sure you pick the arrival time of the tsunami and not the arrival time of the seismic waves. Fill in your answers in the table.
Video: Tsunami Arrival Pick (1:56)
PRESENTER: All right, can I just say, before we even start, that this is just such cool data. First of all, this station was really close to the earthquake. And it's sitting at the bottom of the ocean, and you can tell that because the y-axis here is water column height. So this thing is a pressure sensor sitting in five and a half kilometers of water-- which is pretty amazing that we can even build something that will work at five and a half kilometers down, don't you think? Anyway, so in part one, you were looking at tide gauges. And those are really cool, but they're just at the surface, so all they can do is record the height of the water. Whereas this thing, since it's a pressure sensor on the ocean floor, it can record the seismic waves themselves and the tsunami, which is really neat. So here-- the x-axis here is Julian day of 2011, and it's in these fractional parts. So that's helpful since we already know how to do that and work with those numbers. And let's look at the data itself, this wiggly line. All right, so right here is the first big excursion from nothing happening. And that is actually the seismic waves from the earthquake, not the tsunami itself, which is awesome. So the tsunami itself actually comes in right here. And I would mark it down as 70.26 as the arrival time. What's really neat is that when you look at stations that are farther and farther away in the rest of this problem set, you're going to see that the time between the earthquake arrival and the tsunami gets bigger and bigger and bigger. And that's because the seismic waves are just faster. The tsunami is pretty fast, but not as fast as seismic waves. So I don't know. I feel like if I were like a high school physics teacher and I wanted students to do those boring problems, like two trains leave the station and one is traveling at this speed and the other one's traveling at some other speed, and how far apart will they be at time x, y, and z-- well, this is that exact problem. It's just cool because it's real data. It's a real thing that happens in the Earth, you know? So check it out. You'll see it when you look at this data. It's just so neat. It's awesome.
2.3 Calculate the tsunami travel time to each station by subtracting the origin time from the arrival time. (Now aren’t you glad you converted the origin time to decimals!!). I’ve done the first one for you. Your answers will be in fractions of a day, so convert to hours. Fill in your answers in the table.
Video: Tsunami Travel Time (0:58)
PRESENTER: All right. This is how you calculate the travel time to one of your stations. We'll stick with station 21418. That's our example station. So we picked the arrival time at 70.26, so we just need to subtract the origin time of the earthquake, which we've already calculated. And here is the answer we get when we subtract these numbers, 0.0195. And remember, this is in days. But we want to convert this to hours because later, we're going to calculate the velocity of the tsunami. And we want that to be in kilometers per hour. So if we multiply by 24 hours in the day, then we can make this number be hours. And when we do that, we get 0.468. So that is the number of hours it took the tsunami to get from the earthquake to where the station is-- a little less than half an hour.
2.4 Calculate the epicenter-to-station distance along the great circle path between the two locations. We use the great circle path formula because we are calculating distance on the surface of a sphere. Here is the formula for great circle distance: cos(d) = sin(a)sin(b) + cos(a)cos(b)cos|c| in which d is the distance in degrees, a and b are the latitudes of the two points and c is the difference between the longitudes of the two points. Multiply the answer by 111.32 to get from degrees to kilometers. Jean-Paul Rodrigue, at Hofstra University, gives an excellent explanation and tutorial of how to calculate the distance along a great circle path [21]. I’ve done the first one for you. Fill in your answers in the table.
Video: Great Circle Distance (2:42)
PRESENTER: We need to calculate the distance between our earthquake and each station that recorded the tsunami. So the way to do that is to use the great circle path formula. And here is the formula. The cosine of the distance equals the following. OK. So in this formula, A is the latitude of one of our stations we'll call the latitude of the earthquake. B is the latitude of the other point here. A latitude, B latitude. And C is the difference between their longitudes. Take the absolute value of that. So you're going to take the sine of this number, the sine of this number. And then you're going to take the cosine of this number, and the cosine of this number. And you're going to subtract the longitudes from each other. It doesn't matter which, because you're going take the absolute value of that. And take the cosine of that. Multiply all the cosines together. Multiply the sines together. Add those two. And then you have to take the inverse cosine of the answer. And you look at the distance in degrees. Then you multiply by 111.32, and you'll get the distance in kilometers. Now, here are the things that I want to point out that are important. It is important that you know that when you calculate the distance between two points on the surface of a sphere, you need to use the great circle path formula. And I think it's important that you know what that formula is. And I wrote it down right here. But this class is not really meant to be about calculator skills. So if you can automate this in a spreadsheet program or whatever, or you know of a website that will calculate it for you, then that's what you should use, because it will actually minimize the errors of you typing stuff in. I've found a good website that works. And this is it. I've given you the link to this in the course web pages. But you need to be smart about using websites, just like you would if you were looking up information on a website. And that is, you should do a couple of problems yourself, and trust your own math, and then check if the website gives you the same answer or not. And I have checked with this one. So here, I've entered the latitude and longitude of the earthquake, and the latitude and longitude of our station, and it gives me the distance. It is important, when you use a website like this one, that if you have points that are in west longitude, or south latitude, that you enter them in here as negative numbers, or else you won't get the right answer. But I wrote all those down correctly for you in your table of values, so hopefully, that won't trip you up. All right, that's all there is to it.
A nice website that will calculate great circle distance for you [22].
2.5 Calculate the tsunami speed. To get the speed, you use the formula speed = distance/time. I’ve done the first one for you. Fill in your answers in the table.
Video: Tsunami Speed (2:03)
PRESENTER: All right, we are going to calculate the velocity of a tsunami now. So all we need is to know the formula distance equals rate times time. We just rearranged it, so that rate is over here by itself. Which means we are going to divide distance by time. Well, that's fine, because we already know those, right? We know that the distance is 551.9 kilometers, and we know that the time is 0.468 hours. So this gives us a velocity of 1,179 kilometers per hour. Wow, now I don't know if you have any intuition about how fast a tsunami goes in the open ocean. It's really fast, but it's not quite as fast as this. Wow, so where did we go wrong? Nothing about our method is wrong, but this is a good time to talk about uncertainty. This station is really close to the earthquake, and let's just imagine a thought experiment here where you've got a station that takes a data sample every 15 minutes, OK? But let's say that the tsunami only takes 45 minutes to get to that station. Well, being uncertain plus or minus 15 minutes out of 45 minutes is huge. It's a big uncertainty compared to the measurement you're making, right? Let's say that you've got a station that takes it every 15 minutes, and the tsunami takes eight hours to get there. Well, 15 minutes out of eight hours is not nearly as big of a deal, right? So the absolute value of your uncertainty can matter a lot more, depending on its relationship to the real size of the measurement you're making. And that is a really, really important concept in any branch of science, so just think about that, OK? But anyway, look, this is real data. This is real life. It has uncertainties, and that's OK. It doesn't fit neatly into multiple-choice tests designed by bureaucrats, but that's OK. That's the way it is.
| station | station lat (ºN) | station lon (ºE) | tsunami arrival time (Jday) | tsunami travel time (hr) | earthquake to station distance (km) | tsunami velocity (km/hr) |
|---|---|---|---|---|---|---|
21418 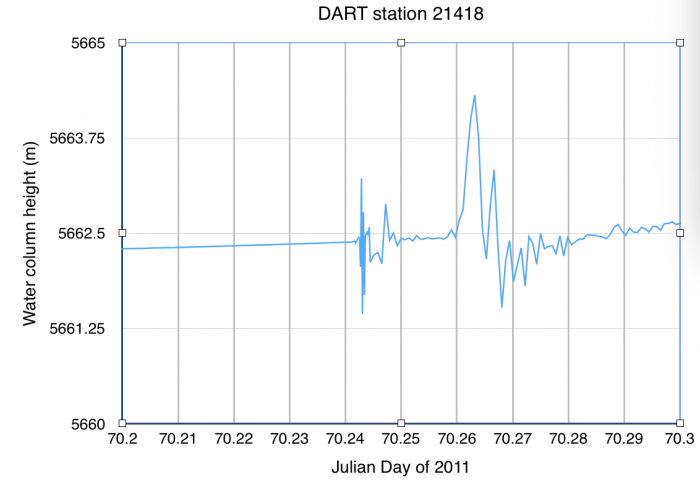 [23] [23] |
38.7110 |
148.6940 |
70.26 | 0.468 | 551.9 | 1179 |
21413  [24] [24] |
30.5150 |
152.1170 |
||||
21415 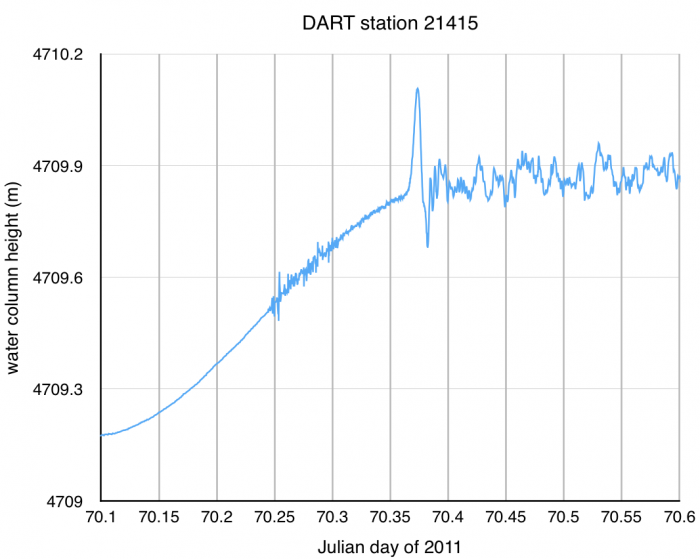 [25] [25] |
50.1762 |
171.8486 |
||||
52402 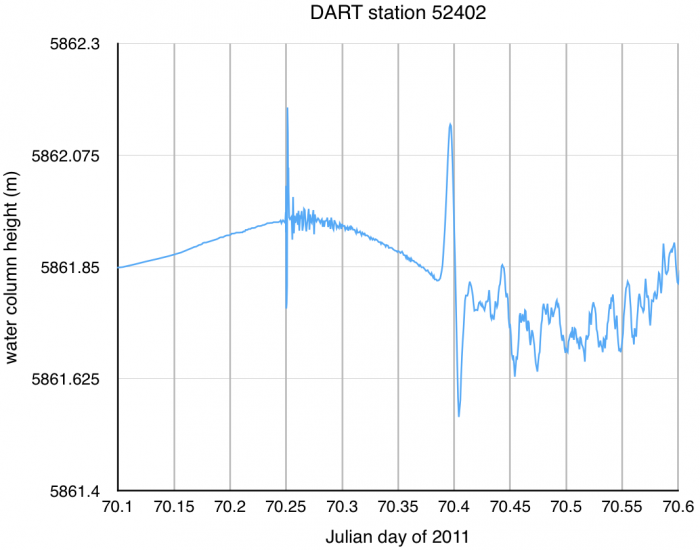 [26] [26] |
11.8830 |
154.1100 |
||||
46402 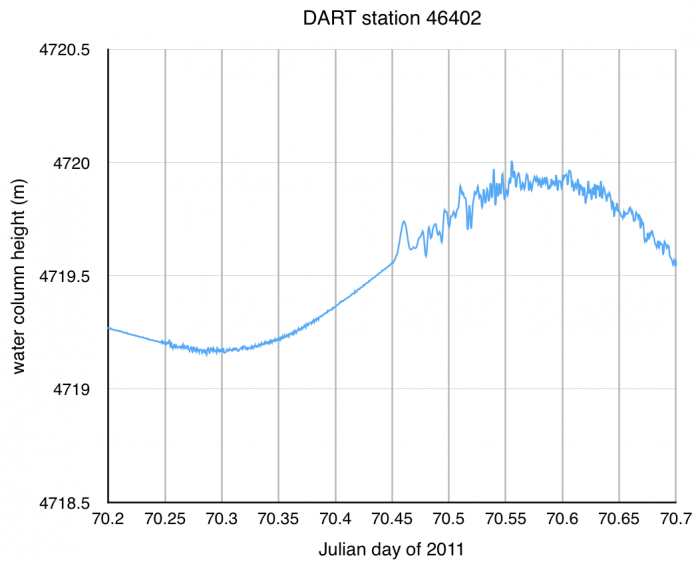 [27] [27] |
51.0683 |
-164.0053 |
||||
51407 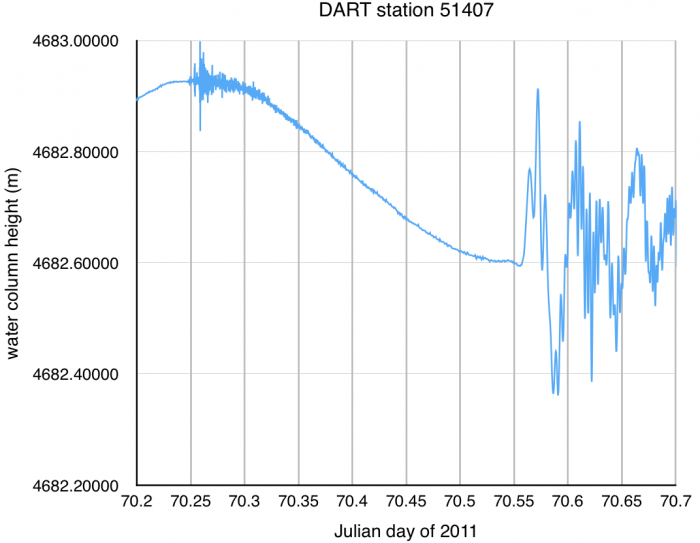 [28] [28] |
19.6169 |
-156.5106 |
||||
51425  [29] [29] |
-9.5044 |
-176.2297 |
||||
46411 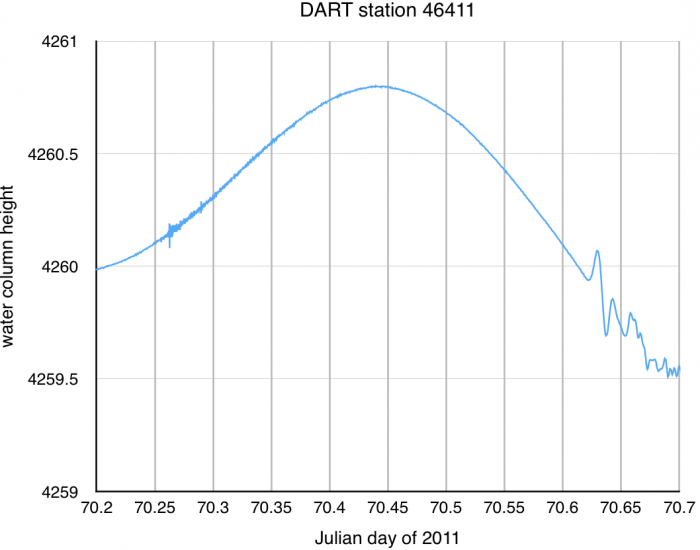 [30] [30] |
39.3238 |
-126.9910 |
||||
51426 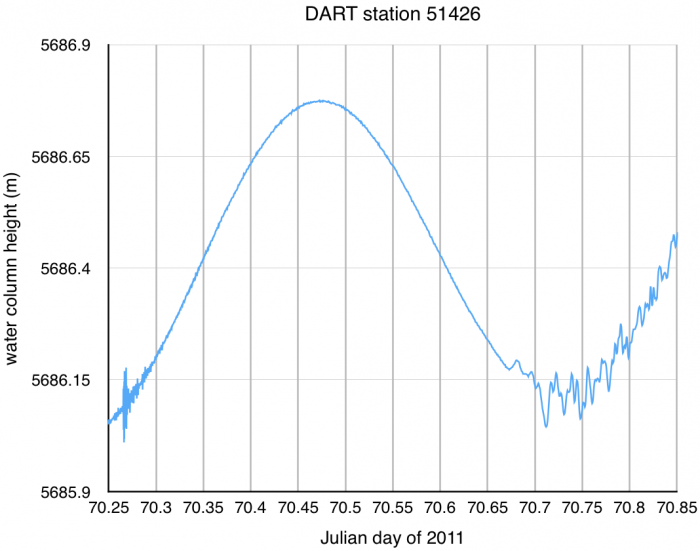 [31] [31] |
-22.9911 |
-168.1031 |
||||
51406  [32] [32] |
-8.4800 |
-125.0270 |
||||
43413 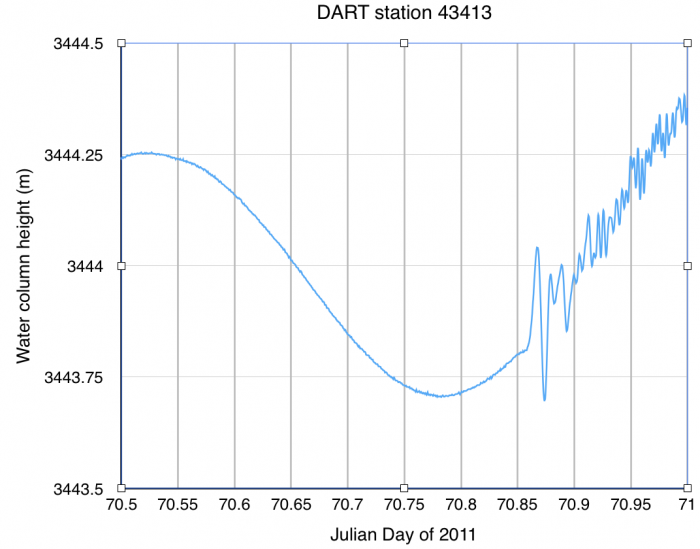 [33] [33] |
10.8372 |
-100.0842 |
||||
32413 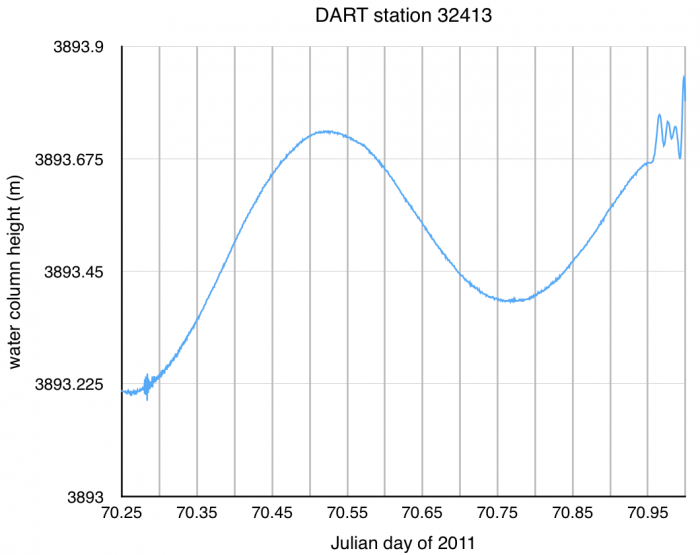 [34] [34] |
7.4003 |
-93.4989 |
||||
32412 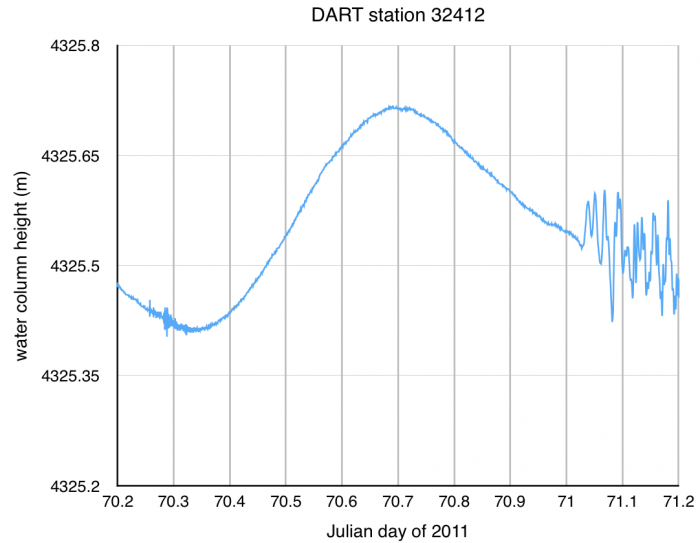 [35] [35] |
-17.9865 |
-86.3887 |
2.6 I want you to think about the uncertainties in the calculations you performed in determining tsunami velocity. One obvious source of uncertainty is measurement precision at each tide gauge station. For example, let’s say that you are working with a DART station that takes a measurement every 15 minutes. This means that picking the arrival time of the tsunami can't be more precise than this. Go back and change the arrival time pick for Station 21418 and for Station 32412 each by 15 minutes. Now recalculate the speed of the tsunami for each of those two stations. How much has your answer changed for each one? Which one is affected more by the uncertainty in arrival time and why?
2.7 What are some other sources of uncertainty in these calculations?
2.8 Calculate the mean speed for the tsunami. Are you surprised by this speed? How does this speed compare to a jet airplane? an Indy car? a bullet fired from a gun? an earthquake P wave? a major league fastball? Pick several items that interest you (they don't have to be any of the examples above if you don't like those) and compare them to the speed of the tsunami.
2.9 Tsunami speed is controlled by water depth. In fact tsunami speed equals the square root of the product of water depth and g, the gravitational constant (9.8 m/s2). Calculate the mean water depth of the Pacific Ocean. To do this, use the mean speed of the tsunami that you calculated in 2.8, convert it from km/hr to m/s, then plug into the equation speed=sqrt(depth*g).
2.10 I want you to think about approaching the question of tsunami speed from a different perspective. What if you wanted to determine how fast a hypothetical tsunami could get from point A to point B? List what would you need to know to make this calculation.
2.11 Now try it! Let's say a large earthquake happens in the Pacific Northwest, approximately at the location of Seattle, generating a tsunami. Determine how long it would take the tsunami to arrive in Hilo, Hawaii.
2.12 What are the sources of uncertainty in the calculation you just did in the previous question?
2.13 There are definitely tide gauge stations on the west coast of Japan and they recorded the tsunami as well. However, we did not use any data from those stations to calculate the speed of the tsunami or to calculate the mean water depth between the earthquake and those stations. Why not? (In order to answer this question you will need to look at the map you made and think about what assumptions we made to do our calculations.)
Submitting your work
Save your worksheet as a Microsoft Word, PDF, or Pages file in the following format:
L2_TsunamiData_AccessAccountID_LastName.doc (or .pdf or .pages).
For example, Cardinals' shortstop Jhonny Peralta's file would be named "L2_TsunamiData_jap27_peralta.doc"
Upload your worksheet to the Tsunami Data problem set assignment in Canvas by the due date on the first page of this lesson.
Grading rubric
I will use my general grading rubric for problem sets [36] when I grade this activity.
Tsunami Risk and Hazard Mitigation
So far we've talked about the physics of tsunamis and you have investigated tsunami data and made some calculations about tsunami speeds. What's the current state of the art in terms of tsunami risk and hazard mitigation? Where are some other sites in the Atlantic Ocean where tsunamigenic potential lurks?
Readings relevant to the paper assignment
The following readings are either freely available online if they are linked from this page, or if they are not in the public domain then they are linked from Canvas. You should at least skim these articles because they deal with potential Atlantic Ocean tsunamigenic sites.
- Nealon, J. W., & Dillon, W. P. (2001, April). Earthquakes and Tsunamis in Puerto Rico and the U.S. Virgin Islands [37]. U.S. Geological Society. Retrieved June 2, 2008, from http://pubs.usgs.gov/fs/fs141-00/fs141-00.pdf.
- Teeuw, R., Rust, D., Solana, C., & Dewdney, C. (2009). Large Coastal Landslides and Tsunami Hazard in the Caribbean. Eos, 90 (10), 81-82.
- Driscoll, N. W., Weissel, J. K., & Goff, J. A. (2000). Potential for large-scale submarine slope failure and tsunami generation along the U.S. mid-Atlantic Coast. Geology, 28(5), 407-410.
- Gisler, G., Weaver, R., & Gittings, M. (2006). Sage calculations of the tsunami threat from La Palma [38]. Science of Tsunami Hazards, 24(4), 288-301.
- Pérez-Torrado, F. J., Paris, R., Cabrera, M. C., Schneider, J., Wassmer, P., Carracedo, J., et al. (2006). Tsunami deposits related to flank collapse in oceanic volcanoes: The Agaete Valley evidence, Gran Canaria, Canary Islands. Marine Geology, 227(1-2), 135-149.
- Wendell, J.(2015). Mysterious boulders suggest ancient 800-foot-tall tsunami [39].Eos, 96,doi:10.1029/2015EO036845. Published on 2 October 2015.
The following readings will help you become conversant with the way tsunami warning systems work, and what has been done since the 2004 Sumatra-Andaman tsunami:
- Pacific Tsunami Warning Center History [40]
National Weather Service, Pacific Tsunami Warning Center.
Accessed: 2010-09-13. - Pacific Tsunami Warning Center Responsibilities [41]
National Weather Service, Pacific Tsunami Warning Center.
Accessed: 2010-09-13. - Tsunami-Forecasting System Tested by Recent Subduction-Zone Earthquakes [42]
Geist, Eric, Titov, Vasily, Kelly, Annabel, and Gibbons, Helen. USGS, Sound Waves.
Accessed: 2008-03-12. - Gower, J., & Gonzalez, F. (2006). U.S. warning system detected the Sumatra tsunami. Eos, 87(10), 105, 108.
- Tracking Tsunamis [43] (2009) AGU video
- Schiermeier, Q. (2009). Tsunami Watch. Nature, 462, 968-969.
Paper Assignment
Should the nations surrounding the Atlantic Ocean cooperate to form a tsunami warning system for the Atlantic Ocean?
Your final task for this lesson is to write a paper. This assignment is due at the end of this lesson. The "Additional Resources" page for this lesson contains some links to articles and Web sites that you may find helpful. You are in no way limited to those resources, however.

Directions
PDF Download of Directions [44]
Write a paper that defends or attacks the following statement: The nations surrounding the Atlantic Ocean should cooperate to form a tsunami warning system for the Atlantic Ocean.
The successful paper should meet the following criteria:
- This paper should be approximately 1500 words in length.
- At least one potentially tsunamigenic site in the Atlantic Ocean should be identified.
- You need to calculate an estimate -- not just a quote, an estimate from another source -- for how long it would take a tsunami to travel from this site to several major coastal cities.
- You should find at least one source that estimates the likelihood of a tsunami being generated at this site.
- No need to debate or guess about politics among countries. Just imagine that you are a disinterested scientist make a recommendation. Whether or not you can foresee cooperation among countries in terms of constructing a tsunami warning system is not something you need to speculate about.
- Include a brief summary of the history and responsibilities of, as well as the technology employed by the various tsunami warning programs that already exist.
- Background information about how tsunamis are generated should be included.
- All sources must be cited. This includes any borrowed figures. Please follow the citation convention discussed on our course syllabus (see the Course Policies section).
- Save your paper as either a Microsoft Word, Macintosh Pages or PDF file in the following format: L2_paper_AccessAccountID_LastName.doc (or .pages or .pdf). For example, Cardinal catcher Yadier Molina's file would be named "L2_paper_ybm1_molina.doc"
I expect your essay to be well organized and coherent, with a thesis statement at the beginning of the essay; topic statements at the beginning of every paragraph; smooth transitions between paragraphs and ideas; few or no grammatical and spelling errors; and properly cited, detailed explanations of the results of scientific studies to back up every assertion you make.
As the reader, I should both understand what you are talking about and be convinced that you have made a strong argument for your case. It should be clear to me that you understand the significance of the results of all the scientific studies you refer to in your paper (including your own). See grading rubric below for more details. Your grade will be dependent upon all of these elements. Content and organization are the most important elements, but if your grammatical/syntax errors are significant enough to distract me from the content of your argument, then this will affect your grade. Make sure you read the assignment carefully and understand it before you begin.
Submitting your work
Upload your paper to the "Tsunami Warning System Paper" assignment in Canvas. The due date for this paper is given in the assignment table on the first page of this lesson.
Grading rubric
- An "A" paper is well organized and coherent, with a thesis statement at the beginning of the essay, topic statements at the beginning of every paragraph, smooth transitions between paragraphs and ideas, no or few grammatical errors, and meets the assignment's length requirement. Additionally, an "A" paper includes several detailed examples that clearly explain the results of other scientists' work on the topic, as well as examples from your own work on the topic. Any included figures have appropriate captions, legends, and axes, and they support the arguments made in the paper.
- A "B" paper is like that of an "A" paper except that it may refer to scientific studies to back up most but not all of its assertions OR its assertions may only rely on the work of others and not on your own work. Additionally, a "B" paper may be an "A" paper content-wise, but it has minor grammatical errors or minor organizational problems. A "B" paper meets the length requirement.
- A "C" paper may have organization, coherence, or grammatical problems that hinder a smooth reading of the paper, but not to the extent that the paper is incomprehensible. A "C" paper may also not meet the assignment length requirement. NOTE ON ASSIGNMENT LENGTH: Papers that significantly deviate from the length assignment by being too short (half as long as the assignment length requirement or less) OR too long (twice as long as the assignment length requirement or more) will receive a "C." A paper that has excellent organization and content, but fails to address the topic of the assignment will receive a "C."
- A "D" paper has severe organizational, coherence, or grammatical problems so that the reader has trouble comprehending what is being communicated. A "D" paper may significantly deviate from the length requirement. A paper that does not refer to the results of any specific scientific studies at all will receive a "D" no matter how well-written it is or how good its argument is.
ANOTHER OPTION
If you cringe and procrastinate at the thought of writing a paper, then you may submit this assignment in the following way instead. You may use the Prezi program to create an interesting presentation of your persuasive essay. Prezi [45] is a free web tool.
The Prezi website explains how to use their tool so I won't try to do it for them.
If you choose this option:
- You must adhere to all the same criteria as for the paper that I listed at the top of this page
- Your choice of presentation style will not affect your grade (i.e. you won't get extra points for using Prezi, nor will you lose points)
Teaching and Learning About Tsunamis
Let's take some time to reflect on what we've covered in this lesson!
Teaching/Learning Discussion
For this activity, I want you to reflect on what we've covered in this lesson and to consider how you might adapt these materials to your own classroom. Since this is a discussion activity, you will need to enter the discussion forum more than once in order to read and respond to others' postings. The discussion will take place during the second week of this lesson.
Submitting your work
- Enter the "Teaching and Learning About Tsunamis" discussion forum in Canvas.
- Post your ideas for how the materials we covered in this lesson might be adapted for your own classroom.
- I would also like to see some discussion of what you thought were the major science concepts/science skills presented in this lesson. That will help me find out if you got what I wanted you to get out of the lesson. I mean, I am trying to model good teaching skills here so you can tell me if that's working or not!
- Read postings by other EARTH 501 students.
- Respond to at least one other posting by asking for clarification, asking a follow-up question, expanding on what has already been said, etc.
Grading criteria
You will be graded on the quality of your participation. Please see the rubric for teaching/learning discussions. [46]
Additional Resources and Bibliography
Resources on the web:
Various Web site with links to resources about tsunamis aimed at teachers and students:
- NOAA - Tsunami Resources for Teachers [47]
- O.H. Hinsdale Wave Research Laboratory Outreach Program [48]
Links to other Web sites
- FEMA - Tsunami [49]
- NOAA - Pacific Tsunami Warning Center [50]
- Australian Spaceguard Survey: Tsunami from Asteroid/Comet Impacts [51]
- Savage Earth Animation: Tsunami Attack [52]
- NOAA animation of the DART system [53]
- NOAA animation of the DART II system [54]
Be sure to check this out:
A short video about the 1964 Good Friday earthquake in Alaska and the tsunami it generated. This video was produced by students in my 2011 PSU freshman seminar on historic great earthquakes.
Publications
Other papers and articles of interest
- Lay, T., Kanamori, H., Ammon, C. J., Nettles, M., Ward, S. N., Aster, R. C., et al. (2005). The great Sumatra-Andaman earthquake of 26 December 2004. Science, 308(5725), 1127-1133.
- Berardelli, P. (2009). Catching a Giant Wave. ScienceNOW (727:2) [56].
- BBC News: Science and Technology (2004) Expert slams wave threat inertia [57].
Bibliography
Atwater et al., 2005, The Orphan Tsunami of 1700—Japanese Clues to a Parent Earthquake in North America, USGS Professional Paper 1707
Tell us about it!
Have another Web site on this topic that you have found useful? Share it in our Questions discussion forum in Canvas!
Summary and Final Tasks
In this lesson, you studied the catastrophic effects of a tsunamigenic earthquake and evaluated the potential risks posed by tsunamis in other parts of the world. One of the obstacles faced by those who make a living trying to assess risk and mitigate the hazards posed by geologic activity is that the timescale in between potential disasters in a specific location (e.g., large earthquakes or volcanic eruptions) is often too long for humans to have accurate statistical measurements of how often it might happen. This makes reconciling the cost of preparedness with scientific accuracy a little tricky. In the next lesson, we'll study this problem in a place that is potentially hazardous for earthquakes.
Reminder - Review the Lesson 2 Overview
You have reached the end of Lesson 2! Double-check the list of requirements on the Lesson 2 Overview page to make sure you have completed all of the activities listed there.