Ok, so far you know a bit about hypoxia and dead zones on the basis of your exploration of Chesapeake Bay. In this section, we will explore the Gulf of Mexico "dead zone" a bit more, with a short activity to follow. NOAA has its own website dedicated to monitoring Gulf of Mexico hypoxia. Head to NOAA and peruse the linked documents and maps. Here's a website (NASA ocean color) that shows satellite imagery of some representative zones with a bit of explanation. And this NOAA website has an interesting historical focus and research plan, including "Public Comments" regarding policy issues (check them out--the public comment period closed in 1999, but some very interesting debate there). If you look these over carefully, you should be able to go to Activity 2. You will now be quite an authority on "dead zones."
Review
Spreading Dead Zones and Consequences for Marine Ecosystems
Robert J. Diaz1* and Rutger Rosenberg2
Science 15 August 2008:
Vol. 321. no. 5891, pp. 926 - 929
DOI: 10.1126/science.1156401
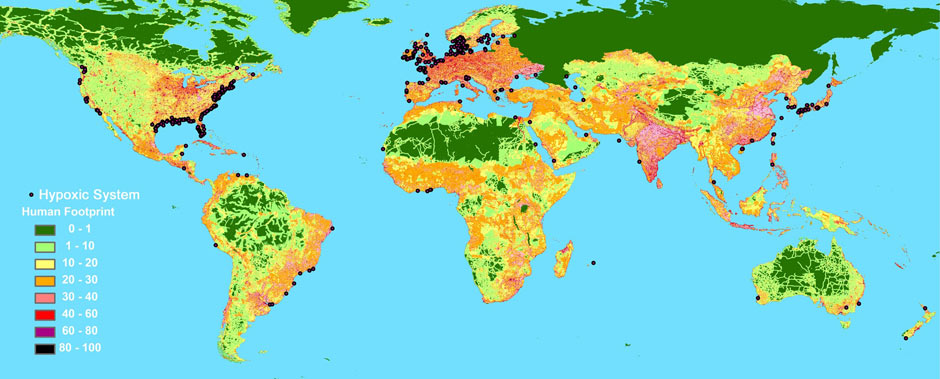
Dead zones in the coastal oceans have spread exponentially since the 1960s and have serious consequences for ecosystem functioning. The formation of dead zones has been exacerbated by the increase in primary production and consequent worldwide coastal eutrophication fueled by river in runoff of fertilizers and the burning of fossil fuels. Enhanced primary production results in an accumulation of particulate organic matter, which encourages microbial activity and the consumption of dissolved oxygen in bottom waters. Deadzones have now been reported from more than 400 systems, affecting a total area of more than 245,000 square kilometers, and are probably a key stressor on marine ecosystems.
1 Virginia Institute of Marine Science, College of William and Mary, Gloucester Point, VA 23062, USA.
2 Department of Marine Ecology, University of Gothenburg, Kristineberg 566, 450 34 Fiskebckskil, Sweden.
Reading
This scientific paper, published in 2008 by Vaquer-Sunyer and Duarte in PNAS, suggests that the severity of hypoxia controls diversity of benthic marine organisms and that there are different thresholds for different groups (like we showed in the slideshow for CB at the beginning of this lesson). After reading this short but pithy paper, take on Activity 2.
Activity 2: Reading the Scientific Literature
Activity 2 should be submitted to the DropBox on Canvas
See the grading rubric for specifics on how this assignment will be graded.
- You have read this PNAS paper. In your own words, summarize the principal points they made and their significance. Do this in less than 100 words.
- Next, answer the following questions
- What do the "L50" parameters mean and what is the "threshold" for low oxygen tolerance?
- Which organisms are most susceptible to oxygen deficiencies? Least?
- What strategies can different organisms use to cope with oxygen deficiency? Does this influence their susceptibility as listed in question #2?
- Provide a paragraph that briefly compares and contrasts the causes and effects of hypoxia in Chesapeake Bay with that in the Gulf of Mexico "dead zone."