
In order to prepare for the assignment of this lesson, let’s go back to the EIA website to create some graphs and see how we can glean information from interpreting the data.
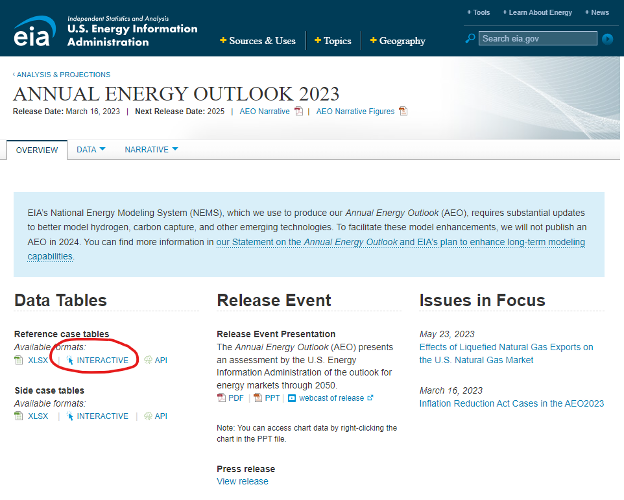
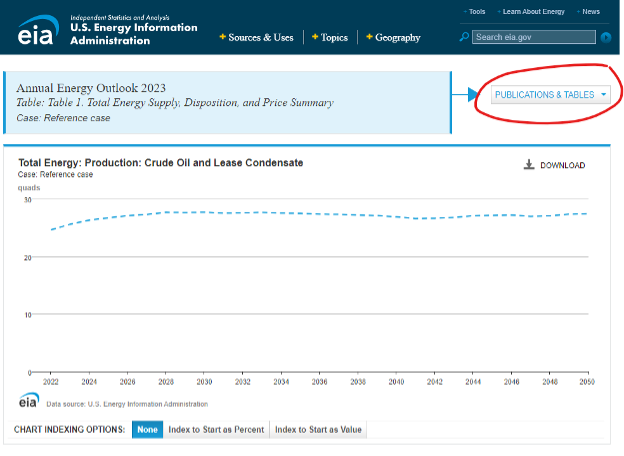
Under “Data Tables” in the subsection titled “reference case tables” click on Interactive (highlighted with a red circle in the image above). The page opens to Table 1 from the Annual Energy Outlook 2023. On the top line to the right of the table title, there is a drop-down menu called “Publications and Tables” with numerous options to choose from.
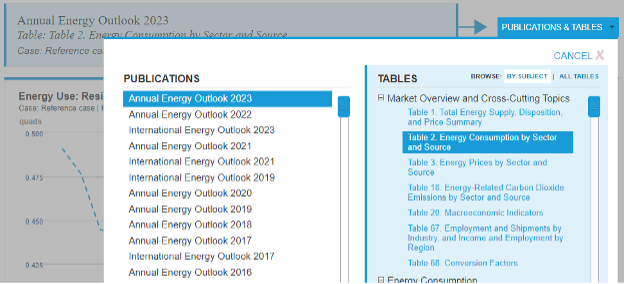
For the first example, I chose Annual Energy Outlook 2023 as the publication, and Table 2.
Below the graph, you will see a table with a column called PIN. Here we see the usage sectors (residential, commercial, industrial, transportation, etc.) and, underneath each of those, you will see the fuel type. Click on the light blue icon to the right of your desired entry or entries in the PIN column to plot those specific items above in the graph. It will superimpose as many as you choose.
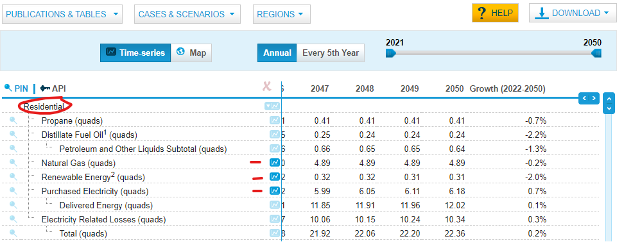
I chose to plot electricity, renewable energy consumption and natural gas consumption in the residential sector. I clicked on the three items and we see them plotted. You can now use this information to draw some immediate conclusions. For example, we see that renewable energy use in the residential sector stays very low, and declines slightly, over time. Natural gas usage is much higher, but it also declines slightly. Electricity demand, on the other hand, is the highest in terms of projected use, and actually increases over time.
Why is that? You would look into the rest of the report, especially the sections on those sectors and sources, to see why. Could it be that the shift of natural gas prices is making it less attractive? Is fracking projected to be banned at some point? Why is renewable such a small percentage and actually declining? To answer such questions, you will need to drill into the outlook a bit.
Feel free to go back to the landing page for the 2023 Outlook and click on the “Narrative” drop down to learn more about what is driving the trends and usage you have plotted. The overall point is that, by navigating the various parts of the Outlook, there is a wealth of information which can be gleaned from the narratives and data.