One-way ANOVA
ANOVA (short for "Analysis of Variance"; more on that later) allows one to compare means across multiple groups. Here, we will just focus on one-way ANOVA, where we compare means across more than two categories of a single categorical variable. Recall that in Lesson 5 we did a comparison of means (difference of means hypothesis testing). Well, ANOVA essentially expands that comparison to more than two groups or categories so that you can efficiently see if there is a significant difference of means across many groups in just one test. Thus, it is similar to a chi-square test, except ANOVA looks at means whereas chi-square testing looks at proportions.
| Hypothesis for a One-Way Chi-square Test are: | Hypothesis for a One-Way ANOVA Test are: |
|---|---|
| Ho: Defines proportions, , for all categories | Ho: All population means, are equal for all categories |
| Ha: At least one is not as specified | Ha: At least one is not equal to the others |
Another way of stating the null and alternative hypotheses for one-way ANOVA is:
Since chi-square tests look at proportions, they are suited for a categorical variable, which would then be summarized by a frequency table.
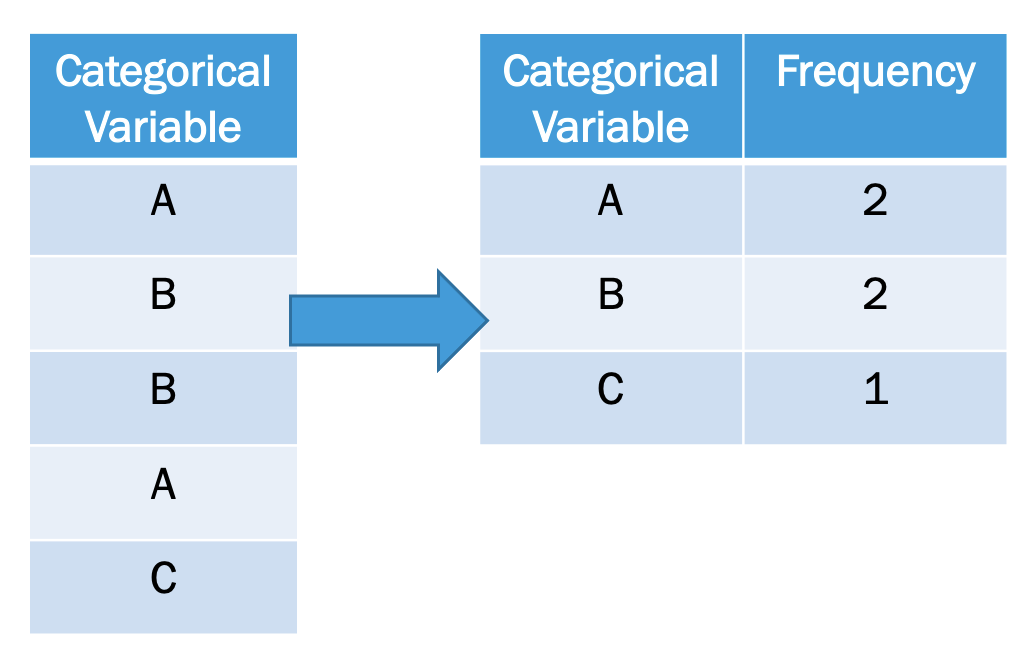
| Categorical Variable |
|---|
| A |
| B |
| B |
| A |
| C |
| Categorical Variable | Frequency |
|---|---|
| A | 2 |
| B | 2 |
| C | 1 |
On the other hand, ANOVA examines means and so is meant for a quantitative variable, which can be summarized into grouped sample means.
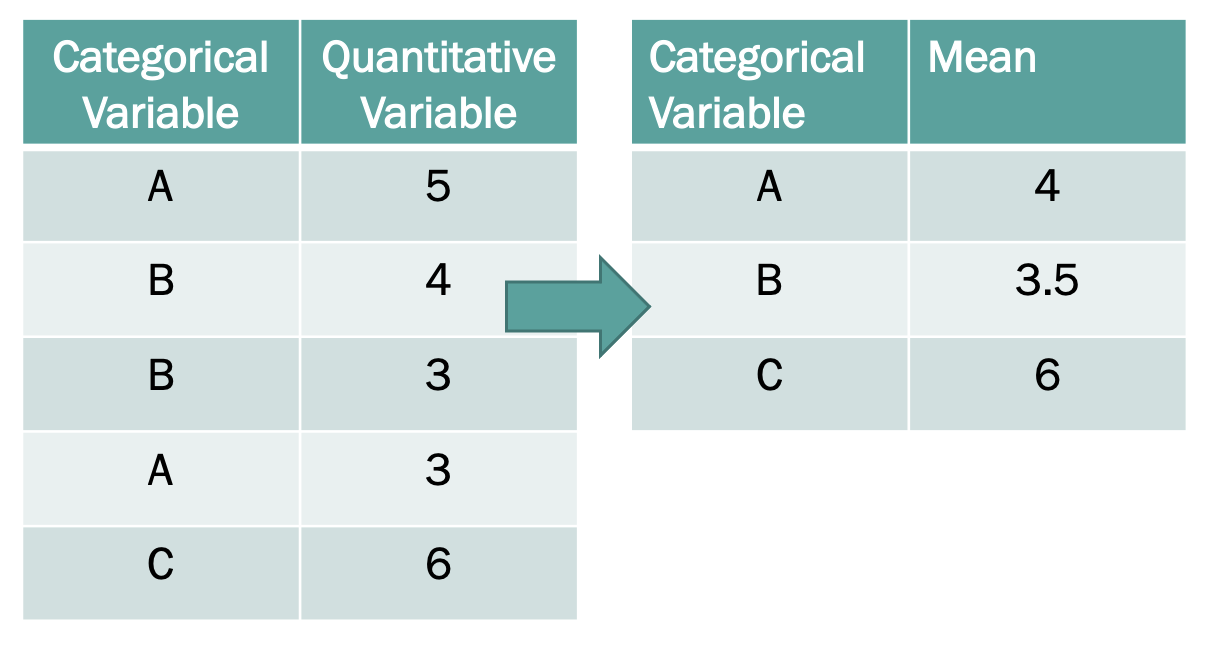
| Categorical Variable | Quantitative Variable |
|---|---|
| A | 5 |
| B | 4 |
| B | 3 |
| A | 3 |
| C | 6 |
| Categorical Variable | Mean |
|---|---|
| A | 4 |
| B | 3.5 |
| C | 6 |
Analysis of Variance
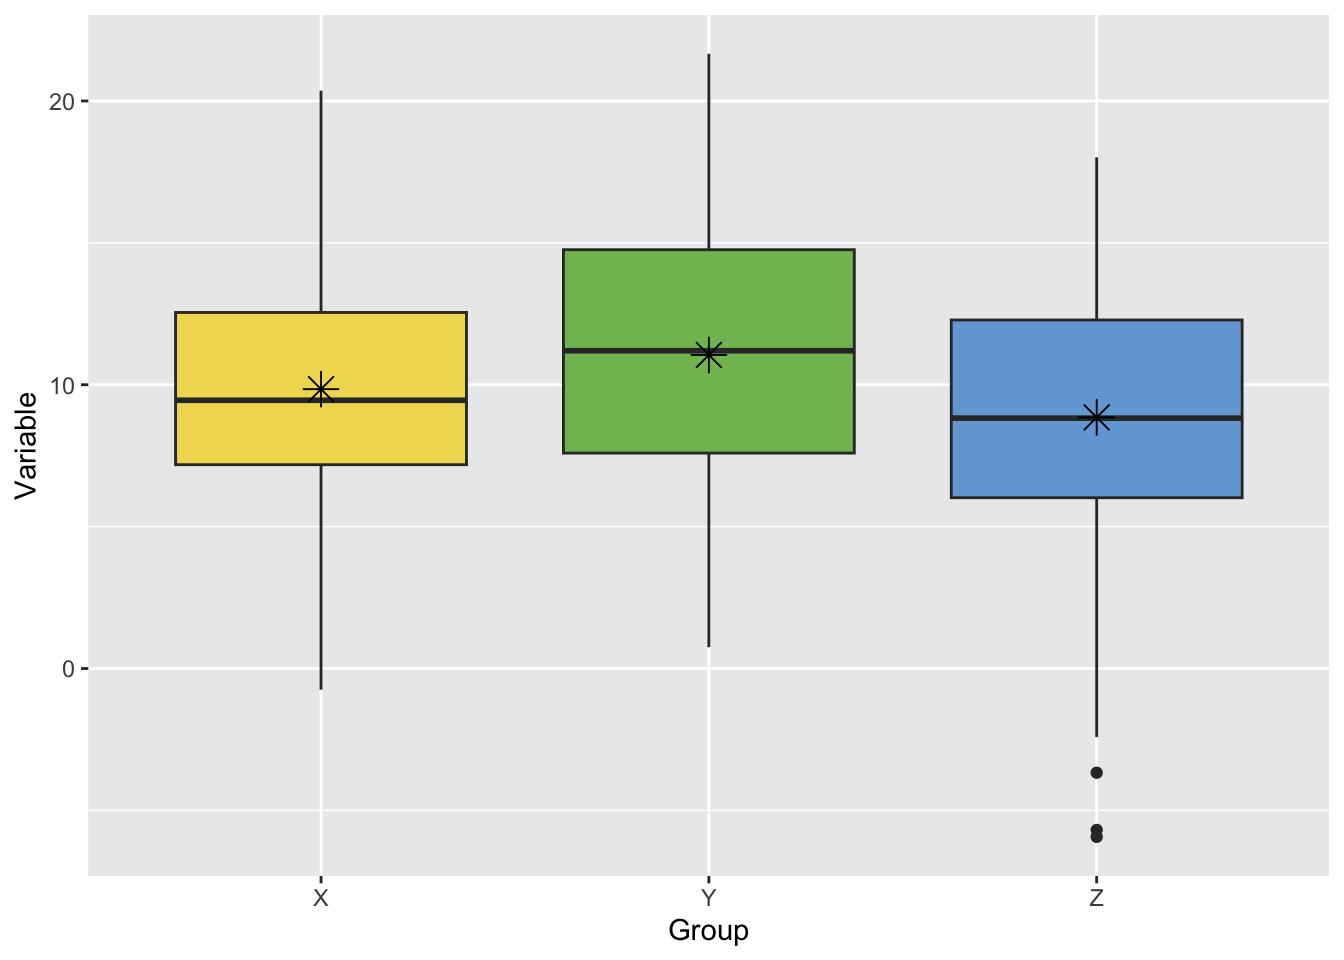
The key question that ANOVA answers is: “Are the differences in the mean values significantly different?” Most likely, the sample means from each group do not agree exactly. So, how much disagreement in the sample means is needed to say that there is difference in the population means?
This is exemplified in the figure below, where one may be able to tell that the sample means (represented by asterisks) are different, but it’s hard to tell whether these differences matter much because the samples themselves (the boxplots) overlap so much.
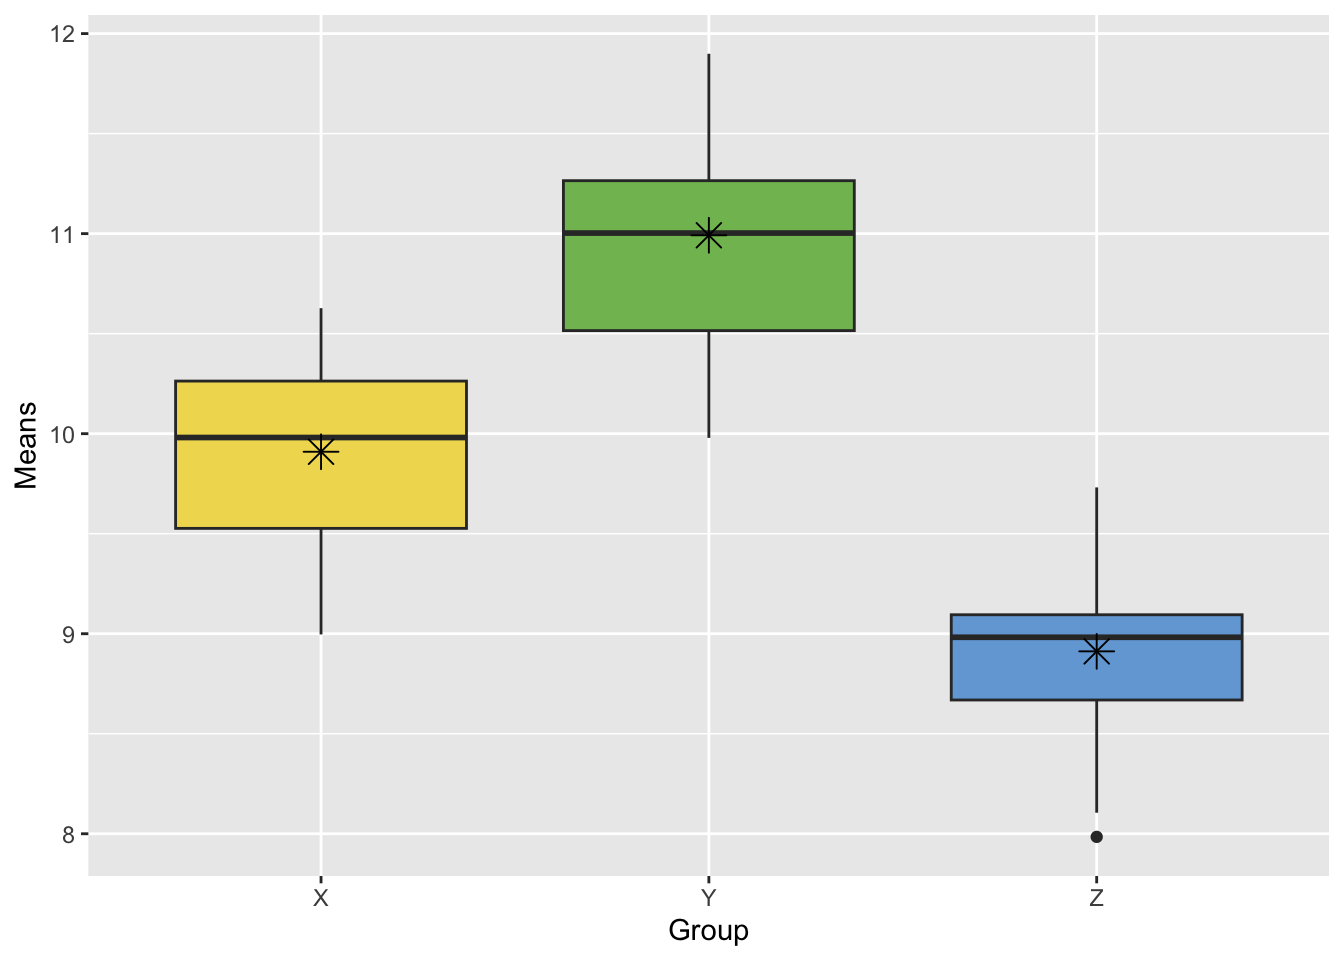
To answer this, we need to consider how much the sample means could vary by random chance alone (that is, from randomly drawing the sample from the population). Therefore, we need to analyze the variance in the sampling distribution of the mean. Continuing with the example above, the figure below shows the corresponding bootstrap distributions for each sample mean (recall from Lesson 4 that the bootstrap distribution approximates the sampling distribution). We can now see that the sample means are distinct from one another. The variances of the sample means (the spread of each boxplot) aren’t so large as to overlap with each other.
 FAQ
FAQ