Lessons
1 Nonmarket Analysis
Introduction
Did you complete the course orientation?
Before you begin this course, make sure you have completed the Course Orientation.

Overview of Lesson 1
Effective analysis of non-market issues requires a framework for evaluating those issues. This lesson provides a systematic set of considerations that are useful for characterizing and analyzing issues that may result in non-market activity.
Lesson 1 also introduces a Case Study that will carry over for several lessons. The Case Study demonstrates nonmarket analysis related to legislation regarding Renewable Portfolio Standards (RPS) policy. RPS programs are widely used to promote the use of renewable energy. This case study will help you understand and master both the structure and mechanics of RPS programs and the step-by-step analysis of nonmarket issues. In this lesson, we will learn the fundamentals of nonmarket analysis and delve in to the details of how RPS programs work.
What will we learn?
By the end of this lesson, you should be able to:
- clearly explain nonmarket environments and the lifecycle of nonmarket issues;
- identify nonmarket issues, stakeholders, and initial policy positions;
- know how to acquire and/or generate the information necessary for non-market issue analysis;
- assess demand for nonmarket action (per capita benefits, aggregate benefits, substitutes);
- assess supply of nonmarket action (cost of organizing, number of members, coverage, resources);
- understand fully renewable portfolio standard (RPS) structure, terminology and mechanisms.
By the end of this lesson, you should have an initial understanding of how to:
- organize and tabulate information to facilitate drawing conclusions from your analysis;
- predict a stakeholder's likelihood of taking nonmarket action;
- be able to state and defend a prediction from your analysis (how the issue is likely to turn out) and identify key stakeholders (the stakeholders most important for driving the issue to its predicted resolution).
What is due for Lesson 1?
The table below provides an overview of the requirements for Lesson 1. For details, please see individual assignments.
Please refer to the Calendar in Canvas for specific time frames and due dates.
| REQUIREMENT | SUBMITTING YOUR WORK |
|---|---|
| Read Lesson 1 content and any additional assigned material | Not submitted. |
| Weekly Activity 1 | Yes—Complete Activity located in the Modules Tab in Canvas. |
Introduction to Nonmarket Analysis
What is Economics?
Economics is the study of the allocation of scarce resources.
Resources yield benefits through their use in consumption or production. And resources are scarce when making use of them in one way removes the opportunity to make use of them in another.
For example, we use our time for play or work. And the organizations where we work ask us to perform different tasks in order to fulfill their objectives. A corporation’s primary objective is to earn profits for its owners by creating a product valued by its customers. These organizations receive payments--revenues (or donations if the organization is not a business) --that they use to invest in equipment and to pay workers. And workers use the income derived from work to buy a house, heat a house, or buy a car, or put gasoline in the tank. And then we decide where to go, to play or to work.
All of these decisions require tradeoffs. How much equipment will an organization forgo in order to hire another worker? How much income will we forgo in order to play? How much heat will we forgo in order to travel? Economics provides a framework for thinking about these choices.
Economics and Energy
Worldwide demand for energy is growing rapidly. The U.S. Energy Information Administration (EIA) projects in the 2021 IEO that world-marketed energy consumption will continue to increase. See Figure 1.1. Most of this increase will occur in non-OECD countries. Remember from previous courses who they are? See the Organization for Economic Co-operation and Development (OECD) [3]. This energy is going to come from a wide and changing mix of fuel types and end-use sectors (see Figure 1.2.)
In general economic terms, Figure 1.1 is the demand forecast and Figure 1.2 is the supply forecast.
Finally, to provide some important perspective, keep in mind that there is an important difference between total energy use and per capita (per person) energy use. The chart at the bottom of the page demonstrates this, especially when compared to Figure 1.1. Data from I [4]nternational Energy Outlook 2021 [5].
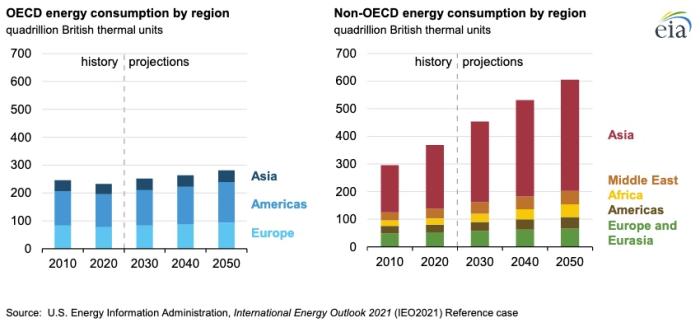
| Year | OECD energy consumption | Non-OECD energy consumption |
|---|---|---|
| 2010 | 243 | 297 |
| 2020 | 230 | 371 |
| 2030 | 248 | 459 |
| 2040 | 261 | 537 |
| 2050 | 279 | 611 |
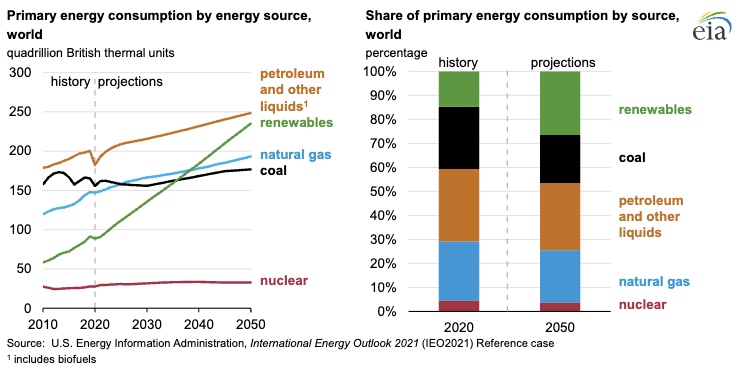
- Reference case data shows decline in coal use through 2030 but that use of all major fuels (petroleum and other liquids, renewables, natural gas, and nuclear) will grow from 2030 to 2050.
- Reference case data also shows that expected changes in government policies and falling technology costs will allow a rise in the use of renewable energies, which will limit the share of global energy use fueled by natural gas.
- In absolute terms, use of coal is expected to decline steadily through 2050 but will remain in the mix due to heavy industrial use in India, local supplies in certain areas, and an increase in coal-fired generating plants in certain parts of Asia.
- A constant pace of growth is projected for liquid fuels consumption through 2050 due to world-wide travel, use of internal combustion engines, and industrial use of petroleum and other liquids.
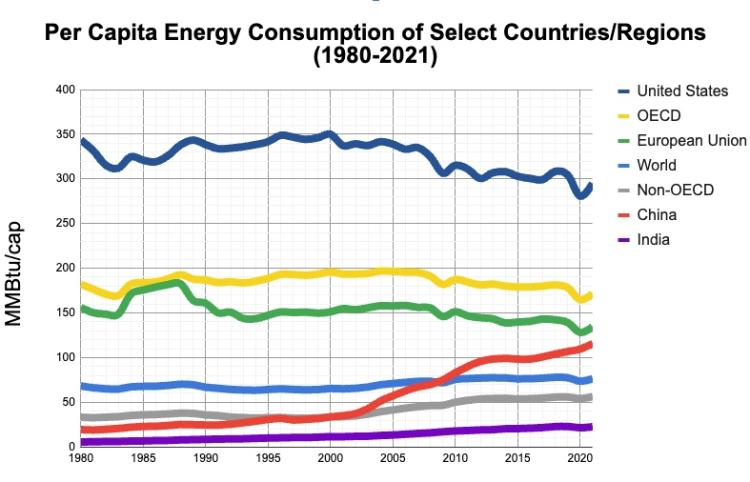
This is a line chart that has seven lines with the date in years across on the X-axis (1980 through 2021) and million Btu’s per person on the Y-axis. The lines on the chart represent the per capita energy consumption of the following geographic areas: the world, OECD nations, non-OECD nations, the EU-27, the United States, China, and India. Numbers below are approximate.
- Until about 2010, the U.S. maintained an emission rate of between 300 and 350 million BTUs per person since 1980, with a drop from around 340 in 2008 to around 290 in 2015. This went back up before 2015 and hovered around the 300 mark, but since in 2020 dived to around 280 before rebounding in 2021.
- OECD nations maintained an emission rate of approximately 200 million BTUs per person since 1980, with a slight downward trend since 2008 and a 2021 number of around 275 million.
- The European Union has maintained an emission rate of approximately 150 million BTUs per person since 1980, with a slight downward trend since 2008.
- World averages have maintained a relatively steady 60 million BTUs per person from 1980 through the early 1990's, but have been slowly moving upward to nearly 80 MMBtu/cap in 2015 and beyond.
- Non-OECD nations averaged approximately 25 million BTUs per person from 1980 through 2002, then slowly increased to a little over 50 million BTUs per person in 2016 and have continued to hover just above the 50 million mark.
- China slowly increased from around 20 million BTUs per person in 1980 to about 40 million BTUs per person in 2002, then had a sharp increase to nearly 100 million BTUs per person in 2016. That trajectory has continued so that in 2021, the mark is approaching 125 million. This is by far the most dramatic increase over a short period of time in this chart.
- India has increased at a very gradual rate from approximately 5 million BTUs per person in 1980 to around 22 million BTUs per person in 2021.
In the wild scramble to meet soaring demand with limited resources (ah ha, “scarce resources”!), the situation is made far more complicated by volatile external issues such as those involving the environment (from emissions and climate change to land use and biodiversity), security (energy independence) and local health and economies. Issues such as these, which are addressed outside of normal market transactions ("external to the market"), are called externalities or nonmarket factors and are the subject of this course.
A Note on Decoupling and Emissions Goals
The IEO 2020 notes that despite energy use growing at around 1% per year through 2050, global GDP is expected to grow between 2.4% and 3.7% per year. While GDP is increasingly regarded as an inadequate way to measure the health of an economy and the people in it (see e.g. Lesson 2 [8] from Energy and Sustainability in Contemporary Culture for some insight), it does provide a reasonably good snapshot of total economic activity. Energy use increasing at a lower rate than economic growth represents a partial decoupling of energy and economic growth. There is some debate on whether total economic growth is needed or not (redistribution would likely do the trick), but the global economy is likely to keep growing regardless. Assuming that, it would be ideal if energy use becomes entirely decoupled from economic growth. Greenhouse gas emissions must not only be decoupled from economic growth but there is wide agreement that net emissions must be zero in the next 30 - 40 years [9]. There is some indication [10] that we may have decoupled emissions from growth, but that is not enough.
To Read Now
At this point, please complete Reading Assignment 1-- Market and Non-Market Environments. This is located under the Lesson 01 subheading in the Modules tab in Canvas. (Read everything through "Change in the Nonmarket Environment.")
Nonmarket Environment
The market environment includes interactions between firms, suppliers, and customers, where the interactions are voluntary economic transactions, governed by markets and contracts.
The nonmarket environment, on the other hand, refers to the domain of concerns that cannot be controlled or managed through an individual's or organization's market-based interactions. These are social, political, regulatory, and legal considerations that affect an organization’s and/or individual's fortunes but occur outside the market environment.
It is very important to note, as the reading makes clear, that market and nonmarket environments can and often do impact each other. In particular, market activity often precipitates nonmarket action, and nonmarket action often impacts the market environment. As Baron notes in the reading: "The problems encountered by Nike, Wal-Mart, BP, Microsoft, and Citigroup originated in their market environments, but the challenges to their operations came from the nonmarket environment."


The Life Cycle of Nonmarket Issues
To Read Now
At this point, please complete Reading Assignment 2-The Nonmarket Issue Life Cycle.
Nonmarket issues have the potential to evolve through various stages, which can be understood as a life cycle. Once an issue is identified, interest groups often form based upon their interests in potential outcomes. Sometimes (as in the greeting card example in the reading), the issue is addressed by a firm as a response to actions taken by interest groups. Some issues will evolve to a legislative stage, where lawmakers are lobbied to address the issue. Issues resulting in legislation will eventually be administered through a regulatory framework. And finally, in cases where there are disputes over the application of that regulatory framework, interested parties may seek enforcement through the regulatory framework and the court system.
Note that this lifecycle does not explain why issues progress as such, only that it is common for them to do so. Also keep in mind that nonmarket issues can end up having impacts without reaching the legislative stage, e.g. public perception.
Introduction to Nonmarket Analysis
Nonmarket environments refer to the domain of concerns that cannot be controlled or managed exclusively through an individual’s or organization’s market-based interactions. For example, many of us are concerned with climate change, environmental damage from energy resource extraction, electric power reliability, worker safety and fair wages, and energy affordability, to name a few! These are concerns we cannot always effectively address with conventional transactions or contracts.
Our nonmarket concerns are associated with a set of issues which can be resolved in a number of ways. Based upon our beliefs, we develop expectations about how our nonmarket concerns are affected by these alternative resolutions. And based on our individual and/or organizational objectives, we have preferences over the set of possible outcomes for each issue. For example, a particular carbon cap-and-trade proposal is an issue associated with at least two nonmarket concerns: climate change and energy affordability. Any individual or organization concerned with climate change or energy affordability will likely have preferences for or against a particular carbon cap-and-trade proposal.
Take a Look!
For those of you have taken EGEE 401, this may look familiar (it should!). Either way, spend four minutes to take a look. This is an entertaining and very good explanation of the principles of cap and trade. Please watch the following (3:29) video:
HANK GREEN: I just ran across a rather disturbing statistic. Apparently, Americans have no idea what cap and trade is. When Rasmussen asked Americans what cap and trade was, most of them had no idea, and 29% of them said that it had something to do with regulatory reform on Wall Street. Only 24% said that it had anything to do with environmental issues. I thought maybe this EcoGeek could be of some service. Now you probably know what cap and trade is, but maybe you need a refresher course. And maybe you just want to share it with your friends and family, so they too can have some idea about the most important environmental legislation ever.
So cap and trade, in its simplest form-- basically, the government says to all of the companies in the country, we can only have this much of a certain pollutant. That's the cap. We simply cannot have more than that much pollution. And if we do, we're going to fine the crap out of all of you.
Then the government distributes credits for the release of those pollutants to all of the companies that produce those pollutants. Ideally, they give the companies credits for less pollution than they're already polluting with, so then the companies either have to reduce their pollution or buy credits from someone else. If the company is able to reduce its pollution below its current credit level, then it can sell or "trade away" those credits to companies that are having a harder time.
So basically, the government creates an artificial economic market in pollution. So then the amount of money that the companies are willing to spend decreasing their pollution is directly proportional to the amount of money it would cost them to buy the credits if they weren't able to reduce their pollution. Success! We have a new economic market, and everyone wants to reduce their pollution!
But wait. There are problems. We run into the first problem when we say that the credits are "distributed." How are they distributed? There are two ways. Basically, there's grandfathering, in which you get credit based on the amount of pollution you're already producing-- which seems kind of lame to me. I mean, it's like, oh, you're the biggest polluter! Here, have the largest number of credits!
Or two, they can be auctioned off. That's the way that the Obama administration is looking at doing it. They're actually hoping to have huge amounts of money generated by the auctioning off of these carbon credits. But economists are kind of like, wait a second. So you created an artificial market, and you're selling nothing for billions of dollars? Also, the polluting corporations don't like it at all. But to me, it seems like a fairly fair way to do things.
The second problem with cap and trade is that, yes, the money has to come from somewhere. So whatever sectors of the economy are doing all that pollution, the prices of their services are going to go up. So yes, gasoline prices and energy prices would increase. And if gasoline and energy prices are increasing, what we have is not a cap and trade system. It's a tax. It's a tax! Boo, taxes! Rah, rah, rah! I like my money. Don't take my money away!
But it's certainly more popular than a straight carbon tax, and with good reason. First, we don't have to call it a "tax," and people like that. Second, say there's one coal power plant that can reduce its emissions relatively easily, and there's another in which it would be extremely expensive to reduce its emissions. The coal plant that has an easy time can reduce its emissions twice over, and the coal plant that's having a hard time doesn't have to do it. So you get the same amount of reduction in the end, but the costs are much lower.
Cap and trade systems have actually been used in America for a long time, mostly on sulfur dioxide, which is the stuff that causes acid rain. And since cap and trade legislation went into place on sulfur dioxide, energy prices have not increased substantially, but the emission of sulfur dioxide has gone down like 50% despite huge increases in power generation. So yes, it works!
Well, it works for sulfur dioxide, anyway. The question is, will it work for greenhouse gases? Hopefully, we will find out soon. The Obama administration hopes to have cap and trade legislation on the books by 2012. And from then on, the government can continually lower the cap, and that strong market in carbon credits should spur innovation in wind power, carbon sequestration, solar power, electric cars, and who knows what else.
And that, my friends, is why I as an EcoGeek am excited about cap and trade, and why America should, yeah, have some idea what I'm talking about. This is Hank Green from ecogeek.org.
Any issue will involve a set of stakeholders' concerns that are sufficient to justify expending resources to influence the ultimate outcome. In the case of carbon cap-and-trade, stakeholders primarily concerned with energy affordability and believing that such a policy would increase energy costs will likely prefer that a cap-and-trade scheme not be implemented. In contrast, stakeholders primarily concerned with climate change, and who believe that such a policy will mitigate climate change will likely prefer that the cap-and-trade scheme succeed. Keep in mind that it is usually not so cut-and-dry. As you will see moving forward, most stakeholders have a range of nonmarket concerns with varying degrees of intensity and priority, and so deciding which side of an issue one is on can be complicated. You didn't think this would be easy, did you?
Nonmarket analysis summarizes the set of stakeholders in a way that facilitates evaluating the range of potential outcomes for each issue.
Information Collection
Nonmarket analysis requires a limited but particular set of information about each issue. The issue is specified uni-dimensionally (more on this below). The analysis identifies the stakeholders who have preferences that vary among the potential outcomes. The stakeholders are characterized according to attributes that determine their (potential) influence on the issue outcome.
In this course, we will use the words issue, stakeholders, and effectiveness as defined below. These concepts, however, are often expressed in other ways, depending on the author and context. For example, Baron in Business and the Environment (the source of earlier assigned readings), refers to our "stakeholders" as "interests."
Issue
An issue is the basic unit of consideration for nonmarket analysis. Issues arise when stakeholders have preferences that vary over alternative methods for achieving a business or policy objective. Through these issues, stakeholders affect the likelihood of achieving their organizational objectives. For purposes of analysis, an issue is defined as a specific policy question with a uni-dimensional set of possible policy alternatives (outcomes).
Issue: a specific policy question with a uni-dimensional set of possible policy alternatives (outcomes)
Examples of issues include: What should be allowable concentrations for particulate emissions? At what legal age should we be able to vote? At what levels shall we set climate change agreement emissions targets? How often should we report on progress in meeting climate change emissions targets?
Bueno de Mesquita provides a useful definition:
An issue is any specific policy question for which different individuals, organized groups, or informal, interested parties i.e., stakeholders, have preferences regarding [an] outcome. The range of preferred outcomes on an issue must be capable of being represented along a single line or continuum. Be sure to define carefully the precise policy question you want to analyze. The … ends of [a] policy continuum should specify the most extreme outcomes actually supported by any [particular stakeholder]. Of course, these extreme outcomes need not refer to a resolution that anybody believes will be achieved, but refer only to the fact that there is at least one stakeholder that currently seems to support such an outcome.
de Mesquita, B. (n.d.) The Predictioneer's Game. Retrieved March 17, 2010 from Predictioners Game [18]
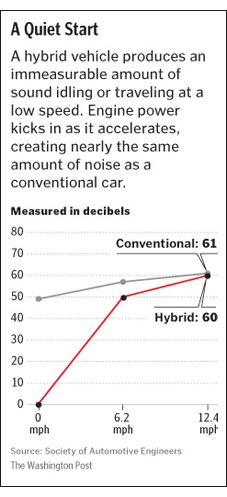
Click here for text description of Figure 1.4
This following text precedes a graph. A hybrid vehicle produces an immeasurable amount of sound idling or traveling at a low speed. Engine power kicks in as it accelerates, creating nearly the same amount of noise as a conventional car.
The graph has mph on the x axis and decibels on the y axis.The hybrid car starts at zero decibels while it idles and goes to 50 decibels by the time it hits 6.2 mph. From 6.2 mph to 12.4 mph it rises from 50 - 60 decibels.
The conventional car idles at 50 decibels, moves to about 58 decibels at 6.2 mph and then rises to 61 decibels by the time it reaches 12.4 mph.
Consider the case of hybrid cars. Better for the environment and pocketbook (in many cases), what's not to love? Of all things, they may be too quiet. In fact, in the eyes (well, ears) of many, these cars are so quiet they are unsafe--a danger to pedestrians. Nearly 10 years after the first release of production hybrids in the USA, a study showed that hybrid-electric vehicles were 50% more likely than cars with noisy combustion engines to be involved in an accident during certain low-speed maneuvers. We have an issue, folks: Should manufacturers be required to add noise to these otherwise quiet vehicles? (For source of this info and more background see The Deadly Silence of the Electric Car [19].)
By the way, this is still an issue! Though very few people are aware of it (I counted myself among them until I researched it), the NHTSA propagated a rule that electric and hybrid vehicles were required to add artificial noise if they are traveling up to 18.6 mph or reverse starting in September of 2020 (source: The Verge [20], 2019). In September 2020, the NHTSA, responding to lobbying from automakers, delayed the implementation of this so-called "Quiet Car Rule" by 6 months (source: GMA Authority [21], September 2020). I could not figure out whether or not this rule was implemented in March of 2021. Perhaps someone who is more plugged in (no pun intended) to this issue could update the class in the Coffee Shop.
A Note on Uni-Dimensionality
You probably have a general idea what uni-dimensionality means, but just to clarify in case it is needed: "Uni-dimensional" is what Mesquita referred to when he notes that issues "must be capable of being represented along a single line or continuum" (emphasis added). In other words, the choice(s) presented in an issue must be a matter of degrees. The easiest example is a simple "yes or no" question, e.g.: "If a presidential election were held today, would you vote for Donald Trump to be President or not?" The two extremes of this choice are "yes" and "no". A related continuum-based question would be: "If the election were today, how likely would you be to vote for Donald Trump on a scale of 1-10, with 1 meaning 'extremely unlikely' and 10 meaning 'extremely likely?'" This time, the extremes of the choice are 1 and 10. Each of these questions can be visually represented on a single line (a continuum), and the latter question presents choices that are varying degrees of the same option. A multi-dimensional question cannot be represented on a single line. For example: "If the election were held today, would you most likely vote for Joe Biden, Donald Trump, Kanye West, or none of the above?" No matter how many candidates are listed, even though there are a discrete number of choices, they are not a varying degree of a single choice, and thus do not represent a single issue as we define it.
The issue above has a simple "yes/no" continuum, but once different types of noises are being proposed (e.g. a "whir" or a some other noise, as the article describes), then it becomes multidimensional and thus not an "issue" as we define it.
Stakeholders
Stakeholders are the individuals or groups that act to influence the ultimate resolution of a particular issue.
Bueno de Mesquita again provides a useful definition:
A stakeholder … is any individual or group with an interest in trying to influence the outcome on the issue being analyzed. … [T]he list of [stakeholders should not be limited] to those who will ultimately make the decision. ... [Stakeholders also include those who will] weigh in, trying to influence the decision makers. All who try to influence the outcome should be represented in the stakeholder list.
de Mesquita, B. (n.d.) The Predictioneer's Game. Retrieved March 17, 2010 from Predictioners Game [18].
In the case of the too-quiet electric vehicles (EVs), numerous stakeholders emerge: EV manufacturers (e.g., Toyota, Tesla, Nissan, GM, Ford), Alliance of Automobile Manufacturers, and the National Federation of the Blind, among others. Please note that the terms "stakeholders," "stakeholder groups," and "interest groups" are often used interchangeably.
When performing non-market analysis, be careful to distinguish between those that try to influence the decision and those who simply make the decision based on objectively analyzing the issue. The NHTSA, a federal administration under the Department of Transportation, is tasked with rule making based on the Pedestrian Safety Enhancement Act of 2010 (PSEA, full text available here [22]). Essentially, they were tasked with determining how to interpret and enforce the PSEA, which like many laws, is sufficiently vague to the point that it can be interpreted in a variety of ways. Here is one of the key aspects of the Act: The NHTSA must "determine the minimum level of sound emitted from a motor vehicle that is necessary to provide blind and other pedestrians with the information needed to reasonably detect a nearby electric or hybrid vehicle operating at or below the cross-over speed, if any..." (Source: US. Government Printing Office [22]) (So yeah, not so specific.) After the issue completed the legislative stage, the NHTSA issued a proposed rule that detailed how to adhere to the Act based on their nominally objective interpretation of it. They then allowed public comment, as required by law, then issued a final ruling after considering the comments. They then allowed some time for formal petitions. In this process, they did not seek to influence the outcome, and thus would not be considered a stakeholder. They made a decision based on the letter of the law and comments from stakeholders. Stakeholders were involved in all stages of the issue formation, from interest group formation to legislation to administration. If you are interested in seeing the final ruling and the petitions filed, you can view it here [23]in the Federal Register.
Initial Policy Position
Each stakeholder can be associated with an initial policy position. An initial policy position refers to the policy preference that a stakeholder is willing to proclaim at the outset of bargaining with other stakeholders. This preference must fall somewhere along the issue continuum.
The initial policy position is the "position the stakeholder favors or advocates within the context of the situation. When a [stakeholder's] position has not been articulated, it is best thought of as the answer to the following mind experiment: If the stakeholder were asked to write down his or her position, without [necessarily] knowing the values being written down by other stakeholders, what would he or she write down as the position he or she prefers on the issue continuum?”
de Mesquita, B. (n.d.) The Predictioneer's Game. Retrieved March 17, 2010 from Predictioners Game [18]
In our example, EV manufacturers, at least initially, were described as a "nascent industry divided over whether safety sounds should be added to the quiet cars and, if so, what those noises should be." Whereas some manufacturers began to experiment with adding sound, and testing for customer preference, others were less enthusiastic. Officials at Tesla are quoted as saying they had "no intention of implementing 'fake noises.'" Other stakeholders, such as the National Federation of the Blind were clearly in favor of a mandate. The NHTSA was ready to act, given sufficient data. Each stakeholder had an initial position on a policy that would require adding "noise."
Determining Stakeholder Groups
It can be difficult to determine the boundaries of a stakeholder when it is a group of people or organizations. For example, "EV manufacturers" could possibly be considered a single stakeholder, but only if they are likely to take unified action. What if Tesla and GM have different perspectives on the issue of artificial noise and thus would not act in a unified manner? You would have to treat them as separate stakeholders. Even if they did have the same perspective and/or initial policy position, they are not likely to take action together, thus should be treated as separate stakeholders regardless.
A group can be considered a stakeholder if they are seen as likely to take unified nonmarket action. For example, there may be some individuals that belong to the National Federation for the Blind (NFB) that would prefer to not have artificial noise, but the NFB will act as a single, unified group, so the NFB is considered a single stakeholder. The approximate percentage of individuals within a group that support a position or course of action can affect the strength of a position and likelihood of a stakeholder taking action. This will become clearer when we go over supply of and demand for nonmarket action later in this lesson, but this should make intuitive sense. For example, the likelihood of the NFB taking action is higher if nearly all of its members are in favor of artificial noise than if barely a majority are. Of course there are a near infinite number of degrees in-between these positions.
When performing nonmarket analysis, you must take into consideration the (dis)unity of stakeholders within a group. Be warned that this often involves well-informed, but imperfect calculations and considerations. Reality can be a messy place, especially when human behavior is involved!
Demand for Nonmarket Action
So now we have an issue, and we have stakeholders, and each of those stakeholders has a position on the issue. What is the likelihood of these stakeholders taking nonmarket action? That is, of participating in activities such as "lobbying, grassroots and other forms of constituent activity, research and testimony, electoral support and public advocacy?" (Baron, 2010, p. 155).
To understand the likelihood of a stakeholder participating in nonmarket activities, we use the concepts of supply and demand. Baron (2010) describes it well:
The extent of these [nonmarket] activities is a function of their costs and benefits, and the optimal amount of nonmarket action maximizes the excess of benefits over costs for the interest [stakeholder].
To assess the nonmarket actions of interests [stakeholders], the supply-and-demand framework from economics can be used. The demand side pertains to the benefits associated with nonmarket action on an issue, and the supply side pertains to the cost of taking, or supplying, nonmarket action. An increase in the benefits results in more nonmarket action, and an increase in the costs results in less nonmarket action (Baron, 2010, p. 155).
The Demand for Nonmarket Action
The demand for nonmarket action comes from the consequences of the issue outcome on the various stakeholders. "For firms, those consequences are reflected in sales, profits, and market value. Employee interests are measured in terms of jobs and wages. For consumers, the consequences are measured in terms of the price, qualities, and availability of goods and services" (Baron, 2010, p. 155).
Demand for nonmarket action can be understood in terms of three factors:
- Per capita benefits are benefits to an individual stakeholder (a person or firm). For example, benefit of changes in tax code to an individual taxpayer.
- Aggregate benefits are the total, or sum, of the per capita benefits across a stakeholder group. For example, benefits to all "taxpayers" from a change in tax code. When "aggregate benefits are widely distributed, per capita benefits can be small, providing little incentive for market action" (Baron, 2010, p. 156). Per capita and aggregate benefits are usually correlated (high per capita benefits often have high aggregate benefits, and vice versa), but not always. (See below for an example of this.)
- For some issues, "the benefits of nonmarket action can be obtained through other means, referred to as substitutes. The benefits from nonmarket action are lower when there are other means of generating them, and the closer these substitutes come to replicating the benefits, the smaller are the incentives to act. Substitutes may be available in the market environment or nonmarket environment" (Baron, 2010, p. 156). For example, voters in favor of a carbon cap-and-trade policy may instead accept a carbon tax policy. The latter policy could be seen as a substitute means of accomplishing the same (or nearly the same) benefits as the original issue (cap-and-trade). Note that cap-and-trade has its own issue. A carbon tax represents a separate issue, but can affect the strength of a stakeholder's demand for cap-and-trade. Regarding the hybrid car issue, a substitute for artificial noise could be automatic braking, which could avoid pedestrian accidents. Interestingly, back when the aforementioned study was done (2009) this was not a viable option, but as of 2019 it is a very strong substitute and would likely limit the demand for action on the issue. All else being equal, as the viability and number of potential substitutes increases, the demand for the nonmarket action decreases.
Note that per capita and aggregate benefits can be related to the (dis)unity of the group noted in the previous page. Some members within a group may not receive any benefits, or a lot, and all points between. This may be a cause or effect of disunity, but either way should be taken into consideration. As more members receive more benefits, the per capita and aggregate benefits increase. Aggregate and per capita benefits usually operate in lock-step, but they may have different impacts on the demand for an action. For example, if all taxpayers in the U.S. were to receive a very small tax break - let's say $25/year for argument's sake - then the per capita benefits would not be very large and thus demand not likely significant. However, the aggregate benefits would be substantial, since there are over 140,000,000 taxpayers [24] in the U.S. and thus would indicate a relatively high demand. Overall, as per capita and/or aggregate benefits increase, likelihood of nonmarket action increases.
In sum, demand for nonmarket action--the benefits motivating a stakeholder to take action--are a result of the individual (per capita) benefits, the aggregate benefits, and the presence (or lack of presence) of substitute ways to achieve the same benefits.
Supply of Nonmarket Action
The supply of nonmarket action depends on the cost of taking the action and the ability of the stakeholder to be effective in taking action. To make a difference on an issue, a stakeholder needs to have the resources necessary to execute and have enough influence to be effective.
The cost of organizing includes those costs "associated with identifying, contacting, organizing, motivating and organizing those with aligned interests. If the number of affected individuals or groups is small, the costs of organizing are likely to be low. When the number is large, those costs can be high. Taxpayers are costly to organize because they are numerous and widely dispersed, whereas pharmaceutical companies are relatively easy to organize. The costs of organization can be reduced by associations and standing organizations. Labor unions, the Sierra Club and business groups such as [Chambers of Commerce] reduce the cost of organizing for nonmarket action." (Baron, 2010, p. 156)
I would like to take a moment to stress the above points, since it has been a point of confusion in past sections of this course. First, remember that the intent of analyzing supply and demand in this context is to evaluate the likelihood of taking action on an issue. Just "caring about" or "considering" an issue is not the same as taking action. Second, generally speaking, the larger the group the higher the cost to organize, which in turn reduces the potential action or "supply" side of the nonmarket framework. As indicated above, U.S. taxpayers are incredibly difficult to organize into action. However, organizing a small stakeholder group such as a local libertarian organization with a few dozen members to act on tax law should be very easy, and thus would have a very low cost. However, the impact may not be as great with a smaller number of people. The other extreme of this is if a stakeholder is an individual person. It hopefully goes without saying that it should be easy for a single person to "organize" themselves into taking action. Finally, groups that are already very well-organized may have low organizing costs, regardless of size. As noted above, labor unions are a good example of this. This is because one of their primary functions is to try to influence issues on behalf of their members. It usually does not take a lot of effort to get their members to take action and therefore, they have a ready "supply" in a nonmarket framework.
Effectiveness is the impact a stakeholder's nonmarket action will have on the outcome of an issue. Nonmarket action is more effective when a stakeholder group has more members, their resources are greater and when the group has extensive coverage of legislative districts.
Effectiveness can be understood in terms of three factors:
- The greater the number of members in a stakeholder group, the greater its potential effectiveness for action. For example, the potential impact of an individual person on a federal tax law is almost immesurably small under most circumstances. This reduces the "supply" side of the framework and reduces the likelihood of action being taken. Compare this to an organization with millions of members, which is more likely to impact a federal tax law if they act in a unified manner. Their "supply" side of the framework (or potential for action) would be much greater than the individual.
- Coverage is a measure of the geographic location of stakeholder group members relative to the scale of the issue. For example, if the issue is national in scale, then having most stakeholders in one or two states means that coverage is minimal. If the issue will be decided on a state level, then you should consider how much of the state has interest group members. Particularly for issues addressed in legislative arenas, the effectiveness of nonmarket action depends on the geographic location of interest group members. "Nonmarket strategies based on the constituency connection between voters and their representatives are more effective the greater the number of political jurisdictions covered by the group. Although small businesses do not have the resources of large businesses, they are politically effective because they are numerous and located in every political jurisdiction" (Baron, 2010, p. 157).
- And finally, effective nonmarket action requires resources to fund and execute research, lobbying, legal services, grassroots campaigns and the group's administrative staff. Resources can be financial, or power-/knowledge-/skill-based. A poorly funded organization that has powerful, highly skilled, and/or politically connected members still has a significant resource base despite not having finanical resources. The greater a group's stake in an issue (the more it stands to win or lose), the greater are the resources that potentially would be contributed to a nonmarket strategy. Let's go back to the hypothetical tax law example. If an individual is a billionaire with high-powered political connections (e.g. one of the Koch brothers or Michael Bloomburg), then even though they have a minimal number of members (one each), the amount of resources they have indicated that they are very likely to take action on a nonmarket issue of concern to them. Notably, if the tax in question would have a large impact on their business (e.g. a carbon tax, which would significantly impact the Koch's petroleum interests), they are more likely to use their resources to influence the issue because this would increase their demand for the issue.
Importance of Coverage in Nonmarket Action
Automobile assembly plants are concentrated in a relatively small number of congressional districts, but the coverage of the auto companies' dealer and supplier networks is extensive. General Motors CEO Rick Wagoner attended the national auto dealers convention in 2008 to deliver a message and generate coverage of state political jurisdiction. The issue of concern to Wagoner was the possibility that states would enact their own regulations on greenhouse gas emissions to force large increases in automobile and truck fuel economy. Wagoner's message was, "We need to work together to educate policymakers at the state and local levels on the importance of tough but national standards." Wagoner explained why dealers were important in implementing General Motor's strategy at the state level, "Dealers are very effective in the political process because we don't have a plant in every state. We have dealers in every state." (San Jose Mercury News, February 10, 2008) The greater the coverage by members of an interest group, the greater the supply and the more effective is its nonmarket action. (Baron, 2010, p. 157)
A stakeholder's effectiveness--ability to impact the outcome of an issue and thus likelihood to take action to influence the use--depends on the number of members, their geographic location and resources available to support nonmarket activities.
Nonmarket Analysis
Nonmarket analysis refers to how we organize and draw inferences from the information we’ve assembled about the issue and for each stakeholder. Working in a structured manner, this analysis involves five fundamental steps. (You will address each of these step in your Case Study project throughout the semester)
- Define the issue. Remember from a previous page that "an issue is defined as a specific policy question with a uni-dimensional set of possible policy alternatives (outcomes)." Please keep this in the back of your mind, as you will be asked at various points in this course to identify issues. (For issue examples, see the Case Study options.)
- Collect background on issue. Document key terms and concepts, historical context, status and timeline.
- Identify and profile stakeholders. Name of stakeholder (firm, association, group or individual), type of organization and mission. Establish an initial position on the issue and explain benefits the stakeholder expects to realize from taking this position on this issue.
- Assess demand for and supply of non-market action across stakeholders. For each stakeholder, evaluate demand for nonmarket action (available substitutes, aggregate benefits, per capita benefits) and supply for nonmarket activities (effectiveness and cost of organizing).
- Predict the amount of nonmarket action that a stakeholder can be expected to take. This is established by weighing the demand (benefits) of taking action with the supply (resources required) to take action. The greater the benefits, the more likelihood of taking action. The greater the cost (and considering available resources), the less likelihood of taking action.
In the following lessons and accompanying case study, we will work through each step of nonmarket analysis and demonstrate a framework for organizing and presenting a nonmarket analysis summary.
RPS Case Study, Part 1
The framework of this Case Study reflects actual Pennsylvania policy and data. All information about stakeholders, especially assessments related to the likelihood of participation in nonmarket action and the strategy that may or may not be evoked is the author's opinion and presented in a manner to best demonstrate the lesson content of this course. This Case Study does not necessarily represent the actual position or strategy held or planned by any named stakeholder.
ISSUE
Do you support or oppose [28]Senate Bill 300 [29]?
Background
In 2004, Pennsylvania enacted the Alternative Energy Portfolio Standards (AEPS) Act [30] ("Act 213 [31]"), which provides “for the sale of electric energy generated from renewable and environmentally beneficial sources, for the acquisition of electric energy generated from renewable and environmentally beneficial sources by electric distribution and supply companies and for the powers and duties of the Pennsylvania Public Utility Commission.” Here [32]is the full text of the Public Utility Commission's Implementation Order, if you are inclined.
The type of policy covered by the AEPS Act exists in other states where it is most often called “Renewable Portfolio Standards" (RPS). For a full description of RPS programs across the country, including definitions, data and summary maps, see the Database of State Incentives for Renewable and Efficiency (DSIRE) website [33](You can search for Renewables Portfolio Standard under "program type." [34]). DSIRE is well-known, and dare I say the "go to" website for information about national and state-by-state energy policies in the U.S. The most current AEPS data available for Pennsylvania is 2021, as shown in the graphs and tables below.
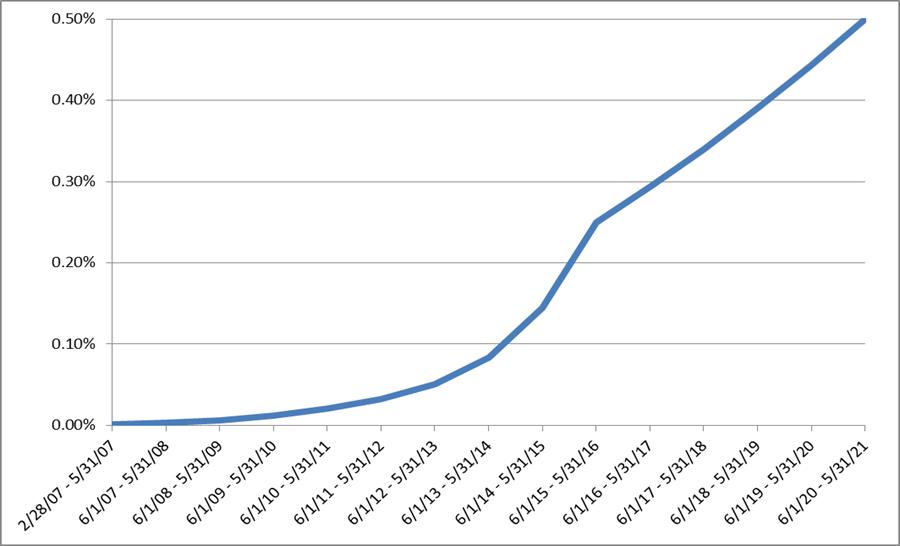
Among other things, the AEPS Act established that a certain percentage of the electricity sold in Pennsylvania must come from renewable energy sources and a specific percent must come from solar energy. (The latter is often referred to as a “solar carve out,” for obvious reasons.)
The exact percentages that must come from solar per Act 213 are shown here, in chart and table form.

To comply with the Act, businesses that sell electricity in Pennsylvania are required to submit alternative energy credits (AECs) corresponding to the currently required percentage. (The term “AEC” is specific to PA and means the same thing as renewable energy credit or “REC”, the more widely used terminology.)
A REC is an electronic certificate indicating that 1,000 kWhs (1,000 kWh = 1 MWh) of electricity has been generated from renewable fuel sources. When the fuel source is solar, it is usually called an SREC ("solar renewable energy credit"), but is officially termed an SAEC ("solar alternative energy credit") in Pennsylvania. Moving forward in this course, all solar credits will be referred to as SRECs to avoid confusion.
Solar Power Generation and Credits
Solar electric systems have a power rating that indicates their capacity to generate electricity from the sun. Power ratings are given in Watts. A kilowatt (kW) equals 1,000 Watts and a megawatt (MW) equals 1,000,000 watts. Electricity that is generated is energy measured in watt-hours, often kilowatt hours (kWh) or megawatt-hours (MWh). (For a review of energy and power, feel free to re-engage with the EGEE 102 course website [36]).
For example, a home in Pennsylvania with a 5 kW solar electric system will likely generate about 6,000 kWh per year (this depends on a lot of factors such as shading and orientation/azimuth). The owners of this system will earn six SRECs per year since 6,000 kWh = 6 MWh. These owners can sell their SRECs to the businesses (utilities) in PA that must comply with the AEPS. As long as the system is grid-tied (connected to the electrical grid), the owners are entitled to earn and trade SRECs. It does not matter where the electricity is used or by whom. Please note that partial SRECs are not always accepted for sale. Annual SREC totals from an individual supplier thus may be rounded down to the nearest whole SREC. (So even if the above mentioned system generated 6,200 kWh or even 6,900 kWh, they may only get credit for 6 SRECs.) Pennsylvania allows partial SRECs, so they can be included in SREC calculations.
How SRECs Impact the Market
When a utility is forced (by the AEPS Act) to buy SRECs, it adds to the cost of electricity because they must be allowed to recover these extra costs. This causes the price of electricity to rise for all customers (“ratepayers”), however minimal. The more SRECs the business must purchase and the higher the cost of the SRECs, the greater the increase in electricity prices for all ratepayers. (Keep in mind that this rate increase is almost certainly minimal, significantly less than $0.01 per kWh.)
SRECs are most often traded on the open market, though some special SREC incentive programs and auctions exist in some states. They are essentially auctioned off to businesses who need to purchase them. [For more detail about how this process works, see PJM EIS [37], the administrator of the Generation Attribute Tracking System (GATS). This video [38] provides a nice summary of how RECs are generated and tracked].
Solar electric system owners want to get as high a price as possible for their SRECs. The businesses that must comply with the AEPS want to pay as low a price as possible. The actual price (“settlement price”) is set by supply and demand (again, there are special auctions in some states, but this is the exception, rather than the rule).
The percentages in the AEPS drive demand. The higher the percentage, the greater the number of required SRECs for compliance. This demand, in turn, drives supply. If a small business owner is thinking of putting in solar, the prospect of being able to sell SRECs may make the owner more inclined to pony up the significant capital that is required to install a solar electric system. The potential for SREC revenue may also make the bank more likely to approve a loan for the installation.
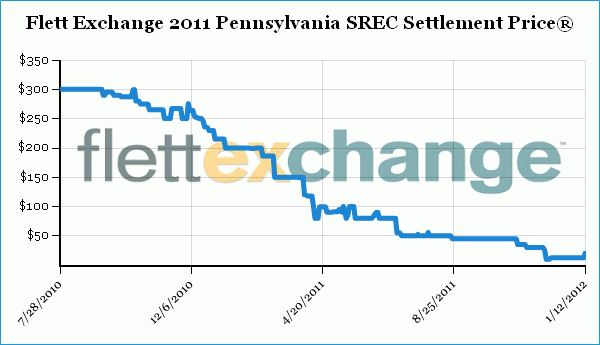
In 2008, the average settlement price in Pennsylvania for an SREC was $230. In 2009, the average was $260. (Note that this is $0.26/kWh, which was approximately double the cost of electricity at that time.) In 2010, the average was $325. In January 2012, the settlement price was $20 and by December of 2016 it had dropped to $7! (The price has been hovering in the $45 range in the summer of 2022 [39]. As a point of reference, SREC prices were in the $220 - $230 range in New Jersey and $340 - $400 range (!) in Washington, DC throughout 2021. For real-time pricing of these and other regional state markets, see Flett Exchange [40] or SRECTrade [41].) The images below provide a snapshot of PA prices in 2010 when prices were good, and in 2020 - 21, when they were significantly lower.

What happened? In 2009, Pennsylvania opened a rebate program for solar projects (solar electric and solar hot water). Along with other temporary factors, this caused the industry in Pennsylvania to surge—installing 46.5 MW in 2010. (In 2009, 4.4 MW were installed.) In fact, according to the Interstate Renewable Energy Council [43], Pennsylvania was 6th in the country in 2010 for newly installed solar electric capacity.
This surge in supply swamped the percentage of solar electricity required by the AEPS and SREC prices plunged. The consequences of this were widespread. Consumer interest in buying and installing new systems dropped considerably. With SREC returns this low, lenders would not finance projects. Solar installers closed shop or moved out of state. Existing solar installations were in trouble with revenue from SRECs falling far below expectations.
In response, a bill was proposed in the state House of Representatives that would accelerate the ramp-up of required percentages for solar electricity. The proposed increase for years June 2012 - May 2013 to June 2015 - June 2016 is shown in the figure below.

In addition to increasing the RPS percentages in the near term, the bill would also “close” PA borders. Under the original policy, electricity retailers can buy SRECs from a solar generation facility anywhere within the PJM region, which includes all or parts of Delaware, Indiana, Illinois, Kentucky, Maryland, Michigan, New Jersey, North Carolina, Ohio, Pennsylvania, Tennessee, Virginia, West Virginia, and the District of Columbia.
Status
Sponsored by Chris Ross (R-Chester), PA House Bill 1580 had 111 co-sponsors [44]. However, neither the House nor Senate was able to put it to vote before the legislative session ended and the 2012 election took place. Since then, several new bills have been announced to revise the AEPS targets but as of yet, none have been put to vote. In principle, this "issue" remains alive in PA. However, in April of 2018, the PA Public Utility Commission (PA PUC) issued a final implementation order [45] to Act 40 of 2017. This Act achieves part of PA House Bill 1580 by requiring all new SRECs to be generated by facilities inside of the state's borders. There are some exceptions, notably SREC contracts signed with out-of-state systems prior to October 30, 2017 and SRECs that have been "banked" (saved for future years), which can be used for a period of 3 years. Flett Exchange summarizes Act 40 of 2017 thus: "The commission ruled that unless an out of state solar facility has a binding contract for their SRECs with a renewable portfolio standard (RPS) buyer prior to October 30th 2017 the out of state solar facility will no longer have PA state certification on their SRECs after October 30th 2017. The SRECs generated (month of generation) prior to October 30th 2017 from an out of state solar facility will retain their PA state certification and the SRECs remain eligible for the full 3 compliance years."
Senate Bill 501 [46] is a bipartisan bill that was introduced in April of 2021, but died in subcommittee. According to SRECTrade, the bill would have "increase the state’s Tier I requirement from 8% to 18% by 2026..., increase the state’s solar carve-out from 0.5% at present to 5.5%, with 3.75% of the carve-out being sourced from in-state utility-scale solar (projects larger than 5 MW) and 1.75% from in-state distributed solar (smaller, interconnected residential and commercial projects). Notably, the legislation would also establish a limit on the cost of alternative energy credits (AECs, PA’s renewable energy credits) and facilitate long-term contracting in an effort to help minimize ratepayer impacts. Lastly, the legislation would also initiate a study on renewable energy storage in the state." (Source: SRECTrade [47], April 2021). It is not clear if it has enough support to pass, but it is a rare piece of major renewable energy legislation that is bipartisan.
Senate Bill 300 [29] (introduced as SB 230):
- "Expands the AEPS Tier I requirement from 8% to 30% by 2030, including 8% for in-state grid-scale solar, 2% for community solar, and 4% for in-state distributed generation solar;
- Enables community solar projects that are not currently permitted in Pennsylvania. Community solar allows people who cannot install solar on their properties to subscribe to a portion of the energy generated by a solar system located in their community, which would be credited to their electric bill."
- Referred to the Senate Consumer Protection and Professional Licensure committee as of March 15, 2023.
The above information on SB 300 was found on the State legislative tracking website: Center, L. D. P. (n.d.). Senate Co-Sponsorship Memoranda. The Official Website for the Pennsylvania General Assembly. https://www.legis.state.pa.us/cfdocs/Legis/CSM/showMemoPublic.cfm?chambe... [48]
Required Reading:
Pennsylvania Has Fallen Behind on Clean Energy Goals, but New Leadership in Harrisburg Could Give Rise to Policy Changes [49], Teague, C. (2023).
For a good summary of recently introduced legislation, as well as some other information about solar policy in PA, see this summary [50] from the Pennsylvania Solar Center.
A Short Note Regarding Energy and Financial Calculations
Most of this should be a review from EGEE 102, but this will help provide some perspective on this case study (and help you with this week's assignment!).
- If electricity costs $0.15/kWh and you use 100 kWh, it will cost you: $0.15/kWh x 100 kWh = $15.00
- There are 1000 kWh in an MWh
- A commonly-used economic indicator in renewable energy and energy efficiency projects is "simple payback." Simple payback indicates how long something will take to pay for itself, ignoring ongoing costs such as maintenance. To calculate simple payback, you simply (no pun intended) divide the upfront cost (after incentives) by the annual savings you will realize by implementing the measure. For example, let's say I spend $5 to buy an LED to replace an incandescent bulb. I calculate that it will save me $4/yr in electricity costs. My simple payback would thus be: upfront cost/annual savings = $5/$4 per yr. = 1.25 years.
- As indicated above, SRECs add value to your solar PV array. Let's say you have an array that will generate ~6,000 kWh/yr, which is 6 MWh and thus 6 SRECs. Because Pennsylvania has a "net metering [51]" law, the utility must pay you the same for electricity generated by your system that you pay them for the electricity that they supply. (This varies a bit by state, but most net metering states require the utility to pay at or near the full retail price that you pay). So if you pay $0.12/kWh, they pay you $0.12/kWh for each kWh your system generates. (The power company will not actually "pay" you for this. It will just take this off of your monthly bill.) Net metering also means that if you generate more electricity than you are using - say, on a nice summer day or sunny winter day - then that extra electricity will be used to compensate for times when you are using more electricity than you are generating. It goes beyond the scope of this lesson, but the amount that the utility "pays" the customer varies from state to state, as indicated above. It may just be the generation/supply cost, the transmission cost, and/or the distribution cost. The utility always recoups at least some of the cost through a monthly customer fee.
- Net metering is a very important (and increasingly controversial in some states) incentive for solar, but remember that SRECs provide an additional incentive. In the glory days of 2008, you would have gotten: 6 SRECs x $230/SREC = $1,380 in addition to your savings (this does usually come as a check). But in 2015 you would have probably received: 6 SRECs x $20/SREC = $120. Quite a big difference, eh? That is why SRECs is such an important policy mechanism. They can substantially alter the financial calculation for renewable energy systems.
When the SREC prices were so high in PA, soon after the AEPS was adopted, it was common to get paybacks in the range of 7-10 years. But now, even with low SREC prices, a building with good solar exposure can usually expect to have a simple payback of 7-10 years or less, depending on financing, state incentives, and a few other considerations. This is mainly due to lower prices for solar panels. In a good SREC market, simple paybacks can be in the sub-5 year range, which was unheard of a few years ago. It is a very dynamic marketplace due to a mixture of market and nonmarket forces!
Lesson 1 Assignment
Weekly Activity 1
Complete Quiz 1 located in under the Modules tab. The activity may include a variety of question types, such as multiple choice, multiple select, ordering, matching, and true/false (in some cases these require independent research and may be quantitative). Be sure to read each question carefully.
Unless specifically instructed otherwise, the answers to all questions come from the material presented in the course lesson. Do NOT go "googling around" to find an answer. To complete the Activity successfully, you will need to read the lesson, and all assigned readings, fully and carefully.
Each week, a few questions may involve research beyond the material presented in the course lesson. This "research" requirement will be made clear in the question instructions. Be sure to allow yourself time for this!
This Activity is to be done individually and is to represent YOUR OWN WORK. (See Academic Integrity and Research Ethics [52] for a full description of the College's policy related to Academic Integrity and penalties for violation.)
The Activity is not timed, but does close at 11:59 EST on the due date as shown on the Calendar.
If you have questions about the assignment, please post them to the "Questions about EME 444?" Discussion Forum. I am happy to provide clarification and guidance to help you understand the material and questions (really!). Of course, it is best to ask early.
Summary and Final Tasks
In this lesson, we learned about the nonmarket environment and a framework for collecting information for nonmarket analysis. The framework includes an issue, stakeholders, and assessment of the demand for and supply of nonmarket action. We applied the begging phases of the nonmarket analysis process to a Case Study where the issue is related to a Renewable Portfolio Standard (RPS) program. The information collection process provided hands-on experience with the structure and mechanics of RPS programs, an important policy type for renewable energy development.
You learned:
- the meaning of nonmarket environment;
- to identify nonmarket issues, stakeholders, and initial policy positions;
- a framework for organizing information collection related to nonmarket analysis;
- how to assess demand for and supply of nonmarket action;
- the structure, terminology, and mechanisms related to renewable portfolio standard (RPS) programs.
Have you completed everything?
You have reached the end of Lesson 1! Double-check the list of requirements on the first page of this lesson to make sure you have completed all of the activities listed there.
2 Public Politics
Introduction
Overview of Lesson 2
Nonmarket strategy includes all of the interesting and creative activities a stakeholder may perform in an effort to create a nonmarket environment that best serves its interest. A firm may challenge a law that makes it expensive or difficult to do business or compete with others, for example. An individual may organize a boycott of products or services that violate the individual's interests or principles--hey, don't buy from them, they donate to cause/candidate that we disagree with! Protesters may march in the streets or write letters to elected officials. A firm may commission a study, with likely positive outcomes in a field related to its business, for distribution to the public and policy makers. These are all attempts to use forces outside of the market to influence what happens in the market--where the money changes hands!
In this lesson, we will look at strategies that apply to nonmarket action that takes place in government arenas. This is called public politics. In the following lesson, we will consider strategies for nonmarket action that takes place outside of public arenas, called private politics.
What will we learn?
By the end of this lesson, you should be able to...
- explain the difference between public politics and private politics;
- list and describe three general approaches to nonmarket strategy in government arenas;
- demonstrate a range of specific strategies for nonmarket action in government arenas;
- understand the role of lobbying and related nonmarket action in the overall performance of many firms and nonprofits;
- complete all steps of a nonmarket issue analysis;
- apply data and analytics to a standard renewable portfolio standard structure and related policy implications.
What is due for Lesson 2?
The table below provides an overview of the requirements for Lesson 2. For details, please see individual assignments.
Please refer to the Calendar in Canvas for specific time frames and due dates.
| REQUIREMENT | SUBMITTING YOUR WORK |
|---|---|
| Read Lesson 2 content and any additional assigned material | Not submitted. |
| Weekly Activity 2 | Yes—Complete Activity located in the Modules Tab in Canvas. |
Nonmarket Strategy
In the last lesson, we introduced a framework for the analysis of nonmarket issues.
- Define the issue. A specific one-dimensional issue.
- Collect background on issue. Document key terms and concepts, historical context, status, and timeline.
- Identify and profile stakeholders. Name of stakeholder (firm, association, group, or individual), type of organization, and mission. Establish an initial position on the issue and explain benefits the stakeholder expects to realize from taking this position on this issue.
- Assess demand for and supply of non-market action across stakeholders. For each stakeholder, evaluate demand for nonmarket action (available substitutes, aggregate benefits, per capita benefits), and supply for nonmarket activities (effectiveness and cost of organizing).
- Predict the amount of nonmarket action that a stakeholder can be expected to take. This is established by weighing the demand (benefits) of taking action with the supply (resources required) to take action. The greater the benefits, the more likelihood of taking action. The greater the cost (and considering available resources), the less likelihood of taking action.
In part 1 of the RPS case study, we accomplished steps 1 and 2. At the end of this lesson, the case study will continue through steps 3, 4, and 5. We will illustrate how the framework is used to present a summary of an issue and the positions of stakeholders. This information (the outcome of nonmarket analysis) is used as the basis for forming a nonmarket strategy.

Nonmarket Strategy
An effective business strategy is an integrated strategy that guides a firm’s actions in both market and nonmarket environments.
“When a firm chooses a market strategy, that strategy competes with the strategies of other participants in the market. Similarly, when a firm chooses a nonmarket strategy, that strategy competes with the strategies of others, including other firms, interest groups, and activists. That competition shapes the nonmarket environment and often the market environment as well. The nonmarket environment thus should be thought of as competitive, as is the market environment. Nonmarket competition focuses on specific issues, such as a bill to increase fuel economy standards, as well as on broader issues, such as open access to the Internet” (Baron, 2010, p. 36).
Market strategies position a firm to be competitive in the marketplace; to take advantage of market opportunities. Nonmarket strategies, on the other hand, work to shape the market environment in which a firm does business (the marketplace). For example, nonmarket strategies may affect regulation and public opinion.
In a market, firms compete with other firms. In the nonmarket environment, however, there are many other players. Motivated by self-interest or broader concerns, these other players may include individuals, activists, unions, advocacy groups, and non-government organizations (NGOs). We’ll refer to these nonmarket players collectively as interest groups.
Both firms and interests groups have nonmarket strategies. A nonmarket strategy addresses the issues on the agenda of a firm or interest group. The strategy has objectives and a plan of action that takes into account the strategies of all stakeholders engaged on an issue. This includes the strategies of those aligned with and opposed to the objectives of the firm or interest group developing the strategy.
So, the nonmarket environment includes both firms and interest groups competing for advantage on issues. When this competition takes place in the context of the institution of government, it is called public politics. When the competition between firms and other stakeholders takes place outside of the context of the institution of government, it is called private politics.
This lesson and the next lesson are about nonmarket strategy. In this lesson, we focus on public politics. The next lesson will address private politics.
Nonmarket Strategy Approaches for Public Politics

Objectives
The objectives of a nonmarket strategy accomplish two things: they focus attention on the issue, and they help clarify alignment between stakeholders (those who are on the same side, who have the same or similar objectives). It is often helpful to specify a primary objective (stop this bill from getting passed!) but also a contingency objective (if it does pass, attempt to get, or avoid, some key wording). "For example, the domestic auto industry abandoned its primary objective of preventing higher fuel economy standards and adopted its contingent objective of obtaining flexibility in meeting the standards and measures to protect U.S. jobs" (Baron, 2010, p. 191).
Institutional Arena
Government arenas exist at many levels, including local, state, federal, and international, and they may take many different forms, from legislative to judicial and all the oversight agencies in between. Often, stakeholders may have some say in the arena where the issue will be addressed. Determining the desired arena can be a significant step in the development of a nonmarket strategy for resolving an issue.
Usually, nonmarket issues are initiated by interest groups. For example, in the case of electric vehicles that are too quiet, the issue was raised by consumer complaints. And typically, the stakeholder(s) that initiate an issue are the ones that determine where the issue will be addressed. But this is not always the case. Sometimes other stakeholders, including firms, may have an opportunity to drive the selection of an institutional arena.
To Read Now
Carbon border taxes are an emerging issue in climate change policy. As more countries enact emissions limits, they may begin taxing certain imports to maintain fair competition. Please read the following article for some insight into this issue:
- "Europe Is Proposing a Border Carbon Tax. What Is It and How Will It Work? [58]" New York Times, July of 2021. (Here [59]is a link to a .pdf if you cannot access the article.)
Optional Reading
During the Trump Presidency, tariffs had become a major topic of discussion. Former President Trump repeatedly threatened tariffs on countries that manufacture goods outside of U.S. borders since early in his presidency, and enacted a number of controversial tariffs [60] on a variety of goods. This is a very contentious issue, and is a prominent example of public politics.
- "Is Trump's Tariff Plan Constitutional? [61]" by Rebecca M. Kysar in the New York Times (January 3, 2017) (Download the .pdf version here [62] if necessary.) This provides some insight into some of the intricacies of U.S. tariff policy. This is an opinion piece, but note the different institutional arenas mentioned in the article.
- "President Trump's steel and aluminum tariffs raise two big questions [63]." from CNN Money (March 9, 2018) for updates on this issue, and for details on an additional (international) arena, the World Trade Organization (WTO). Note that the WTO is not considered a public sector organization because it is intergovernmental and thus not run by a single governmental entity, and membership is voluntary. For the purposes of this course, it will be considered quasi-public and intergovernmental.
- Read this short article about the market impact that the steel tariffs have had on oil pipeline businesses in the U.S.: "U.S. shale shippers will pay surcharge for Trump steel tariffs [64]" (Reuters, August 2nd, 2019)
- Read about some of the complexities involving energy infrastructure, farming, international trade, lobbying, and more related to the Trump Administration's tariffs: "Trump's Tariffs Set Off Storm of Lobbying [65]" (New York Times, March 16th, 2018).
Nonmarket Strategy Approaches
There are three general approaches to nonmarket strategy in institutional (government) arenas: Representation, Majority Building, and Information Provision. Each type of strategy involves its own set of tactics, or activities, to execute the strategy.
- Representation Strategies are strategies that build on the connection between elected officials and their constituents. The elected official seeks to represent the “will” of the voters and wishes to be reelected. In this type of strategy, the stakeholder (a firm or interest group) takes action to mobilize voters in support of candidates that are favorable to the stakeholder. A firm may establish a presence in a region or district—for example, by building a facility contributing to the local economy and creating jobs or by forming an alliance with another stakeholder with constituents in the area.
- Majority Building Strategies are strategies that directly recruit the votes of public officeholders. This may be done through a variety of means, including vote trading between legislators (I’ll vote this way on A, if you’ll vote that way on B), stakeholder pledges of electoral support (voter mobilization and volunteers), other endorsements and advertisements, and campaign contributions.
- Informational Strategies are strategies that use advanced data, insights, or understandings that a firm or an interest group has about an issue. For example, a report that shows hydraulic fracturing (“fracking”) for natural gas is costly to local municipalities may be used by fracking opponents to argue for a tax on fracking. The strategic use of information is a principal component in lobbying, legislative or regulatory proceedings, and public advocacy.
Please keep in mind that these are general approaches, not specific strategies. Strategies are explained on the next page.
Strategies of Public Politics
Lobbying
When a stakeholder seeks to influence the vote of an elected official, it is called “lobbying.” The people who do it are called lobbyists or just “the lobby,” (e.g., “the coal lobby”). Lobbying is a major tool for both representation and informational strategies. In fact, the Center for Responsive Politics [66] reports that firms, labor unions, and other organizations spent over $4 billion (with a "b!") in 2022 to lobby Congress and federal agencies. As of the summer of 2023, there are over 12,000 registered federal lobbyists (down from a high of nearly 15,000 in 2007). Every year since 2007 has had spending levels been above $3.2 billion in inflation-adjusted dollars!
Effective lobbying involves access to lawmakers or administrative officials, and, once you get there, strategic information. Two types of information are involved: technical and political. Technical information is about the issue—data and predictions. Political information pertains to the effects of the alternatives on constituents (voters) of the office holder. (If you pass this bill, prices will rise/fall, jobs will be gained/lost, the environment will be helped/damaged, and your constituents will be thrilled/enraged/helped/hurt/etc.).
Either way, to be effective, the information needs to be credible. To establish credibility, the officeholder may seek to verify the information with a third party (ideally by an opposing interest) or seek information from a source that is widely trusted by constituents. When data is backed by studies or verifiable data, it is generally more effective. It is clear that we are living in a somewhat "post-fact" political environment (particularly in the U.S.), but all else being equal, information provided to politicians is more effective if it is backed by legitimate data.
Of course, it is “both allowed and commonplace” for stakeholders to use information in a way that advocates their side of an issue! However, there are times when it would be immoral and possibly illegal to withhold information or make false claims. Responsible stakeholders remain highly mindful of this line.
Electoral Support
Electoral support activities focus on providing resources that help candidates during elections. For example, endorsements, volunteer workers, help with get-out-the-vote campaigns, campaign contributions, and funding for political advertisements (for and against candidates) are all electoral support activities. Activities of this nature are widely used by unions and many interest groups, but less so by firms, which tend to spend more on lobbying.
A major Supreme Court ruling in 2010 has worked to change this, however, at least for Federal Elections. As reported by the Center for Responsive Politics [67]:
In a 5-4 ruling in the case of Citizens United v. Federal Election Commission, the court overturned a ban on corporate and union involvement in federal elections that had been in effect since the early 1900s. The ruling allows corporations, unions and other organizations to spend unlimited sums from their own treasuries to fund political advertisements advocating the election (or defeat) of specific federal candidates.
The money can only be used for independent expenditures -- not direct contributions to the candidates' campaigns. And whatever ads are produced can't be coordinated with the candidates -- though policing that is not an easy thing to do.
Months before the election, numerous groups on the left and right announced intentions to raise millions of dollars to run independent campaigns to help elect their preferred candidates. Some formed new "super PACs" whose donors were fully disclosed, but many corporations and wealthy individuals funneled the money through non-profit front groups that kept the identity of donors secret. Attempts by Democrats in Congress to require disclosure of those hidden donations were defeated, so the sources of that money may never be known.
By election day, outside groups reported raising and spending nearly $300 million -- more than 40 percent of which came from undisclosed sources. That unprecedented surge of outside money -- which favored conservative candidates by a 2:1 margin -- helped to topple Democratic incumbents all across the country and bring about the biggest GOP sweep on Capitol Hill since 1948.
Optional Reading
If you are interested, see OpenSecrets.org [68] for more detail about PACs and current data related to PAC campaign contributions, broken down by sector, industry, and unique PAC.
Grassroots
Grassroot campaigns are based on the connection between constituents and their elected officials and may be used as part of an informational or representation strategy. Grassroots activities are intended to garner support of constituents and/or supporters of an issue. Examples of grassroots activities include letter writing campaigns (e-mail, post cards, letters, social media), phone calling, and grassroots lobbying (where individual stakeholders participate in lobbying efforts). Note that this strategy can, and often does, overlap with other strategies, especially electoral support.
The effectiveness of grassroots activities depends largely on the supply-side of our analysis framework—numbers, coverage, resources and cost of organizing. The advent of low-cost, widely distributed mobile technology, however, has changed this equation dramatically. With no paper or postage, mass e-mail communications and social media campaigns are fast and without significant cost. With online blogs and surveys, information collection and dissemination is rapid and cheap. With social media, widespread organizing and information sharing is instantaneous and free.
Barack Obama’s 2008 campaign is widely viewed as revolutionizing presidential digital organization in the U.S., and he utilized social media with great success in 2012 as well. The success of Donald Trump's 2016 campaign was made possible by social media, particularly through Twitter and Facebook communications. Grassroots organization on social media played a major role in the surprising success of the "Brexit" campaign in 2016 that resulted in Britain's decision to exit the European Union. Researchers from Oxford University determined that [69]:
"...the campaign to leave had routinely out muscled its rival, with more vocal and active supporters across almost all social media platforms. This has led to the activation of a greater number of Leave supporters at grassroots level and enabled them to fully dominate platforms like Facebook, Twitter and Instagram, influencing swathes (sic) of undecided voters..."
Social media famously played a starring role [70] in fomenting and publicizing the "Arab Spring" that began in 2010 and sent shockwaves through many Middle-Eastern countries.
From Obama's and Trump's top-down approach to the (mostly) bottom-up organizing of the “Arab Spring” and Brexit, technology has unleashed nonmarket forces as never seen before!
Coalition Building
This component of a nonmarket strategy involves forging a coalition with other stakeholders. Sometimes these coalitions may be longstanding and formalized, like trade associations or a Chamber of Commerce. Other times they may be ad hoc, joining together for a particular issue. Even with a coalition, however, the alignment of the stakeholders may not be ideal and may require negotiation. A well planned coalition can increase the effectiveness of the individual stakeholders on an issue by combining their numbers and resources.
Coalitions are often formed with a specific issue or set of isssues in mind. The American Coalition for Clean Coal Electricity [71] (ACCCE), for example, is a coaltion of 17 members that rely heavily on the coal industry in their market activities. According to their website, the ACCCE is "a coal-industry trade association working to increase the longevity of the coal industry." See their website [71] if you are interested in learning about some of the nonmarket issues they have taken action on. On the other side of the proverbial coin is the Powering Past Coal Alliance [72], which is a coaltion of 135 members [73] that "is a coalition of national and sub-national governments, businesses and organisations working to advance the transition from unabated coal power generation to clean energy." They are very active in various nonmarket arenas. See their website for more details.

Testimony
Stakeholders may testify before regulatory agencies, congressional committees, administrative agencies, and courts. This testimony is “important not only because the information presented can affect regulatory decisions, but also because it creates a record that may serve as a basis for judicial review” (Baron, 2010, p. 236).
In the public processes of regulatory agencies, stakeholders are given an opportunity to comment or otherwise contribute information to the process. The Pennsylvania Public Utility Commission (PUC) for example routinely “asks for comments” on policy. In The PUC Rate Making Process and the Role of Consumers [75], the PUC explains the many ways interested parties are invited to provide input into the rate making process:
"Individual ratepayers may become formal parties by filling out a formal complaint form. Ratepayers may speak for themselves, or an attorney may represent individual ratepayers or groups of ratepayers. Consumers also can have their say informally by writing or calling the PUC or completing the objection/comment form. Consumers also may testify at public input hearings. By providing testimony, consumers place their views in the official record on the case. Public input hearings are conducted by the ALJ [Administrative Law Judge] in the utility’s service territory. Consumer testimony becomes part of the record on which the PUC will base its decision."
The right to comment on public sector action is fundamental to rulemaking at local, state, and federal levels, and allows all citizens to engage in public politics. For example, all regulations issued by federal agencies must be made available for public comment [76] for at least 30 days (except under extenuating circumstances), and all substantive comments are to reviewed before the the final reguation is published. Every U.S. citizen and company can file a comment, you and I included (as long as you are a U.S. citizen). (This should ring a bell! Remember from the last lesson that the NHTSA allowed public comment prior to submitting the its final ruling on how to implement the Pedestrian Safety Enhancement Act of 2010. All of these comments would be considered "testimony.") Testifying before any public body - Congress, your local state legislature, courtrooms at any level, etc. - is considered testimony as well.
Public Advocacy
Public advocacy is communication directly to the public conveying a particular position on an issue. How a message is framed can be important. For example, “cap and trade,”dubbed by opponents as “cap and tax,” may be better served by the alternative “cap and dividend.” The "Clean Coal" campaign is a strong example of a carefully framed and well-funded message targeted directly at the general public. Firms, politicians, and interest groups can and often do engage in public advocacy. Perhaps the most prevalent and common example now is the way President Trump used Twitter to reach out directly to the general public, frequently framing issues ("dangerous immigrants," "job-killing taxes," etc.). At no time in the history of the U.S. has a U.S. President engaged in so much public advocacy.
Public advocacy does involve private actors and often does influence private politics (more on that next lesson), but it is considered public politics if the issue is ultimately addressed within the institution of government.
Judicial Actions
Judicial actions are cases where a stakeholder is either a defendant or an initiator of legal action as part of a nonmarket strategy. The purpose of these cases may be to enforce or protect rights, obtain restitution for damages, or address unfair competitive practices. Lawsuits are often very costly, but the rewards can be high, too. Judicial strategies may be used in courts, governed by statutory and common law, and in regulatory and administrative agencies, which are governed by administrative law.
In a landmark ruling in June 2011, for example, the Supreme Court ruled [77] that climate change regulation is the business of the federal government (the Environmental Protection Agency, or EPA) and barred states from using public nuisance laws to try to force major utilities to cut greenhouse gas emissions from power plants. In doing so, the "high court sided with five large utilities in a suit brought by several states and three nonprofit land trusts over the facilities' emissions. The utilities--American Electric Power Co., Southern Company, Xcel Energy, Cinergy Corp., and the Tennessee Valley Authority--together release about 650 million tons of CO2 per year. That's a quarter of the CO2 emissions from the U.S. electricity-generating sector."
Ironically, though the utilities were technically victorious in this institutional arena in the abovementioned case, this ruling provided the authority for the Obama Administration's Clean Power Plan (CPP), which was a regulation propagated by the EPA that is projected to reduce the carbon pollution from U.S. power plants 32% below 2005 levels by 2030 [78]. The CPP was a nonmarket public political action that, if it were to be revived and come to fruition, would likely have a significant impact on the national power market for the foreseeable future. The CPP's implementation was blocked by a 5-to-4 margin in the U.S. Supreme Court in February 2016, and before the Trump administration (the EPA, which is a public arena but not a judicial one) decided to ignore it, it was awaiting judgment [79] in the District of Columbia Circuit of the U.S. Court of Appeals.
This authority granted by the Supreme Court has also played a prominent role in the U.S.'s negotiations in, and ultimate adoption of, the 2015 Paris Agreement [80], which will have far-reaching impacts on energy markets worldwide. In fact, the Paris Agreement (which the Trump Administration decided to pull the U.S. from but the Biden Administration re-entered) also took place in an international institutional arena (though not judicial), under the auspices of the United Nation's Framework Convention on Climate Change (UNFCC) [81].
Shareholder Advocacy
Interest groups may use a firm’s annual shareholders meeting as an opportunity to question the company in a venue where the exchange will be reported to the public. (This would be considered private politics because it does not take place in a government institution.) Taking these actions an additional step, however, an interest group that is a shareholder may make a more formal filing with the Securities and Exchange Commission (SEC). This would be a move to public politics and is called a shareholder resolution.
To Read Now
- Visit The Forum for Sustainable and Responsible Investing [82] and read "Shareholder Resolutions". (If you have a few minutes, explore this site more.)
- Read "Proxy Statement [83]" from Investopedia.
- Finally, read a "Proxy Vote 101" [84] by Broadridge, an investment consulting firm.
Final Note
Please keep in mind that these strategies often intertwine, e.g. a grassroots campaign to provide electoral support or building a coalition that lobbies elected officials. Just as there is interaction between market and nonmarket environments, there is often interaction between different public politics (and, it should be noted, private politics) strategies.
Organizing for Nonmarket Effectiveness
To be effective in government arenas, firms (and other organizations) need to stay "in the know" about what's going on--trends, information, changes, priorities, people, and personalities. They must stay in close touch with the political winds around topics of concern to the organization. Baron explains how this may be done:
"Firms that expect to be involved in issues addressed in government arenas must anticipate rather than simply react to developments. Consequently, they need to organize and be prepared for action. It is essential to monitor issues, and for many firms this means full-time representation in Washington and in the capitals of key states. For other firms, associations can be a cost effective means of providing intelligence, although this may not be sufficient if the firm’s interests differ from those the association represents. Most large firms also have a government affairs department that provides expertise and monitors the development of issues. A department may include lawyers, communications experts, former government officials, lobbyists, and analysts.
Washington offices serve as the eyes and ears of firms. They provide information on developing issues and are a locus of expertise about issues, institutions, and office holders. Because nonmarket issues are often episodic in nature, many firms on occasion engage the services of political consulting firms, Washington law firms, or public relations firms. Similarly, lobbyists may be hired for a specific issue. The size of a firm’s permanent staff thus is determined relative to the cost and effectiveness of outside alternatives.
Because lobbying is the centerpiece of most firms’ interactions with government, most employ lobbyists who are either political professional or experienced managers responsible for presenting the firm’s concerns to government officials. Their responsibilities typically include maintaining relationships with members of Congress, executive branch officials, and government agencies. Access is a necessary condition for lobbying, so many firms make a practice of maintaining contact with those members of Congress in whose districts they have their operations and with the committees that regularly deal with issues on the nonmarket agendas. Firms also provide training for their managers who are involved in nonmarket issues. That training often emphasizes sensitivity to the public reaction to the firm’s activities and the development of personal skills for participating effectively in government arenas."
Source: Baron, p. 239
In addition to lobbying, many firms fund organizations to perform nonmarket actions for them. These actions can take the form of any of the strategies detailed in this lesson, including lobbying. For example, the owner of Koch Industries (the second largest privately held company in the U.S., according to Forbes [85]) provides funding and other resources [86] for a number of organizations, including the American Enterprise Institute (AEI) and the American Legislative Exchange Council (ALEC). Both AEI and ALEC are influential in public politics in a number of ways. Providing resources to think tanks and other non-profit organizations can be an effective way to influence the nonmarket environment.
RPS Case Study, Part 2
The following Case Study is written by the course author. The framework of this Case Study reflects actual Pennsylvania policy and data. All information about stakeholders, especially assessments related to the likelihood of participation in nonmarket action and the strategy that may or may not be evoked, is the author's opinion and presented in a manner to best demonstrate the lesson content of this course. This Case Study does not necessarily represent the actual position or strategy held or planned by any named stakeholder.
Case Study, Continued...
In the first part of this Case Study, we identified the issue and provided background, including a full description of the principles of Renewable Portfolio Standards (RPS) policy. With this groundwork, we are now prepared to consider the issue from the viewpoint of a wide range of stakeholders. Using an orderly format and presentation, we continue our nonmarket analysis with an examination of each stakeholder, including a description of the stakeholder, initial position, and an assessment of all factors related to the demand for and supply of nonmarket action.
We will use the following scales, as suggested by Baron (2010, p. 169).
Substitutes: availability of viable substitutes
Aggregate and Per Capita benefits: small, moderate, considerable, large, substantial
Numbers: few, small, considerable, large, substantial
Coverage: little, extensive, complete
Resources: limited, small, moderate, large, huge
Cost of Organizing: very low, low, moderate, high, very high
Prediction: limited, little, moderate, large
A couple of notes before you read through this: First, when analyzing the substitutes for nonmarket action, make sure to consider potential substitutes to the position that the stakeholder takes, and whether or not they are within the stakeholder's power to impact. Substitutes can change from stakeholder to stakeholder. So if a stakeholder is opposed to the RPS, consider substitutes that would have the same or similar effect as the RPS policy not passing, and is an action they can influence. If a stakeholder supports the RPS, consider substitute actions that would have the same or similar result as the RPS passing. Effectively you ask yourself: "Does the stakeholder have any other options that could take the place of the outcome that they want and can they influence that outcome?"
Also, when analyzing the coverage of the stakeholder, there are a few important considerations. First, consider the scale of the nonmarket issue. In our example here, the RPS is a state law, so you should consider how much of the State of Pennsylvania is covered by the stakeholder. For national issues, you should scale up accordingly. Second, be careful when estimating the extent of coverage. For example, a non-profit having a single office in every U.S. state does not necessarily result in complete, or even extensive coverage of a national issue. You should think about whether or not each office oversees membership in every part of the state, whether it has offices throughout most states, whether it reach dozens or tens of thousands of members, and so forth.
When analyzing the per capita and aggregate demand, do not just focus on financial aspects of the issue. Also consider the non-financial benefits. For example, 350.org [87]'s core mission is to reduce carbon dioxide emissions, and would thus reap substantial benefits if an aggressive cap-and-trade or carbon tax policy were to be implemented even though they would be unlikely to benefit financially. With regards to the Lesson 1 example, the National Federation of the Blind (an advocacy organization for the sight-impaired) would not likely benefit much financially from electric car manufacturers adding noise to their cars, but they would realize considerable or large benefits aggregately and on a per capita basis because it would address their mission.
Finally, keep in mind that prediction of nonmarket action is not an exact science, but predictions must be justifiable. The goal is to analyze as much relevant supply and demand information as possible and make a prediction based on that information. A good analysis will take all factors into consideration and have a strong, logical justification based on the available information.
Stakeholders
Mid-Atlantic Renewable Energy Association (MAREA) [88]
“a nonprofit organization, dedicated to informing and educating the public on renewable energy production, energy efficiency, and sustainable living through meetings, workshops, educational materials, and energy fairs.” Position: SUPPORTS
- Substitutes: Many MAREA members, both individuals and businesses, have a financial interest in solar. But all members share a primary commitment to principles related to sustainability, including efficiency, agriculture, and other technologies. There are no other viable substitutes available to increase the solar carve out or to replace community based solar.
- Aggregate: Benefits are large for MAREA. The solar industry has a large and important presence at MAREA’s annual energy festival. Solar events of all types are highly attended. A more aggressive RPS would increase the demand for solar in the state, which would benefit solar companies and their ability to contribute to organizations such as MAREA.
- Per Capita: On average, benefits are small for individual MAREA members, many of whom are not in the solar business and do not yet own their own solar electric system. But members are generally solar advocates, and so would reap some benefit.
- Numbers: Typically, 6,000 to 10,000 attend the annual PA Renewable Energy Festival. MAREA doesn’t release data regarding the number of members or extent of its e-mail circulation. considerable
- Coverage: Members are mostly in eastern PA, some in central and western PA, some out of state. extensive
- Resources: Limited finances. Other than a few paid services, MAREA is managed by all volunteers. They do not have much political influence. limited
- Cost of Organizing: MAREA has a strong e-mail list, active website, and established social media presence (Facebook and Twitter), and face-to-face contact at monthly meetings and with large audience at annual energy festival. Cost of Organizing is low.
- Predicted amount of nonmarket action: Aggregate benefits to organization are high and cost of organizing is low, but per capita benefits are small and resources are limited. moderate
Pennsylvania division of Solar Energy Industries Association (PA-SEIA) [89]
“organization of manufacturers, developers, contractors, installers, architects, engineers, consultants and other industry professionals dedicated to advancing the interests of solar energy and to developing a strong local PA industry offering high quality installation and professional services to business and residential customers in the region we serve.” Also, at the time it published a public blog for the PA division of MSEIA [90] Position: SUPPORTS
- Substitutes: For this industry association, there is no substitute for the proposed actions.
- Aggregate: Benefits are substantial for PA-SEIA. Without this bill passing to support solar development in the state, solar businesses will flee PA for more favorable business environments. These businesses are the PA-SEIA membership.
- Per Capita: Benefits are substantial for many individual PA-SEIA members. Passing this bill will raise demand for solar installations.
- Numbers: As of 2011, the regional SEIA website listed 75 member businesses in PA. This represents about 15% of the total number of installers on the PA Department of Environmental Protection’s Approved Installer List. small
- Coverage: The majority are in eastern PA, some in central PA, very few in western PA. The membership businesses were mostly focused in pockets in a few parts of the state. extensive
- Resources: The organization has highly qualified lobbyists available, but resources must be covered by member dues, and funing is limited. small
- Cost of Organizing: Members are available electronically. Resources needed to administer website, manage e-mail lists, and develop messaging. Limited presence on social media. moderate
- Amount of Nonmarket Action: Stakes are high but PA-SEIA resources are limited and numbers are not high, yet there are no good substitutes. moderate
Owners of Small Solar Electric Systems in PA
Individuals, typically homeowners, with small scale solar installations (<15 kW) in PA used to offset personal usage. Position: SUPPORT
- Substitutes: For most, AEC income is an essential component in recovering cost of investment. Advances in electricity pricing (“time of use” or TOU) that would be a weak substitute. They may also be able to sell their AECs into other regional markets.
- Aggregate: Benefits are large, directly financial. This bill will increase the demand for AECs (higher percentages).
- Per Capita: Benefits are large, directly financial. As described above.
- Numbers: As of July 2011, there were 4,028 solar generators (capacity less than 15 kW) located in PA, registered with the PA AEPS. large
- Coverage: Owners are sprinkled throughout the state, but sparse in some areas. extensive
- Resources: Because of capital investment involved for solar electric installation, presumably individuals in this group are reasonably well resourced. However, policy expertise is likely lacking for most individuals. moderate
- Cost of Organizing: Currently, contact info for homeowners with solar electric installations is unavailable. They must be reached through other organizations or broad media. high.
- Amount of nonmarket action predicted: The stakes are high, yet it is very difficult to reach and inform this group; policy expertise is lacking and coverage is middling. little
Owners of “Larger” Solar Electric System in PA
Owners of solar electric installations in PA with capacity greater than 15 kW, typically small businesses or institutions. In PA, as of July 2011, includes facilities up to 3.5 MW. Position: SUPPORT
- Substitutes: For most, AEC income was a critical component in securing financing. They may be able to sell AECs elsewhere, but not a strong or guaranteed substitute.
- Aggregate: Benefits are substantial, directly financial. This bill will increase the demand for AECs (higher percentages) and reduce the supply (close PA borders), increasing PA AEC prices.
- Per Capita: Benefits are substantial, directly financial. Same as described above.
- Numbers: As of July 2011, there were 530 solar generators located in PA, with capacity greater than 15 kW, registered with the PA AEPS. small
- Coverage: They are mostly located in eastern PA, some in central and western PA; they are spread out in various parts of the state. extensive
- Resources: Mostly well-resourced small businesses and institutions, but small in number. Policy expertise is likely to be lacking. moderate
- Cost of Organizing: Currently, contact info is unavailable or difficult to ascertain. Must be reached through other organizations or broad media. high
- Amount of nonmarket action predicted: Again, there is difficulty reaching and informing this group though stakes are high. As an organized group, there is limited likelihood of action. Because of the commercial nature of many of these projects,however, some owners may be aware and act independently. So overall, little.
Owners of Small Solar Electric System (not in PA, in PJM)
Individuals, typically homeowners, with small scale solar installations (<15 kW) used to offset personal usage. Located outside of PA, but still within PJM territory and currently able to sell RECs into PA market. If the AEPS is updated, they will lose their ability to sell SRECs in PA. Position: OPPOSE
- Substitutes: Sell RECs elsewhere.
- Aggregate: Benefits are small. If the bill doesn't pass, SREC values stay low. If bill does pass, PA borders are closed. Either way, they would realize no significant benefit.
- Per Capita: Benefits are small, for same reason.
- Numbers: About 1,300 (<15kW) not in PA are currently registered with AEPS. considerable
- Coverage: Outside of PA but in the PJM territory, otherwise locations unknown. little
- Resources: Because of capital investment involved for solar electric installation, presumably individuals in this group are reasonably well resourced. Policy expertise is likely lacking. moderate
- Cost of Organizing: Currently, contact info is unavailable or difficult to ascertain. Presumably located in multiple states. Must be reached through other organizations or broad media. very high
- Amount of nonmarket action predicted: Limited, because of small benefits, difficulty reaching and informing this group and an available substitute.
Solar Installers
Any person or business that installs solar electric systems in Pennsylvania. Position: SUPPORT
- Substitutes: For most customers, AEC income is critical to obtain financing and/or cost justify the investment. For installers, if solar business dries up, option is to close up or relocate. No acceptable substitute for what AEC prices do for market.
- Aggregate: Benefits are substantial, directly financial (increased customer activity).
- Per Capita: Benefits are substantial, directly financial (increased customer activity).
- Numbers: As of 2013, the DEP list of Approved Photovoltaic Installers [91] included 629 names, 462 located in PA. small
- Coverage: Their aggregate territories include all of PA and some other states. complete
- Resources: The group is not formally organized and includes many small business and new start-ups, but this is a profitable industry so they have some resources. moderate
- Cost of Organizing: Full contact info is published, but difficult to work with. Hard to get installers attention with e-mail only; other contact (phone, mail) are resource intensive; low numbers make this somewhat manageable. moderate
- Amount of nonmarket action predicted: High; benefits are high per capita and across group, readily identified group, cost of organizing moderate but appears worth it, no good substitute.
PennFuture [92]
A nonprofit organization that “enforces environmental laws and advocates for the transformation of public policy, public opinion and the marketplace to restore and protect the environment and safeguard public health. PennFuture advances effective solutions for the problems of pollution, sprawl and global warming; mobilizes citizens; crafts compelling communications; and provides excellent legal services and policy analysis.” Position: SUPPORT
- Substitutes: Many members have a financial interest in solar. But all members share a primary commitment to principles related to the environment, including water, air, climate, and other natural resources (natural gas). For solar specifically, however, no direct substitute. Progress on other environmental issues could be a suitable substitute.
- Aggregate: Benefits are moderate for PennFuture, no direct benefit to group but of significant benefit to some members.
- Per Capita: Overall, benefits are moderate for individual PennFuture members, because of financial benefit to some and environmental benefit for all.
- Numbers: Data are unavailable. The PennFuture website reports, “The Philadelphia Inquirer called PennFuture 'Pennsylvania's leading environmental advocacy organization.'" Assumed to be large.
- Coverage: Members are spread statewide. complete
- Resources: PennFuture is a well funded non-profit, based on donations. Group maintains paid staff of policy analysts. large
- Cost of Organizing: PennFuture has an active website and holds many well-attended public events. One of their major functions is to engender action on issues. Cost of Organizing is low.
- Amount of nonmarket action predicted: High, benefits are medium for group and per capita, and group is concerned with additional issues, but resources are large and cost of organizing is low.
Pennsylvania Coal Association [93] (Now called the Pennsylvania Coal Alliance)
A “trade organization representing surface and underground coal operators that produce bituminous coal mined in the Commonwealth. In addition, PCA represents companies whose livelihood depends in whole or in part on a robust coal industry by providing essential services to the coal industry, ranging from engineering and consulting to financial, insurance and the sale of mining equipment.”
The PCA has successfully opposed similar initiatives in the past, citing rising electricity prices for consumers. Solar, of course, is a competitive energy source. At the time, coal was used to generate almost half [94] of the electricity in PA. Position: OPPOSE
- Substitutes: Any other issue opposing alternative fuel sources or industry regulation.
- Aggregate: Overall, benefits are moderate. At this point, due to relative scale, solar poses no real threat but issue carries weight on principle with organization and its members.
- Per Capita: Benefits of defeating this bill are small to individual PCA members. As stated above, solar is not a significant threat to the industry (at the time).
- Numbers: At the time, about 150 members. few
- Coverage: Statewide, but mostly western PA extensive
- Resources: Resources of prominent members of regional coal industry, which has major political and economic clout in PA. huge
- Cost of Organizing: Well organized, established channels, experienced. very low
- Amount of nonmarket action predicted: Large, benefits are small to moderate, but resources are huge and cost of organizing is very low.
Ratepayers
Any individual or business in PA that pays for electricity. Position: OPPOSE
For ratepayers who oppose this bill, the benefits are avoiding possible small increase in electricity prices.
- Substitutes: Energy efficiency and conservation could also reduce electricity costs, but not perceived as a viable replacement for low electricity prices.
- Aggregate: Overall, benefits of opposing the bill are small, as it would not have much impact on prices - probably no more than a few dollars a year on average.
- Per Capita: For individual ratepayer, benefits of opposing the bill are small. But for some, principle of "less government" is important, and bills of this nature have symbolic importance. moderate
- Numbers: 4,970,057 Residential + 680,045 Commercial/Industrial = 5,650,102 Total Customers [95](not all are opposed—unclear how many support/oppose/have no opinion). substantial
- Coverage: Statewide complete
- Resources: Resources of all businesses and individuals that pay for electricity in PA and oppose this bill. huge
- Cost of Organizing: No organization or focused medium for reaching all rate payers. very high
- Amount of nonmarket action predicted: Limited, benefits are small per capita and moderate for group, and cost of organizing is very high. On symbolic grounds, however, some possibility of action.
Ratepayers
Any individual or business in PA that pays for electricity. Position: SUPPORT
For ratepayers who support this bill, the benefits are reduced reliance on fossil fuels and energy imports.
- Substitutes: The opportunity to purchase electricity from “green” generators would be a good substitute.
- Aggregate: Overall, benefits are small, in particular because the policy would not only increase solar energy use slightly.
- Per Capita: Unless you are a ratepayer with an installed solar electric system, benefits are indirect (environmental, principled) and small.
- Numbers: 4,970,057 Residential + 680,045 Commercial/Industrial = 5,650,102 Total Customers [95] in 2011 (not all are supporters—unclear how many support/oppose/have no opinion) substantial
- Coverage: Statewide complete
- Resources: Resources of all businesses and individuals that pay for electricity in PA and support this bill. huge
- Cost of Organizing: No organization or focused medium for reaching all rate payers. very high
- Amount of nonmarket action predicted: Limited, benefits are small per capita and for group, substitutes exist and cost of organizing is very high.
Pennsylvania Chamber of Business and Industry [96]
The “largest broad-based business association in Pennsylvania. Thousands of members throughout the Commonwealth employ greater than 50 percent of Pennsylvania’s private workforce. Headquartered in Harrisburg, the PA Chamber serves as the frontline advocate for business on Capitol Hill by influencing the legislative, regulatory, and judicial branches of state government. In 1995, the Pennsylvania Chamber of Business and Industry became one of only five state chambers in the nation to be accredited by the U.S. Chamber of Commerce for meeting the highest standards of performance and effectiveness.”
The PCA has successfully opposed similar (broader) initiatives in the past [97], stating “the legislation would destroy Pennsylvania’s historic energy strengths, including coal, nuclear (a CO2-free energy), and one of the Commonwealth’s most promising developing industries – natural gas“ and “consumers would be forced into paying for more costly energy sources.” Position: OPPOSE
- Substitutes: Other issues involving regulation and overhead for businesses in PA. However, particular sensitivity to issues related to energy costs and interference in "free" market systems.
- Aggregate: The benefits to the Pennsylvania Chamber of Commerce and its members of opposing this bill are avoiding small possible increases in electricity prices and avoiding competition from alternative energy sources. But, on principle, this issue rates high. Overall, benefits are moderate.
- Per Capita: Same as above. moderate.
- Numbers: Exact data unavailable, but this from the Chamber's Web site [98], “The Pennsylvania Chamber of Business and Industry is the largest broad-based business association in Pennsylvania. Thousands of members throughout the Commonwealth employ greater than 50 percent of Pennsylvania’s private workforce.” large
- Coverage: Statewide. complete
- Resources: Resources of all Chamber members, which include significant income, political connections, and expertise. huge
- Cost of Organizing: Experienced, structured, well organized. very low
- Amount of nonmarket action predicted: Well-funded and experienced operation ready to roll, though direct benefits are moderate, but on principle, issue is significant. large
Framework
As a final step to our Nonmarket Analysis, we build a table, as shown below, to present a summary of our findings. This table is the Nonmarket Analysis Summary Framework.
| Demand Side | Supply Side | Prediction | ||||||
|---|---|---|---|---|---|---|---|---|
| Stakeholders - SUPPORTING | Benefits from Supporting HB 1580 | Ability to Generate Nonmarket Action | Amount of Nonmarket Action | |||||
| Substitutes | Aggregate | Per Capita | Effectiveness | Cost of Organizing | ||||
| Numbers | Coverage | Resources | ||||||
| MAREA | none | large | small | considerable (~8,000) | extensive | limited | low | moderate |
| PA-SEIA | none | substantial | substantial | small (~75) | extensive | small | moderate | moderate |
| Small System Owners (in PA) | TOU elec prices, sell RECs elsewhere | large | large | large (4,000) | extensive | moderate | high | little |
| "Larger" System Owners (in PA) | sell RECs elsewhere | substantial | substantial | small (530) | extensive | moderate | high | little |
| Solar installers | none | substantial | substantial | small (629) | complete | moderate | moderate | high |
| PennFuture | other environmental issues (gas) | moderate | moderate | large | complete | large | low | high |
| Ratepayers (supporting) | buy green generation | small | small | substantial | complete | huge | very high | limited |
| Stakeholders - OPPOSING | Benefits from Opposing HB 1580 | Ability to Generate Nonmarket Action | Amount of Nonmarket Action | |||||
|---|---|---|---|---|---|---|---|---|
| Substitutes | Aggregate | Per Capita | Effectiveness | Cost of Organizing | ||||
| Numbers | Coverage | Resources | ||||||
| Pennsylvania Coal Association | other renewable energy issues | moderate | small | few (150) | extensive | huge | very low | large |
| Ratepayers (opposing) | none | small | moderate | substantial | complete | huge | very high | limited |
| PA Chamber of Business and Industry | other regulation issues | moderate | moderate | large | complete | huge | very low | large |
| Small System Owners (not in PA) | sell RECs elsewhere | small | small | considerable (~1,300) | little | moderate | very high | limited |
Lesson 2 Assignment
Weekly Activity 2
Deliverable
Complete "Weekly Activity 2," located in the "Weekly Activities" folder under the Modules tab in Canvas. The activity may include a variety of question types, such as multiple choice, multiple select, ordering, matching, and true/false (in some cases these require independent research and may be quantitative). Be sure to read each question carefully.
Unless specifically instructed otherwise, the answers to all questions come from the material presented in the course lesson. Do NOT go "googling around" to find an answer. To complete the Activity successfully, you will need to read the lesson, and all assigned readings, fully and carefully.
Each week, a few questions may involve research beyond the material presented in the course lesson. This "research" requirement will be made clear in the question instructions. Be sure to allow yourself time for this! You will be graded on the correctness and quality of your answers. Make your answers as orderly and clear as possible.
This Activity is to be done individually and is to represent YOUR OWN WORK. (See Academic Integrity and Research Ethics [52] for a full description of the College's policy related to Academic Integrity and penalties for violation.)
The Activity is not timed, but does close at 11:59 pm EST on the due date, as shown in Canvas.
If you have questions about the assignment, please post them to the "Questions about EME 444?" Discussion Forum. I am happy to provide clarification and guidance to help you understand the material and questions (really!). Of course, it is best to ask early.
Summary and Final Tasks
In this lesson, you learned about general types of nonmarket strategy and specific strategies for activities in institutional (government) arenas. The cast study, continued from the previous lesson, demonstrated the final steps of a nonmarket issue analysis. The findings of the analysis were presented in a tabular Nonmarket Analysis Summary Framework. The continuation of the Case Study information collection process provided additional in-depth experience with the structure and mechanics of renewable portfolio standards (RPS) programs.
You learned:
- the meanings pf public politics and private politics;
- three general types of nonmarket strategy for government arenas;
- details of many specific strategy types for use in nonmarket arenas;
- through the RPS Case Study, how to assess demand for and supply of nonmarket action;
- to apply data to the nonmarket analysis of issues related to renewable portfolio standard (RPS) programs.
Have you completed everything?
You have reached the end of Lesson 2! Double-check the list of requirements on the first page of this lesson to make sure you have completed all of the activities listed there.
3 Private Politics
Introduction
Overview of Lesson 3
In the previous lesson, we learned about public politics, strategies that apply to nonmarket action that takes place in government arenas. In this lesson, we consider strategies for nonmarket action that takes place outside of public arenas, called private politics.
What will we learn?
By the end of this lesson, you should be able to...
- explain the motivations behind private politics;
- list four ways that private politics affects the issues, interests, institutions, and information that comprise the nonmarket environment;
- demonstrate a range of specific strategies for nonmarket action in non-government arenas;
- apply a three-step strategy for evaluating nonmarket strategy alternatives;
- describe seven "tests" for evaluating alternatives and ethical decision making;
- list the ISOs seven core subjects for Social Responsibility;
- make a recommendation for nonmarket strategic action based on the outcomes of a nonmarket analysis.
What is due for Lesson 3?
The table below provides an overview of the requirements for Lesson 3. For details, please see individual assignments.
Please refer to the Calendar for specific time frames and due dates.
| REQUIREMENT | SUBMITTING YOUR WORK |
|---|---|
| Read Lesson 3 content and any additional assigned material | Not submitted. |
| Weekly Activity 3 | Yes—Complete Activity located in the Modules Tab. |
Private Politics

In the previous lesson, we dealt with nonmarket strategy in the arena of public politics, where firms and interest groups compete in the context of the institution of government for advantage on an issue. In this lesson, we will focus on private politics, when the competition between firms and other stakeholders takes place outside of the context of the institution of government
In this lesson, we will also carry forward with the RPS Case study. In parts 1 and 2 we established the issue and background, identified stakeholders, and assessed the demand for and supply of nonmarket action for each. In part 3 of the RPS Case Study, we will consider nonmarket strategy options based on the results of our issue analysis.
An Introduction to Private Politics (Baron, 2010, p. 90-91)

Many nonmarket issues are addressed in public institutions, …, which deal with lawmaking, regulation, and the legal system. The competition between firms and other interests [stakeholders] over the resolution of these issues in the context of the institutions of government is called public politics. Other nonmarket issues are addressed largely outside, but often in the shadow of, public institutions. These issues are advanced by the strategies of individuals, firms, interest groups, activists, and NGOs [non-government organizations] and range from direct pressure, as in the case of consumer boycotts, to attempts to influence public sentiment. The competition between a firm and these other groups over the resolution of issues outside of government institutions is called private politics.
Private politics can be motivated by self-interest as well as by broader concerns. In some cases, it arises because an individual becomes concerned about an issue, as in the instance [...] of the person who telephoned Larry King and said that his wife had died from brain cancer caused by radiation from heavy use of a cellular telephone. More often, private politics originates from interest groups, as when the U.S. labor unions act to demand higher wages and improved working conditions in the overseas factories supplying the apparel and footwear industries. [ …] Private politics is also initiated by activists, advocacy groups and NGOs that serve the interests of others in addition to the interests of their members. The causes these individuals, interest groups, and NGOs pursue are important components of the nonmarket environments, and the issues on their agendas are frequently thrust onto the agendas of firms. Understanding their concerns, organization, and strategies is essential for formulating effective strategies to address the issues they advance and the pressures they generate.
Private politics affects the issues, interests, institutions, and information that comprise the nonmarket environment. First, those initiating private politics can identify issues about which management either is unaware or has not understood as important to others, as in the case of the possible health risks from cellular telephone radiation. Similarly, the actions of Greenpeace calling attention to Shell UK’s plan to sink the oil storage platform, Brent Spar, in the North Atlantic generated intense private politics in Europe even though the plan had been approved by the UK government. Individuals and interest and activist groups thus play an important role in setting the nonmarket agendas of firms and in advancing issues through their life cycles. Oil companies now involve stakeholders as well as governments in developing disposal plans for oil platforms. Moreover, the issues these groups raise and the concerns they express may point in the direction of more effective and responsible management.
Second, these groups can affect the organization of interests by forming watchdog and advocacy groups and by mobilizing people to work for causes. These groups have been instrumental in advancing the causes of environmental protection, health, and safety protection for consumers, and civil and human rights. These organizations are an increasingly important component of the nonmarket environment.
Third, the pressure these groups exert can affect the institutional configuration of the nonmarket environment. In public politics their actions have led to new laws, expanded regulatory authority, court orders, legislative oversight activities, and executive branch initiatives. These groups were the prime movers behind the creation of the Environmental Protection Agency and the Consumer Products Safety Commission, and organized labor worked for the creation of the Occupational Safety and Health Administration [OSHA]. In private politics, activists have spurred the formation of private governance organization such as the Fair Labor Association and the Forest Stewardship Council, which govern the private regulation of labor practices in overseas apparel and footwear factories and in timber harvesting and forest management, respectively. This private regulation has been growing as an alternative to government regulation.
Fourth, individuals, interest groups, and activists provide information that influences public and private politics. Rachel Carson’s Silent Spring [a book, published in 1962 and credited by many as starting the environmental movement] spurred the environmental movement by calling attention to the harmful effects of DDT. Activists at the Earth Island Institute spurred a public outcry and boycotts of tuna products when they produced a film showing dolphins drowning in nets used to catch tuna.1The news media plays a major role in disseminating this information, and an important component of private politics strategies is to attract media coverage. […]
Regardless of whether these groups are right in their causes, their actions can damage a firm, its reputation, and its constituents. Some products, rightly or wrongly, have been doomed by the actions of activists. Ralph Nader’s attacks on the safety of the General Motors Corvair, for instance, contributed to the car’s elimination. Activists have been vocal opponents of agricultural biotechnology, causing delays in new products and increased costs. The strength of activists groups varies across countries. The opposition to agricultural biotechnology has remained moderate in the United States, as more products have been brought to market without the harmful effects claimed by their critics. Opposition to agricultural biotechnology, however, remains strong in much of Europe. Because of private politics, a major Swiss pharmaceutical company located biotechnology units just over the French border and connected those units by pipeline to its plant just inside Switzerland. In effect, the plant lies on both sides of the border with the biotechnology components located in France.
1Putnam, Todd. (1993). “Boycotts are Busting Out All Over.” Business and Society Review, 47-51.
To Read Now
At this point, please complete Reading Assignment 3--Private or Public Politics? (Baron, 2010, 95-96), located in the Lesson 3 module in Canvas.
Strategies of Private Politics
In private politics, stakeholders work to advance their position on an issue by using a strategy of direct pressure on one another, most often this is interest groups putting pressure on firms.
Boycotting
A boycott is a “concerted refusal to have dealings with (as a person, store, or organization) usually to express disapproval or to force acceptance of certain conditions” (Merriam Webster [104]). Boycotts may be made on an individual scale (e.g., there are stores where I don’t shop because of their politics) or by a group (e.g. the mining town in Colorado that boycotted [105] a nearby brewery for supporting a local environmental group that wanted to shut down a local coal mine). Boycotts may be organized from the bottom up or top down, with the cost of organizing greatly reduced by today’s technology.
However, do boycotts really have an effect on either the performance of firms or on their policies? Baron (2010, p. 22) reports that “nearly all targets [of boycotts] state that a boycott had no significant effect on their performance,” and that results overall vary by issue. However, as you will see below, boycotts can be impactful in some ways. In addition, even if the boycott does not achieve the desired goal, significant benefit may come to the organizer in terms of media coverage and publicity.
To Read Now
- Boycotts can be tricky business! Read "As BP Backlash Grows, So Do Calls For Boycott [106]," which provides details about a boycott related to the infamous Deepwater Horizon oil spill in 2010.
- For a short explanation of some implications of the power of social media regarding boycotts, please read "The Trump Era Boycott [107]" from The New Yorker magazine. This is a few years old, but as relevant as ever given the dominance of social media.
Naming and Shaming
This tactic identifies a specific firm that has an objectionable activity, product, or service and provides information about the perceived harm to the public. The objective is “to harm the target firm by damaging its brand, its reputation or the morale of its employees.” In dealing with interactions of this nature, a “trust gap” often comes into play where one party has greater credibility with the public than another. In their 2021 global survey [108], Edelman (a well-known "global communications marketing firm") found that more of the public trusts businesses (61%) than non-governmental organizations (NGOs) (57%), the government (53%), and the media (41%). (Feel free to explore the data in this survey, including the full report [109] - there is some fascinating info in there. For example, only 18% of folks who voted for Donald Trump in 2020 trust the media, as opposed to 57% of Biden voters. Also, trust in the media by Trump voters dropped from 33% to 18% between November and December 2020, i.e. the election and it's "aftermath" caused a 15 percentage point drop in trust in the media [as well as a 16% drop in trust in the government and even 6% drop in trust in business]. A 2007 survey highlighted the trust gap between consumers and corporations, reporting that “Sixty-eight percent of executives say that large corporations make a generally or somewhat positive contribution to the public good. Yet only 48% of consumers agree” (Bonini, Sheila M. J., McKillop, Kerrin and Mendonca, Lenny T., The McKinsey Quarterly, 2007, Number 2, pp 7 – 10).
Methods for applying pressure to a named “target” seek to get word out to the public by attracting media to an issue. This may include print, cable, and broadcast media, as well as social media and other Internet-based channels (e.g., YouTube, e-mail, blogging). To attract attention, groups may hold events such as demonstrations or press conferences to release data, studies, or allegations.
Naming and shaming can be done alone, for example when Donald Trump threatened the motorcycle company Harley Davidson [110] on Twitter with a "big tax" when it announced it was shifting some production overseas to avoid tariffs levied by the European Union. While former President Trump had limited ability to actually follow through with the threat (a tax would obviously be in the realm of public politics), his naming and shaming impacted Harley Davidson's image, and likely contributing to a proposed boycott [111] of the company (thus impacted private politics).
Note that any publicized boycott effectively constitute naming and shaming as well. Any number of examples could be cited, but this is a campaign from Marcellus Drilling News (MDN) [112] urging readers/members to boycott the clothing company Patagonia because it advocated against (among other things) a proposed natural gas pipeline in the Eastern United States. MDN names and shames Patagonia while explaining its rationale for a boycott. In short, it's difficult to run an effective boycott campaign without naming and shaming, but naming and shaming can be done without boycotting. (In related nonmarket news, Patagonia boycotted Utah's outdoor trade show [113] over a disagreement about Bears Ears National Monument.)
The party that initiates such an action will have a first-mover advantage, giving it the opportunity to frame an issue and make allegations that often take the target off guard, unprepared to make a quick and effective public response. In the Harley Davidson example above, it was difficult for the firm to counteract Trump's argument because he had successfully framed the issue as one of Harley Davidson needlessly killing American jobs, even though the EU tariffs were projected to cost the company upwards of $100 million in 2018 and that the tariffs were levied as a response to steel and aluminum tariffs levied by the Trump Administration. Often, by the time the "named and shamed" responds, the issue is already framed.
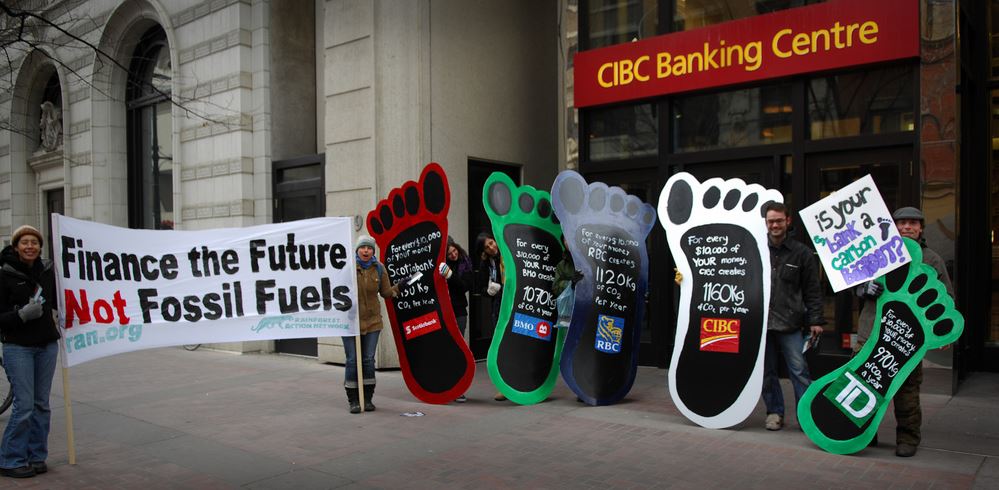
Target Individuals
In an effort to apply pressure related to an issue, a group may target an individual for activities related to the individual’s professional or personal roles. For example, a CEO who personally donates to or otherwise supports a group on the other side of an issue. Note that the difference between this and naming and shaming is that it targets individuals instead of firms.
In a particularly public targeting, Eric Schmidt, CEO of Google, was targeted for his professional role by the privacy advocacy group Consumer Watchdog [115]. The group launched an attack on Schmidt in response to what the group perceived as Google's intrusions on privacy. Consumer Watchdog ran a 15-sec clip on a large screen in Time Square that promoted a longer video, featuring a “ghoulish” character of the CEO in a creepy interaction with children (which many found offensive). Text stating "He is collecting your personal information" flashes across the screen. Viewers are then given a number to text to send a message to Google, telling them to stop collecting private information. You can see the (:15) video below:
Text EVIL to 69866 Message and data rates may apply.
Meet Google CEO Eric Schmidt. He’s collecting YOUR personal information. Tell Google to Stop Tracking Your Every Move.
Text EVIL to 69866.
Shareholder Advocacy
Interest groups may use a firm’s annual shareholders meeting as an opportunity to question the company in a venue where the exchange will be reported to the public. Shareholder resolutions that make it onto the proxy ballot may influence a firm's practices, regardless of whether or not the resolution passes. (These resolutions are non-binding, and thus do not have to be followed.) This may also result in a formal filing with the Securities and Exchange Commission (a move to public politics), as discussed in the previous lesson. We'll address this more in this week's Lesson 3 questions.
To Read Now
Nonmarket action by Exxon shareholders in the spring of 2021 resulted in what many in the energy industry have referred to as an "earth shattering" moment for the energy industry. Read the article below for details on this seminal event.
- "Exxon loses board seats to activist hedge fund in landmark climate vote [116]" Reuters, May 2021
Cooperation
In some cases, interest groups and firms will choose to work together to improve practices. What a novel idea! Baron (2010, p 98) cites the example of the Sustainable Forestry Initiative [117] (SFI) which was developed by the timber industry in cooperation with Conservation International and the Nature Conservancy. Admirable to some, but to others, SFI is a case of the “fox watching the hen house.” The Forest Stewardship Council (FSC) was also formed by a mix of "businesses, environmentalists, and community leaders [118]" from all over the world [119] and continues to be governed by a mix of firms and interest groups. They tout their "market-based approach" (a sure sign of private politics) to improving forestry practices. The Marine Stewardship Council, formed in the United Kingdom in 1996, has a similar history [120]. This organization is still very active, and was formed by a mix of private- and non-profit stakeholders that came together to address the sustainability of the world's fisheries.
Note that this is equivalent to coalition building in the realm of public politics.
Advocacy Science
An effective way to call attention to an issue is to “release” scientific data that supports a group’s position on an issue. To do this, a group may design and conduct a study or an investigation, then compile and announce the findings, or the group may seize on the release of studies done by others. Information in this form can add credibility to the claims being made, draw considerable public attention, and encourage sympathetic legislation.
This is a common strategy for many organizations of all political stripes. For example, the Union of Concerned Scientists (UCS) released a report [121] in 2015 that analyzes the risk to U.S. states based on over-reliance of natural gas. UCS is known as a progressive organization. The World Resources Institute [122] is a "global research organization" that publishes a variety of sustainability-based research reports, with a global focus. The CATO Institute [123] is a well-known libertarian think tank, and publishes reports supporting "free market" principles, while the Heritage Foundation [124] is a think tank that "promote(s) conservative public policies," and is often the go-to organization for conservative politicians in the U.S. Note that most of these organizations engage in other nonmarket activity, both public and private.
Check Your Understanding
The image above is from a protest in the Philippines in 2015. This was part of a campaign [127] by the anti-climate change environmental organization 350.org. The goal of this campaign is to have the Vatican Bank "divest" from fossil fuels, i.e., pull investments from fossil fuel-based industries. The divestment movement has been happening worldwide, mostly on college campuses, with mixed success.
Can you name the private nonmarket strategies being employed?
ANSWER:There are at least two strategies evident here. The Vatican is being "named and shamed," and thought it's being done in a relatively benign way, the protesters "targeted" Pope Francis (note the sign calling him out by name). If a firm (e.g., a solar company or other business) were involved in the protest, then "cooperation" was likely taking place between the firm and 350.org, which is an interest group.
To Read Now
One nonmarket movement that has picked up steam in the past few years is "divestment." The main targets have been university endowments [128], which are investment funds run by universities that can run into the billions of dollars. The top 10 endowments in U.S. colleges alone have nearly $200 billion [129]. However, as you'll see in the articles below, many other institutions - pension funds, cities, non-profits, and some banks - have joined this movement. The main goal of this movement has been to convince endowment holders to divest from industries and firms that interest groups see as socially- and/or environmentally-irresponsible, the primary focus being the fossil fuel industry.
- "What is Fossil Fuel Divestment? [130]." The Renewable Energy Hub, September 2018.
- "Are Fossil Fuel Divestment Campaigns Working? A Conversation With Economist Robert Pollin. [131]" Truthout, May 2018.
- "The Case For Fossil Fuel Divestment [132]" Forbes, February 2021.
Optional Reading
- "The Movement to Divest from Fossil Fuels Gains Momentum [133]." The New Yorker, December 2017.
Nonmarket Strategy and Ethics
The information analysis framework described in previous lessons is used to guide the formulation of nonmarket strategy. Initially, multiple possible nonmarket strategies are generated for consideration--which nonmarket action(s) best serve our interests? Baron (2010, p 50) recommends that these alternative strategies be evaluated in three stages: Screening, Analysis, and Choice.
The screening stage identifies and eliminates nonmarket strategy alternatives that are a) against the law, b) contrary to company/organization policy or c) violate widely accepted ethics principles.
The analysis stage relies on economics, political science, and other social sciences to predict the actions and reactions of other stakeholders. The analysis stage also takes into account moral motivations of nonmarket behavior and how others may react to the actions taken.
In the third stage, a choice is made. The objective for making the selection is typically value creation, measured in terms of the impact on stakeholder(s). However, if the issue involves moral concerns, then principles of well-being, rights, and justice must be considered.
Ethics
One reason a strategy may be screened out is because it violates accepted ethics. But what does this mean? Ethics is a systematic (or codified) approach to moral judgments. Ethics deals with matters of human well-being, liberty, and freedom and is based on moral standards that are impartial, universal, and independent of governments and authoritative bodies. But making an "ethical" decision is often easier said than done. For example, drug testing in the workplace is ethical in one sense, if it keeps society safe. But unethical in another sense if it violates a worker's right to privacy. These questions can be particularly challenging for energy industries where corporations compete in a marketplace under a long shadow of powerful nonmarket forces loaded with uncertainty--involving the environment, regulation, and customers who themselves are struggling to balance their energy needs, pocketbooks, and moral compasses. Are any of us driving the car we think is most "right"? More likely, we are driving a car we can afford and that is "right enough."
Business ethics is the application of ethics principles to issues that arise in business. ...business ethics pertains to situations in which individuals are in an organizational position and act as agents of the company and its owners. [...] In an organization role, a manager must reason about situations in which virtue is not always present, conceptions of what is good or right differ among individuals, and interests are in conflict. [...] Good ethics is not necessarily beneficial to an individual or profitable for a firm; however, good ethics is good for society and is a requirement of good management. Although good ethics may not always be profitable, unethical behavior can result in substantial losses (Baron, 2010, p. 655).
The following are four reasons (Baron, 2010, p. 711) why it is important that decision makers maintain a sensitivity to moral dimensions of an issue:
- It can help managers avoid wrongs that may otherwise result from a narrow focus on the firm's interests.
- It can help management anticipate nonmarket actions and pressures.
- It can render managers more likely to make decisions that serve the long-run interests of society and ultimately of business itself.
- It addresses the context of corporate social responsibility found in ethics principles.
But making ethical choices, even by even the most well intended, can be difficult. Many of us have personally been in situations where we wanted to do the "right" thing, but really didn't know what the right thing was. Tell, don't tell? In business, decisions need to be made in situations where there are competing moral claims that require judgments about the effects of decisions on individuals, their rights, and their well-being. How does one do this?
Davis (1999) recommends seven "tests" for evaluating alternatives and ethical decision making:
- Harm test: Does this option do less harm than alternatives?
- Publicity test: Would I want my choice of this option published in the newspaper?
- Defensibility test: Could I defend choice of option before a congressional committee or committee of peers?
- Reversibility test: Would I still think the choice of this option good if I were adversely affected by it?
- Colleague test: What do my colleagues say when I describe my problem and suggest this option is my solution?
- Professional test: What might my profession's governing body for ethics committee say about this option?
- Organization test: What does the company's ethics officer or legal counsel say about this?
A particularly egregious (and illegal) breach of corporate ethics was revealed in 2015 when it was found that Volkswagen had installed so-called "defeat devices" in millions of their vehicles. These devices were pieces of software that would alter the operational characteristics of the engine when they determined that an emissions test was being run. When this happened, the emissions (e.g., carbon dioxide and nitrogen) would be lower than they would be under standard operating conditions. Note that this precipitated both nonmarket (e.g., fines by the U.S. EPA) and market (car sales slumping) activity. Skim through the following summary, which is the best I've found of this major international scandal. Can you identify any of Davis' ethical tests that were not violated? Seriously - go through them one-by-one and think about it! (Note that the firm is still dealing with consequences of this action, and that more details [134] of unethical and illegal behavior have been surfacing.)
- "Volkswagen: The scandal explained [135]." BBC, December 2015.
Corporate Social Responsibility
Many companies now have well-publicized "Corporate Statements of Social Responsibility," "Codes of Ethics," and even positions with a title such as Ethics Officer. Baron (2010, p. 724) cites two factors contributing to the spread of statements of social responsibility:
- a belief by some firms that they should be accountable for conduct beyond profit maximization, and
- a defensive motivation intended to avoid private politics led by interest groups or to preempt public politics and additional government regulation.
What does this mean, exactly, a "corporate statement of responsibility?" The International Standards Organization (ISO) has set forth a voluntary standard for social responsibility in an international setting. The figure below illustrates the content addressed in the standard, including seven core subjects of social responsibility: organizational governance, human rights, labour practices, the environment, fair operating practices, consumer issues, and community involvement and development.
To Read Now
Visit the International Organization for Standardization (ISO) [138]
Read the landing page, then click on the "Standards" tab, then reread the page and watch the short video, "What ISO standards do for you." (transcript of video [139])
Read the page ISO 26000 - Social Responsibility [140] (transcript of Social Responsibility video [141]) (not required, but watch video if you have 47 seconds!)
On this same page, click the link to "ISO 26000:2010 Guidance on Social Responsibility." Click on the Abstract Preview and read the first few paragraphs of "Introduction" closely (you can stop at Box 1), and scan the remainder.
RPS Case Study, Part 3
The following Case Study is written by the course designer. The framework of this Case Study reflects actual Pennsylvania policy and data. All information about stakeholders, especially assessments related to the likelihood of participation in nonmarket action and the strategy that may or may not be evoked is the author's opinion and presented in a manner to best demonstrate the lesson content of this course. This Case Study does not necessarily represent the actual position or strategy held or planned by any named stakeholder.
Case Study, Continued...
In the first part of this Case Study, we identified the issue and provided background, including a full description of the principles of Renewable Portfolio Standards (RPS) policy. In the second part, we considered the issue from the viewpoint of a wide range of stakeholders. Using an orderly format and presentation, we formulated a description of each stakeholder, initial position, and an assessment of all factors related to the demand for and supply of nonmarket action. In this part 3, we will now present an analysis of our findings and suggest strategy options.
The following nonmarket strategy is prepared from the point of view of the Mid-Atlantic Renewable Energy Association (MAREA), which supports the passing of SB 300.
I. Arena
Recall that the issue is: "Do you support or oppose PA SB 300?." Since this bill is being debated in the PA Senate, that is the arena.
II. General Strategy
First we will consider the three general strategies (of public politics):
Representation strategy (mobilizing voters). MAREA has low cost of organizing and extensive coverage and they have a history of mobilizing voters. This may be a good option.
Majority building strategy (direct recruiting of public office holders). MAREA has some experience in this area, but doesn’t have established access to or relationships with many Legislators (especially those opposed). As a nonprofit, MAREA is also limited in its political activities. These limitations will be considered carefully later in this case study as we evaluate individual strategies.
Informational Strategies (data and understanding about an issue). Within its membership and board, MAREA has deep experience and knowledge with the issue at hand. The bill itself is not very complicated, but the implications have some nuance to them, e.g. how an RPS works and how they impact SRECs. In addition, most people have no experience with or understanding of SRECs and how they impact the solar market. It may be worthwhile to educate constituents in order to foster support.
III. Consideration of Individual Strategies
Lobbying: In a lobbying strategy, MAREA would seek to influence the votes of Legislators by accessing the lawmakers directly and providing strategic information. Because MAREA is an IRS Section 501(c)(3) Organization (a type of non-profit), it is limited in how much lobbying action it is allowed to take. This strategy will be screened out because it is “contrary to the law.”
Electoral Support: In an electoral support strategy, MAREA would focus on providing resources that help candidates during elections. Again, because of its Section 501(3)(c) status, MAREA is prohibited from taking these actions.
Grassroots: A grassroots strategy would build on the connection between voters and their elected officials, and may be used as part of an informational or representation strategy. With its considerable number (8,000), extensive coverage and low cost of organizing, this is a good strategy. Again, however, restrictions apply because of their 501(c)(3) tax status, and the nature of the communication would need to be primarily educational and non-partisan.
Coalition Building:
In a coalition building strategy, MAREA would work with other stakeholders who support the bill. To this end, MAREA had recently established a reciprocating relationship with PA-SEIA, where the two organizations provide one another with “honorary” memberships. PA-SEIA is a section 501(c)(6) nonprofit with far fewer restrictions on its legislative and political activities.
PennFuture, another nonprofit supporting passage of this bill, is much larger than MAREA and PA-SEIA and has a broader focus. MAREA works with PennFuture analysts on relevant policy issues as they arise and directs MAREA members to PennFuture resources and events. The opportunity for a more formalized coalition is limited by the different size and focus of the organizations.
System owners in PA (large and small) are assessed to be highly motivated (a “large” to “substantial” demand for market action) but the predicted level of actual market action is low due to the high cost of organizing. Opportunities for coalition with these promising stakeholders appear limited.
Solar installers are also a promising group but without structure or organization. The possibility of forming an effective coalition seems limited.
Ratepayers supporting the passage of HB1580 have a low demand for action and very high cost of organizing, making them, all in all, a poor option for coalition building.
Testimony: Opportunities for testimony on this issue are not available and will not be part of the planned strategy. No one has been invited to testify about the bill, there is no legal action being taken (i.e. no opportunities for testifying in court), and the bill is not open for public comment. If opportunities arise, they will be considered on a case by case basis.
Public Advocacy: In a public advocacy strategy, MAREA would communicate directly to the public conveying a particular position on an issue. Again, activities of this nature are limited by MAREA’s IRS standing; however, non-partisan educational communications can be done without restraint. Educating the general public about how an increased RPS would positively impact the solar industry without stating specific support for SB 300 is something that could be done, for example.
Judicial Actions: Judicial strategies are not applicable to this issue at this point. The current RPS is legal, so there is no valid basis for a lawsuit.
Proposed Strategy: Regarding its ability to participate in public politics, MAREA is constrained by its IRS categorization as a Section 501(3)(c) nonprofit. It may carry out some activities that attempt to influence legislation, but these may not be a “substantial” part of the organization’s activities. Other activities, however, such as educational meetings, the preparation and distribution of educational materials, or other efforts related to public policy issues in an educational manner may be performed without violating the rules for a 501(3)(c) organization.
IV. Proposed Strategy
Recognizing this, and the untapped potential demand for action on the part of system owners in PA, MAREA proposes the following strategy:
- Conduct Statewide Research of Solar Electric System Owners and Installers
- A state rebate program for solar was started in May of 2008 and led to the installation of thousands of new solar electric systems. As part of the application process, system owners were required to provide details about the installed system, including technology, design, address, and contact info. This information is collected and held by the PA Department of Environmental Protection (DEP). It is currently unavailable to the public. MAREA will use the Right to Know Law (RTKL) to request and hopefully receive access to this data.
- Assuming that contact info for system owners in PA is successfully acquired through the RTKL, MAREA will prepare and execute a survey of each of these owners. The survey will cover a variety of issues, including how the owner is currently selling RECs and issues the owner may be having or anticipates having on this front.
- Simultaneously, MAREA will prepare and execute a survey of solar installers. This survey will also cover many issues, including the impact the declining SREC market is having on their business and jobs.
- The combined survey results will be compiled into a report, “The State of Solar in PA, 2011.” To the extent possible, results will be tabulated geographically.
- A press release will be issued announcing the availability of the report and a highlight of findings. A press conference will be held to announce the findings. Copies of the report will be distributed to state-level policy makers. The report and its findings will be published on the MAREA web site, along with a webinar interpreting the results.
- Without overreaching 501(3)(c) status, a simple campaign will be developed to educate on the content of HB1580 and instruct those who wish to take action how to do so: legislative contact info, links to PA-SEIA, and PennFuture. The campaign will use both e-mail and social media to reach out to MAREA members, system owners, and solar installers.
- The report will be repeated on a yearly basis.
- Collect and disseminate information from third party sources to policy makers. For example, the recent (at that time) study Solar Power Generation in the US: Too expensive, or a bargain? [142], which looks at benefits of solar to public (ratepayers and taxpayers).
- Report on status of all solar policy at monthly meetings and in monthly newsletter.
-
Through events, white papers, and speaking invitations, work to educate MAREA members and interested public on topics related to solar technology, policy, markets, rules, and issues.
If contact info for system owners in PA is successfully acquired through the RTKL, the cost of organizing will drop considerably. This will change the nonmarket analysis for this stakeholder. With the easier mobilization of this large group that has complete regional coverage, the predicted amount of nonmarket action will go from limited to high.
V. Status
January 2014: The Solar Rebate Program ended in Dec 2013 (all funds were distributed). A Right To Know Request was filed with the DEP and on Jan 13, 2014, MAREA received the full records for ALL solar electric systems (7,000) funded under this 4-1/2 year program. Meanwhile, new bills were introduced to revise the PA AEPS; all unsuccessful to date. MAREA will use the data awarded through the Right to Know Request, to contact and organize solar electric system owners for future opportuities.May 2023: No action has been taken on updating PA AEPS.
Lesson 3 Assignment
Weekly Activity 3
Please review Canvas calendar for all due dates related to your Nonmarket Analysis Case Study.
Deliverable
Complete "Lesson 3 Quiz," located in the Lesson 3 Module. The activity may include a variety of question types, such as multiple choice, multiple select, ordering, matching, true/false, and "essay" (in some cases these require independent research and may be quantitative). Be sure to read each question carefully.
Unless specifically instructed otherwise, the answers to all questions come from the material presented in the course lesson. Do NOT go "googling around" to find an answer. To complete the Activity successfully, you will need to read the lesson, and all assigned readings, fully and carefully.
Each week, a few questions may involve research beyond the material presented in the course lesson. This "research" requirement will be made clear in the question instructions. Be sure to allow yourself time for this!
This Activity is to be done individually and is to represent YOUR OWN WORK. (See Academic Integrity and Research Ethics [52] for a full description of the College's policy related to Academic Integrity and penalties for violation.)
The Activity is not timed, but does close at midnight EST on the due date as shown on the Calendar.
If you have questions about the assignment, please post them to the "Questions about EME 444?" Discussion Forum. I am happy to provide clarification and guidance to help you understand the material and questions (really!). Of course, it is best to ask early.
Summary and Final Tasks
In this lesson, you learned about general types of nonmarket strategy and specific strategies for activities in non-government arenas (private politics). The case study continued from the previous lessons, and concluded here developed a nonmarket strategy based on the outcomes of the nonmarket analysis. The case study introduced new concepts related to non-profit organizations and their role in the nonmarket arena.
You learned:
- the motivations behind private politics;
- four ways that private politics affects the issues, interests, institutions, and information that comprise the nonmarket environment;
- a range of specific strategies for nonmarket action in non-government arenas;
- a three-step strategy for evaluating nonmarket strategy alternatives;
- seven "tests" for evaluating alternatives and ethical decision-making;
- the ISO's seven core subjects for Social Responsibility;
- how to make a recommendation for nonmarket strategic action based on the outcomes of a nonmarket analysis;
- the roles and limitations of organizations classified by the IRS as section 501(c) nonprofits.
Have you completed everything?
You have reached the end of Lesson 3! Double-check the list of requirements on the first page of this lesson to make sure you have completed all the activities listed there.
4 Climate Economics and Policy
Introduction
PLEASE NOTE that this course has not been updated for the Fall 2020 semester. The content may change prior to the beginning of the semester.
Overview of Lesson 4
In the previous lessons, we have learned about nonmarket analysis, public politics (nonmarket action that takes place in government arenas) and private politics (nonmarket action that takes place outside of public arenas). In this lesson we are going to examine several specific nonmarket developments of special significance to energy companies: shifts in corporate reporting of externalities (including physical impacts of climate change on energy industry), social cost of carbon (SCC), and energy return on energy invested (EROI).
What will we learn?
By the end of this lesson, you should be able to...
- describe the relationship between climate change, corporate reporting, and investor risk;
- explain the SEC's interpretive guidance related to corporate reporting requirements triggered by climate change;
- define the social cost of carbon (SCC) and explain its application;
- discuss the political and business ramifications of SCC;
- apply the SCC to policy assessment;
What is due for Lesson 4?
The table below provides an overview of the requirements for Lesson 4. For details, please see individual assignments.
Please refer to the Calendar in Canvas for specific time frames and due dates.
| REQUIREMENT | SUBMITTING YOUR WORK |
|---|---|
| Read Lesson 4 content and any additional assigned material | Not submitted. |
| Weekly Activity 4 | Yes—Complete Activity located in the Modules Tab in Canvas. |
| Case Study Part I - Individual submissions | Upload to Canvas Dropbox called "Submit individual portion of Case Study Part I here" and provide it to your Team Leader |
Climate Change Risk
Reporting Climate Change Risk
To Read Now
For an excellent summary of the history, underlying principles, an examples of (the lack of) corporate reporting of externalities, please read "Corporate Reporting and Externalities," an essay by Jeff Honhensee in the book, Is Sustainability Still Possible? State of the World 2013 [143], by the WorldWatch Institute. (In case you are not familiar with it, the "State of the World" series is great! I highly recommend it.) You will find this reading under the Lesson 4 tab in Canvas.
- Note that as of June of 2021, the International Integrated Reporting Council (IIRC, mentioned by Honhensee) and the Sustainability Accounting Standards Board (SASB) merged to form the Value Reporting Foundation [144] in an effort to streamline global efforts toward corporate social responsibility and risk disclosure. As they state in their overview [145], the "Value Reporting Foundation envisions a future in which a coherent, comprehensive system of corporate reporting helps bring the interests of businesses, investors and broader society into close alignment."
In the reading above, Honhensee makes a strong case for corporate reporting of externalities as a company's responsibility to the public, which by definition bears the costs, as well as to its investors. Remember, externalities are the costs (or benefits) from an economic transaction that are borne by someone who did not play a role in said transaction, and those costs or benefits are not integrated into the price of the transaction. These considerations (as well as a few others) are now widely referred to as Environmental, Social, and Governance (ESG). For a summary of ESG considerations, see this short article [146] from Investopedia.
Externalities
It is particularly important from a sustainability perspective to consider all of the costs of economic transactions. The total cost to society is the social cost, the costs to those who took part in the transaction are the private costs, and costs to anyone that did not take part in the transaction are the external costs. This can be summarized in an equation:
- social cost = private costs + external costs
If all costs to society are fully integrated into the price of the good/service, then the social cost = private cost, and thus there is no external cost, and no negative externality. However, costs are often externalized, and so social cost often exceeds the private cost. In other words, the total cost to society is often not fully reflected in the price of a good/service. Pollution is the classic example of a negative externality. Let's say I run a good-producing factory that pollutes the air or water - however slightly - and this pollution results in costs (health issues, property values, food availability, etc.) to others, but I do not have to pay for this cost. In this scenario, my private cost is less than the social cost. The difference between those two costs is the negative externality. Negative externalities tend to be overproduced because the good/service is less expensive than it would be if all costs were integrated.
It follows that if all costs are internalized and all of those affected properly compensated, externalities are eliminated. This can be attempted through mechanisms such as fines for violations and other legal penalities, but these only work if the money from the fines are provided to those that suffered the externalized consequences. Unfortunately, this is rarely the case. In a perfect world, everyone impacted by every transaction would be compensated accordingly.
Positive externalities occur as well, and happen when the social benefit is greater than the private benefit. Unfortunately, these goods/services tend to be underproduced because the person who benefits pays more than they would if there were no externalized benefits. Education is a good example of this: You all are paying for your Penn State education, and you receive benefits from that (knowledge, confidence, possibly a pay increase or better job, a cool diploma to hang on your wall, etc.). However, society as a whole benefits from having an educated populace, e.g. by realizing more technological and business innovation. If all of these benefits were integrated into the cost of education, then it would be less expensive. Thus, education is generally more expensive than it would be if all benefits were integrated into the cost. Note that things like grants and scholarships help offset some of this, as does taxpayer-funded education.
One final addendum to this explanation: Some economists consider anything that happens to an external party an externality - whether or not they are properly compensated - since they did not decide to take part in the transaction. If said party is not properly compensated they consider it a negative externality, and if they do not pay an appropriate cost it is a positive externality. For purposes of this course however, an externality only occurs when the social cost or benefit exceeds the private cost or benefit, as described above.
Disclosure of Climate Change-Related Business Risks
Upfront acknowledgment of risks to the business can help management anticipate, and plan for, future developments and increases investor confidence. In other words, what may have been once seen as a pure externality can, with a turn of events, cost a company and its investor's real money. For energy companies, many externalities fall into the category of risks that may suddenly become costly to the business, but probably none more so than externalities related to climate change. Perhaps more importantly in the near term, potential nonmarket action - particularly in the public sector, but also via private political action - can pose significant business risk(s) to a firm. Most of these actions are related to climate change externalities.
The Securities and Exchange Commission (SEC) is tasked with assuring firms provide reasonable disclosure of business risks to their shareholders. In 2010, the SEC issued the first (voluntary) Interpretive Guidance on Disclosure Related to Business or Legal Developments Regarding Climate Change [147]. The guidelines did not create new legal requirements but provide guidance on existing disclosure rules that may require a company to disclose the impact business or legal developments related to climate change may have on its business.
To Read Now
Read the SEC's January 27, 2010 Press Release regarding disclosure of climate change-related risks. This guidance is still seen as a major turning point in climate disclosure initiatives in the U.S.:
- "SEC Issues Interpretive Guidance on Disclosure Related to Business or Legal Developments Regarding Climate Change [147]." U.S. Securities and Exchange Commission, Jan. 27, 2010
From the press release:
Specifically, the SEC's interpretative guidance highlights the following areas as examples of where climate change may trigger disclosure requirements:
- Impact of Legislation and Regulation: When assessing potential disclosure obligations, a company should consider whether the impact of certain existing laws and regulations regarding climate change is material. In certain circumstances, a company should also evaluate the potential impact of pending legislation and regulation related to this topic.
- Impact of International Accords: A company should consider, and disclose when material, the risks or effects on its business of international accords and treaties relating to climate change.
- Indirect Consequences of Regulation or Business Trends: Legal, technological, political and scientific developments regarding climate change may create new opportunities or risks for companies. For instance, a company may face decreased demand for goods that produce significant greenhouse gas emissions or increased demand for goods that result in lower emissions than competing products. As such, a company should consider, for disclosure purposes, the actual or potential indirect consequences it may face due to climate change related regulatory or business trends.
- Physical Impacts of Climate Change: Companies should also evaluate for disclosure purposes the actual and potential material impacts of environmental matters on their business.
Optional Reading
If you'd like, you can read through the thick, but descriptive, legalese of the full SEC Guidance in the Federal Register [148].
Why did the SEC decide to issue these new guidelines? A press release [149]from Ceres [150] and the Environmental Defense Fund [151] (both 501(c)(3) non-profits), described it this way, "Today’s decision comes after formal requests by leading investors for the SEC to require full corporate disclosure of wide-ranging climate-related business impacts – and strategies for addressing those impacts – in their financial filings. More than a dozen investors managing over $1 trillion in assets, plus Ceres and the Environmental Defense Fund, requested formal guidance in a petition filed with the Commission in 2007, and supported by supplemental petitions filed in 2008 and 2009." Addressing the way risks of externalities related to climate change are being included in corporate reporting is seen as a matter of protecting investors. For many, protecting the public and the environment would be sufficient cause. But here, the winning nonmarket strategy in the regulatory arena was the one that built a successful case, in the eyes of the SEC, by connecting the need to disclose climate-change risks with the need to protect investors.
To Read Now
One of the issues with guidelines like the ones issued by the SEC is that they are, well, guidelines. Read the article below for some insight into additional nonmarket actions proposed to remedy some of the perceived shortcomings of the SEC's guidance. You are welcome to read the full article (it is not very long), but you must at least read the first 5 paragraphs.
- "Improving Climate Risk Disclosures from within the SEC: Moving Forward Absent the Climate Risk Disclosure Act of 2018 [152]" Keziah D. Groth-Tuft, American Bar Association, July 22 2019.
One way that stakeholders can (potentially) influence an issue is by provideing public comments on legislative rulemaking by public institutions. Federal agencies such as the EPA are charged with implementing laws passed by Congress. Before these rules are entered into their final form in the Federal Registry and thus enforceable, they must be published and made available for public comment, usually for 60 days. All "substantive" comments must be taken into consideration before the rule is made final. All public comments are published publicly and entered into the Federal Registry. (Here [153]is a good summary of how this process works by the Public Comment Project.) In March of 2021, the Acting Chair of the SEC submitted a climate disclosure rule for public comment. Please read about it below.
- "Public Input Welcomed on Climate Change Disclosures [154]" by Allison Herren Lee, Acting Chair of the SEC, March 15, 2021. You can skip the "Questions for Consideration" section if you wish.
Optional Reading
As noted above, all comments are made public. For an example of a comment on this rule from multi-trillion dollar asset manager BlackRock, see this document [155]. This is part of the sausage-making process of federal legislation!
As I'm sure you can imagine, and as indicated in the article above, the SEC's decision in 2010 has not been embraced by everyone. The article below provides some insight into one nonmarket approach to mitigate its impact. This Posey Amendment was mentioned in the article above.
"A New Debate Over Pricing the Risks of Climate Change [156]" The New York Times, Sept. 26, 2016.
As indicated in the article, assessing the financial risks posed by climate change are not limited to the U.S. In 2016, the Financial Stability Board (FSB) of the Group of 20 [157], usually referred to as the "G20", asked [158]its Task Force on Climate-related Financial Disclosures [159] (TCFD) to "develop a set of voluntary, consistent disclosure recommendations for use by companies in providing information to investors, lenders, and insurance underwriters about the financial risks companies face from climate change." (The G20 is a forum of wealthy and economically emerging countries of the world. The official group is made up of government representatives such as finance ministers, heads of state, and central bank governors. At the annual G20 meetings, the representatives consult with many international organizations such as the OECD, the World Trade Organization, International Monetary Fund, as well as private sector businesses, non-governmental organizations, and more. The G20 [157]"traditionally focuses on issues concerning global economic growth, international trade and financial market regulation.") It has become apparent to G20 members that issues related to climate change pose risks to businesses worldwide, and the establishment of the TCFD is an attempt to provide guidance on how to manage those risks.
As of their most recent report in September of 2020, over 1,500 organizations [160] from across the world had expressed support for the TFCD (up from 830 organizations in July of 2019). There are companies and organizations from six continents in support, including banks such as Bank of America in the U.S. and Barclays in the U.K., energy companies such as NRG Energy in the U.S. and Royal Dutch Shell in the Netherlands, pension funds from all over the world, transportation companies such as Qantas (Australia airline) and Maersk (Danish shipping), and more. The TCFD is still very active, and gaining more member support every year.
Optional Reading
The TCFD released its first full report [161]on December 14, 2016; you may be interested in reading it. For a summary of the report, read the speech by the Chair of the G20 FSB below.
- "Remarks on the launch of the Recommendations of the Task Force on Climate-related Financial Disclosures [162]," Bank of England, December 14th, 2016.
- The most recent report was provided in 2020. Feel free to read or browse this report. "Task Force on Climate-related Financial Disclosures 2020 Status Report [160]", TCFD, September 22, 2020.
Planning for Climate Change Risk
With the risks of climate change-related externalities explicitly acknowledged, management is in a position to anticipate, plan for, and manage the risk (physical, policy, regulatory or otherwise). One way to mitigate these risks is by placing a price on carbon emissions, usually expressed in dollars (or whatever the relevant currency) per metric ton (tonne) of emissions. Carbon markets have been established at different scales throughtout the world, but companies are increasingly utilizing an internal cost to reduce risks and spur carbon reductions.
To Read Now
- For a good synopsis of different types and examples of carbon pricing, read "Companies are moving faster than many governments on carbon pricing [163]" by the Economist. (You may have to register for a free account to see the article.) If you cannot access the full article, the key content is quoted below.
- The world's largest asset manager recently announced that climate change will be a consideration in its investment strategies. For a brief summary, read "World's Largest Asset Manager Puts Climate At The Center Of Its Investment Strategy [164]" (NPR, January 2020).
Optional Reading
- "Microsoft Leads Movement to Offeset Emissions With Internal Carbon Tax [165]" to learn about the robust internally-focused actions that Microsoft has taken, which was mentioned in the article above. (A .pdf link is also available [166] in case you cannot access the link.)
- For a glimpse at some of the international movement on internal carbon pricing, feel fre to read the Summary and Section 1 ("What is the purpose of assigning an internal price to GHG emissions?") of the Institute for Climate Economics' "Internal carbon pricing: A growing corporate practice [167]" from November of 2016.
From the Economist article:
"Of the 6,100-odd firms which report climate-related data to CDP, a British watchdog, 607 now claim to use “internal carbon prices”. The number has quadrupled since CDP first began posing the query in its annual questionnaire three years ago. Another 782 companies say they will introduce similar measures within two years...
Corporate carbon-pricing comes in two main varieties. The first involves business units paying a fee into a central pot based on their carbon footprint. Microsoft, for example, charges all departments for every kilowatt-hour of dirty energy they contract or air mile flown by executives, to help meet firm-wide climate targets. This payment, equivalent to $8 per ton of carbon dioxide, is designed to encourage those who can cut emissions most easily to do more, and nudge everyone to do something, says Rob Bernard, who oversees the software giant’s environmental activities.
Tracking exactly how much of the power a business unit consumes comes from coal, say, is not always straightforward. Fee-based systems like Microsoft’s therefore remain rare. Although some smaller firms have toyed with them, Disney is the only other big multinational to use one. Many more firms use shadow carbon prices to stress-test investments for a world of government-mandated levies...
In his day job as chief executive of Royal DSM, Mr Sijbesma has made the Dutch food producer examine all proposed ventures to check whether the sums still add up if a ton of carbon dioxide cost €50 ($60), well above the going rate of €6 or so in the European Union’s emissions-trading system, which is kept low by an oversupply of permits. Where they do not, alternative feedstocks or cleaner energy suppliers must be found. If a project still looks unprofitable, it could be discarded altogether.
Businesses ranging from European supermarkets (France’s Carrefour and Britain’s Sainsbury’s) to Indian cement-makers (ACC, Ambuja and Dalmia) espouse shadow pricing. Some add flourishes. Besides assessing capital projects at €30 per ton of carbon dioxide, Saint-Gobain, a French maker of building materials, factors in a higher price of €100 per ton when choosing between long-term research-and-development projects. AkzoNobel, a Dutch chemicals giant, uses €50 per ton for most investments, but double that for those with lifetimes of 30 years or more.
These are some of the most ambitious schemes; many others lack bite. Plenty of firms which declare their shadow prices set them below $10 per ton of carbon dioxide. As John Ward of Vivid Economics, a consultancy, points out, that is “just high enough so it has no real impact”. Companies which use higher prices should treat them as more than a “spreadsheet exercise”, counsels one climate-change expert. Oil majors have priced in carbon for years when assessing exploration projects. But there is little evidence that high-price scenarios swayed their investment decisions."
The Carbon Disclosure Project (CDP) [168], an English non-profit that publishes environmental impacts of companies across the world, reported that as of 2020 more than 2,000 companies worldwide either utilized internal carbon pricing. As indicated in the articles above, there are different ways that companies do this. Microsoft actually charges individual units within its company based on their energy-based emissions, then uses these (millions of dollars of) charges to implement energy efficiency (e.g., building efficiency upgrades) and clean energy (e.g., solar, wind) measures in company units. Disney, Shell, Novartis, and Nissan also use this model.
Many other companies [169] are using internal carbon pricing when determining cost-benefit projections of potential projects and investments. This is what the Economist referred to as "shadow carbon pricing" and the Institute for Climate Economics referred to as a "shadow cost." Some of the world's major companies (including ExxonMobil and Shell!) price carbon internally. Though the price and application can vary widely by company, it has the effect of making projects that will result in lower emissions look more economically attractive than they otherwise would.
Social Cost of Carbon
In policy making, we must consider the cost of a proposed policy against the benefits of the proposed policy. How much would it cost taxpayers? How much would it benefit tax payers?
In the case of policies designed to address climate change, how does government put a value on the benefits of reducing emissions? What is saving a ton of CO2 emissions worth to tax payers? A mechanism used to give a value to emission reductions is called the social cost of carbon (SCC). It puts a dollar value of the (calculated/estimated) costs to society caused by a single ton (or tonne) of CO2 emissions over the lifetime of said emissions. In other words, the SCC is the calculated cost, in dollars, of the social cost of carbon emissions. Remember that social cost = private cost + external cost. Since there is no actual price for emissions in the U.S., there is no private cost. Thus, the social cost is equal to the external cost. These costs are entirely borne by society.
The SCC is set by the federal government [170] and is used to determine the value to taxpayers of proposed policies designed to reduce CO2 emissions. As such, it is a matter of public politics with a wide range of highly motivated and engaged stakeholders.
To Read Now
- This article provides some insight into one of the first examples of major public sector action on which carbon pricing had a major impact. Pay special attention to how SCC was used in the cost-benefit analysis for fuel efficiency standards. "Developing a Social Cost of Carbon for US Regulatory Analysis: A Methodology and Interpretation [171]" (2013, Review of Environmental Economics and Policy [172]). Read Abstract, Introduction and Conclusions.
Calculating and utilizing the SCC is a complicated and controversial topic. The following articles are not meant to be comprehensive, but to provide a snapshot of the science behind, and some competing views of SCC.
- For an excellent summary of the history of SCC, the Trump Administration's alternative, and some recent research-based estimates of the SCC, read "The Trump EPA is vastly underestimating the cost of carbon dioxide pollution to society, new research finds [173]" by Dana Nuccitelli of Yale Climate Connections.
- For a peek inside of some federal-level public sector machinations, read the "Fast Facts" and "Highlights" of the Government Accountability Office's (GAO's) report on the Social Cost of Carbon from June 2020. "SOCIAL COST OF CARBON: Identifying a Federal Entity to Address the National Academies' Recommendations Could Strengthen Regulatory Analysis [174]." You can access the full report as well, if you are so inclined.
- To see the Biden Administration's perspective on SCC (and response to the directive from the GAO described in the previous article), read "Change Is in the Air: Biden Revives the Social Cost of Carbon [175]" from the National Law Review in June 2021.
- This article provides details of peer-reviewed research in Nature Climate Change, which is a highly regarded journal. "New study finds incredibly high carbon pollution costs – especially for the US and India [176]." The Guardian, October 2018.
- "Federal Court Rules in Favor of Social Cost of Carbon and Environmental Justice [177]." Triple Pundit, August 17th, 2016. According to this article, this court decision "is the first time that a U.S. court has ruled on the legality of carbon accounting in any form," and so is a very important decision. Note the variety of nonmarket actions.
- Finally, please read the written testimony [178] of Robert P. Murphy of the Institute for Energy Research (IER). The IER is funded by the fossil fuel industry, and it's former president Thomas Pyle led Trump's transition team for the Department of Energy. It provides a window into some arguments presented by stakeholders who are opposed to the SCC.
Optional Reading
- "Estimated social cost of climate change not accurate, Stanford scientists say [179]." Stanford News, Jan. 2015. This is a summary of an oft-cited peer-reviewed study on SCC.
- The World Bank has a Carbon Pricing Dashboard [180] that contains a wealth of information about public sector carbon pricing around the world, on both national and subnational levels. Feel free to explore the site.
- For a very good explanation of some of the basics of SCC, read "More than Meets the Eye, The Social Cost of Carbon in U.S. Climate Policy, in Plain English [181]," by the World Resources Institute [182], Environmental Law Institute in July 2011. Read Summary and stop at section 4a How do the SCC Models Work?
The Paris Climate Agreement
Anthropogenic climate change is likely the "wickedest" of our "wicked problems." The term "wicked problems" was coined in 1973 by Horst Rittel and Melvin Webber. See this page [183] from Stony Brook University for a full explanation if you are interested, but as described by [184]Jon Kolko at Stanford University, a wicked problem is one that is "a social or cultural problem that is difficult or impossible to solve for as many as four reasons: incomplete or contradictory knowledge, the number of people and opinions involved, the large economic burden, and the interconnected nature of these problems with other problems." Climate change checks all of these boxes (and then some). For starters, the fact that the issue is global in nature and involves every sector of human activity - in terms of both causes and impacts - makes it particularly difficult to address.
There has been a formal global effort via the auspices of the United Nations since the United Nations Framework Convention on Climate Change (UNFCCC) was formed in 1992. The UNFCCC is a "a framework for international cooperation to combat climate change by limiting average global temperature increases and the resulting climate change, and coping with impacts that were, by then, inevitable" (source: UNFCCC [185]). The UNFCCC is the only global body capable of deliberating international climate-related agreements and protocols. There are currently 197 countries that are Parties to the Convention. The first major agreement resulting from the UNFCCC was the Kyoto Protocol in 1995, which the U.S. never ratified.
On December 12th, 2015 the Paris Agreement was adopted on the last day of the 21st Conference of the Parties (COP 21), aka the Paris Summit. (The COP is the annual meeting of the UNFCCC where they discuss and hammer out climate goals. The first COP was in 1995, when the Kyoto Protocol was formalized. The last COP [COP 25 [186]] was held in Madrid, Spain. COP 26 was due to take place in Glasgow, Scotland in 2020 but was postponed until 2021 due to COVID.) The goal of the Paris Agreement is to keep "a global temperature rise this century well below 2 degrees Celsius above pre-industrial levels and to pursue efforts to limit the temperature increase even further to 1.5 degrees Celsius" (source: UNFCCC [185]). Coming to such a wide-ranging multi-stakeholder agreement inevitably comes with compromises, of which there were many. Despite its flaws, arriving at this agreement was seen as a major accomplishment and encouraging first step toward establishing global climate goals. As you may know, the Trump Administration announced its intention to withdraw from the Agreement soon after President Trump was sworn into office. The Agreement was structured such that it was not possible to withdraw immediately, but the withdrawal process did officially begin in November of 2019. True to his campaing promise, President Biden issued an executive order to re-enter the Agreement in January of 2021.
The Paris Agreement is a major nonmarket action that has the potential to impact international and domestic energy markets at multiple scales. The Agreement will continue to be a consideration in global energy markets moving forward. Please read the articles below to gain an understanding of some of the history, process behind, and implications of this historic Agreement.
To Read Now
- For an excellent summary of the process leading up to and the details of the Agreement, read "Paris Climate Agreement Q&A [187]" from the Center for Climate and Energy Solutions.
- "What You Need to Know About Article 6 of the Paris Agreement [188]" from the World Resources Institute provides an explanation of Article 6 of the Agreement, which is a particularly important consideration with regards to global energy markets.
- (Suggested) Article 6 has yet to be operationalized, partially due to the fact that COP 26, which was to take place in 2020 in Glasgow, was cancelled due to COVID. The UNFCCC hopes to have an agreement on how to implement Article 6 at COP 26 in Glasgow in November of 2021. See "Delivering Climate Ambition Through Market Mechanisms: Capitalizing on Article 6 Piloting Activities" [189] from March of 2021 by the International Institute for Sustainable Development for details.
Optional Reading
- Explore the well-regarded Climate Action Tracker [190], which tracks emissions and emissions targets by country.
Lesson 4 Assignments
Weekly Activity 4
Please review Canvas calendar for all due dates related to your Nonmarket Analysis Case Study.
Deliverable
Complete Quiz 4. The activity may include a variety of question types, such as multiple choice, multiple select, ordering, matching, true/false, and "essay" (in some cases these require independent research and may be quantitative). Be sure to read each question carefully.
Unless specifically instructed otherwise, the answers to all questions come from the material presented in the course lesson. Do NOT go "googling around" to find an answer. To complete the Activity successfully, you will need to read the lesson, and all assigned readings, fully and carefully.
Each week, a few questions may involve research beyond the material presented in the course lesson. This "research" requirement will be made clear in the question instructions. Be sure to allow yourself time for this! You will be graded on the correctness and quality of your answers. Make your answers as orderly and clear as possible.
This Activity is to be done individually and is to represent YOUR OWN WORK. (See Academic Integrity and Research Ethics [52] for a full description of the College's policy related to Academic Integrity and penalties for violation.)
The Activity is not timed, but does close at midnight EST on the due date as shown on the Calendar.
If you have questions about the assignment, please post them to the "Questions about EME 444?" Discussion Forum. I am happy to provide clarification and guidance to help you understand the material and questions (really!). Of course, it is best to ask early.
Summary and Final Tasks
In this lesson, you learned about significant nonmarket forces that are increasingly creating opportunities for stakeholders to shape the business environment for energy firms: shareholder pressure to report and address risks to the business from climate change, the use of a social cost of carbon (SCC) to assess proposed policy, and an emerging awareness of energy return on investment (EROI).
You learned:
- about the relationship between climate change, corporate reporting, and investor risk;
- details of the SEC's interpretive guidance related to corporate reporting requirements triggered by climate change;
- the definition of social cost of carbon (SCC) and its application;
- the political and business ramifications of SCC;
- how the SCC is applied to policy assessment;
- how to define and calculate energy return on investment (EROI);
- to use and cite examples of EROI used in analysis for purposes of nonmarket and market strategic action.
Have you completed everything?
You have reached the end of Lesson 4! Double-check the list of requirements on the first page of this lesson to make sure you have completed all of the activities listed there.
5 Nuclear
Introduction
Overview of Lesson 5
With this lesson, we begin our survey of energy industries, based on energy sources. In this lesson, we will review the nuclear energy industry. Additional energy sources will be considered in future lessons.
What will we learn?
By the end of this lesson, you should be able to...
- explain nuclear energy and the difference between fission and fusion;
- describe in detail the uranium fuel cycle;
- recognize and profile major international nuclear agencies;
- quantify nuclear generation capacity around the world;
- identify and consider externalities related to nuclear generation including the risk of catastrophe and terrorism, but also the advantage of emissions-free generation;
- explain the technical details and policy implications of March 11, 2011 accident at Fukushima nuclear power plant in Japan;
- research and report on international nuclear generation estimates;
- analyze the status of the nuclear energy industry in the U.S.
What is due for Lesson 5?
The table below provides an overview of the requirements for Lesson 5. For details, please see individual assignments.
Please refer to the Calendar in Canvas for specific time frames and due dates.
| REQUIREMENT | SUBMITTING YOUR WORK |
|---|---|
| Read Lesson 5 content and any additional assigned material | Not submitted. |
| Weekly Activity 5 | Yes—Complete Activity located in the Modules Tab in Canvas. |
| Case Study-work with others on your Team to prepare Case Study, following course guidelines | Check Canvas calendar for all Case Study Due Dates. |
Nuclear Energy Overview
Nuclear energy is the energy that holds the protons and neutrons together in the nucleus of an atom. This energy can be released through fusion or fission. All operating nuclear power plants get their energy from fission, but we actually use energy from fusion more (the sun uses fusion to generate radiant energy). Fusion is still in the laboratory phase, and there are no commercial fusion reactors. There is an old adage that "fusion is always a decade away," which is a pithy way of saying that despite decades of attempts, humans have not been able to figure out how to make it work well enough to deploy.
Fusion
In nuclear fusion, two light nuclei combine to form a single larger nucleus. It takes less energy to hold the larger atom together, and the excess nuclear energy is released as light and heat. (This is how the sun works--hydrogen atoms combine to form helium, releasing light and heat.) To get the atoms to fuse, however, requires a great deal of energy because there is an electrical repulsion that works to keep the similarly charged nuclei apart. The three requirements for a successful thermonuclear reactor are high particle density, high temperature, and a container that can maintain the temperature and density long enough for the fuel to be fused (Source: Oracle ThinkQuest [191]).
Currently there are no deployed nuclear fusion reactors, but experiments continue around the world. A consortium including China, the European Union, India, Japan, Korea, Russia, and the United States is working on a project called ITER [192] with the aim of providing each member with the know-how to produce its own fusion energy plant.
To Read Now
Visit the ITER website [192]
- Under "Science," open and read the pages "What is Fusion?," "Advantages of Fusion," "60 Years of Progress," and "ITER Goals."
Fission
Fusion releases nuclear energy when lighter nuclei join (or fuse) to form heavier nuclei. Fission, on the other hand, releases nuclear energy by splitting atoms into smaller ones. The extra energy is released as heat and radiation.

In fission, a uranium-235 isotope absorbs a bombarding neutron, which causes the uranium nucleus to split into two atoms of lighter weight. This reaction releases heat and radiation, as well as more neutrons. These neutrons then bombard other uranium atoms, which then split and release more energy and neutrons, This happens over and over again in a chain reaction.
Note that both fission and fusion generate heat, but do not involve combustion. In other words, the atoms are split or fused, not burned. This is why neither of them emit carbon dioxide or other gases that are associated with the burning of fossil fuels or other carbon-based fuels like wood. (More on the byproducts of combustion in a future lesson.)
Uranium Fuel Cycle
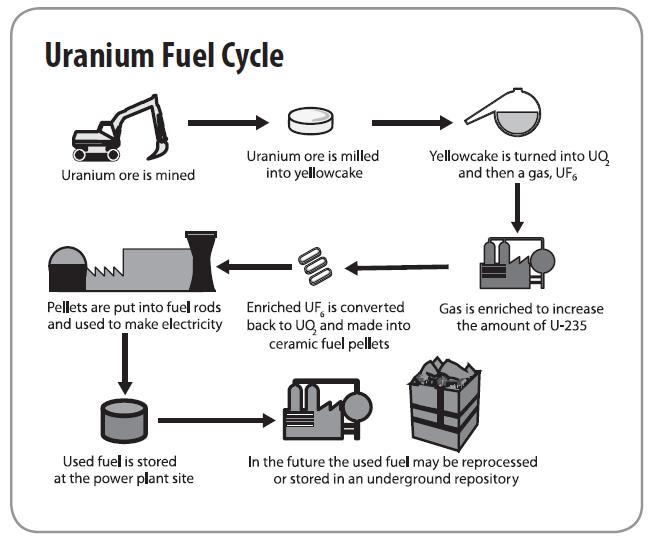
Click link to expand for a text description of Figure 5.1
This is a flow chart from mining to conversion, enrichment, fuel fabrication, and storage.
- It starts when Uranium ore is mined
- Uranium ore is then milled into yellowcake
- Yellowcake is turned into UO2 and then a gas, UF6
- Gas is enriched to increase the amount of U-235
- Enriched UF6 is converted back to UO2 and made into ceramic fuel pellets
- Pellets are put into fuel rods and used to make electricity
- Used fuel is stored at the power plant site
- In the future the used fuel may be reprocessed or stored in an underground repository.
The uranium fuel cycle includes all the steps of using uranium to generate electricity (fission), from mining to disposal/storage. These steps are described below.
Uranium Recovery
Uranium ore is mined--much like coal--from underground mines or surface mines. In the USA, a short ton of uranium ore usually contains about 3 to 10 pounds of uranium. The process of separating the uranium from the ore is called milling. In this process, the ore is crushed and mixed with an acid (typically) that dissolves the uranium out of the ore. This solution is separated out and dried, leaving a powder called "yellowcake." In addition to yellowcake, uranium recovery operations generate waste products called byproduct materials that contain low levels of radioactivity.
Conversion
The next step is to convert the yellowcake into uranium hexafluoride (UF6), a gas suitable for use in enrichment operations. In this process, the uranium (yellowcake) is combined with fluorine to create the UF6 gas. This gas is pressurized and cooled to a liquid, then poured into large cylinders, and then cooled for about 5 more days until it solidifies.
Currently, there is one conversion plant operating in the United States (Honeywell International Inc., Illinois). Canada, France, United Kingdom, China, and Russia also have conversion plants.
The conversion process involves strong chemicals to convert the yellowcake into soluble forms, leading to possible inhalation of uranium, and producing extremely corrosive chemicals that could cause fire and explosion hazards.
Enrichment
When uranium is mined, it is nearly all in the form of the isotope uranium-238. All uranium atoms have 92 protons in their nucleus (that's what uranium is!), but they may have different numbers of neutrons. When this happens, the atoms are called isotopes. Uranium-238 has 146 neutrons (92 protons + 146 neutrons = 238, the "atomic mass"). Uranium-235 has 143 neutrons. This form, uranium-235, is commonly used for energy production because the nucleus splits apart easily when it is hit (bombarded) by a neutron.
The purpose of the enriching process is to increase the proportion of U-235. There are three processes for doing this: gaseous diffusion, gas centrifuges, and laser separation. The only commercial enrichment facility currently operating in the USA is a gaseous diffusion plant in Paducah, Kentucky.
In a gaseous diffusion plant, safety risks include the chemical and radiological hazard of a UF6 release and the potential for mishandling the enriched uranium, which could create an inadvertent nuclear reaction (how's that for a phrase you never want to hear uttered?).
Fuel Fabrication
At a fuel fabrication plant, enriched uranium is prepared for use as fuel in a nuclear reactor. The uranium is heated back into a gas and then chemically processed into a powder that is processed into fuel pellets. A single uranium fuel pellet (about the size of a fingertip) contains as much energy as 17,000 cubic feet of natural gas, 1 short ton of coal, or 149 gallons of oil, according to the Nuclear Energy Institute [196]. The pellets are sealed into metal tubes called fuel rods. Groups of rods are bundled together into fuel assemblies.
There are numerous fuel fabrication facilities in the USA. Safety risks at fuel fabrication facilities are similar to those at enrichment plants.
Use of the Fuel in Reactors
A nuclear reactor is the equipment used to initiate and sustain a controlled nuclear reaction. The fission process takes place in the reactor core. This core is surrounded by a reactor pressure vessel. To prevent radiation leaks, both the core and the vessel are housed in a containment building. It is an airtight structure, made of steel and concrete and several feet thick.
The fuel assemblies are placed in the core where the reaction takes place.
Just like burning coal, oil, or gas, the heat from the nuclear reaction is used to boil water and create steam. The steam turns a turbine generator to produce electricity, and then the steam is condensed back into water, often in a structure at the power plant called a cooling tower.
There are several types of commercial nuclear power plants. Currently, commercial operations in the US use either pressurized water reactors or boiling water reactors to generate electricity.
Interim Storage
Because waste products build up on fuel rods, making fission (the chain reaction), more difficult, operators of nuclear generation facilities have to replace the used fuel rods on a regular basis. To keep the plants in continuous operation, usually about one third of the fuel rods are replaced every 12 to 18 months.
Called used (spent) fuel, the rods taken out of the reactor contain radioactive waste products and unused fuel. There are two acceptable storage methods for spent fuel after it is removed from the reactor core:
- Spent Fuel Pools - Currently, most spent nuclear fuel is stored in specially designed pools at individual reactor sites around the country. The used (spent) fuel rods are under at least 20 feet of water.
- Dry Cask Storage - If pool capacity is reached, licensees may move toward use of above-ground dry storage casks.
Since 1982, a law has been in place requiring the Department of Energy to build and operate a deep underground facility (repository) for storing nuclear waste. But this has not yet happened. At one point, Yucca Mountain, Nevada was approved as a site for such a facility, but that application was withdrawn in 2010. Currently, nuclear power plants in the USA store all used fuel on site. The Yucca Mountain storage proposal was revived [197] in the spring of 2019 by the Trump Administration, but has not been approved.
Reprocessing
Reprocessing separates unused fuel from waste products in spent fuel rods, so that the fuel can be used again. Currently, reprocessing is more expensive than just making new fuel from uranium ore. Reprocessing is not currently done in the USA, but France, the UK, Russia, and Japan have reprocessing capacity, according to the World Nuclear Association [198].
Transportation of Spent Nuclear Fuel
When spent fuel assemblies are removed from a reactor, the fission process has stopped, but the assemblies still generate significant amounts of radiation and heat. Because of the residual hazard, spent fuel must be shipped in containers or casks that shield and contain the radioactivity and dissipate the heat. Currently, most spent fuel shipments are between different reactors owned by the same utility to share storage space or to a research facility. When an underground waste repository is built, the number of these shipments by road and rail is expected to increase.
International Agencies
Many regional government agencies and regulatory bodies have oversight authority for nuclear energy activities within their borders. Additionally, numerous international agencies also work to advance the safe and peaceful use of nuclear energy. Several of the more prominent ones are described below.
International Atomic Energy Agency (IAEA) [199]
- Set up as the world's "Atoms for Peace" organization in 1957 within the United Nations family, the IAEA currently has 173 member countries [200].
- The IAEA Secretariat, a team of over 2500 multi-disciplinary professional and support staff [201] from more than 100 countries, is headquartered in Vienna, Austria. Regional offices are located in Geneva, Switzerland; New York, USA; Toronto, Canada; and Tokyo, Japan.
- IAEA financial resources include the regular budget and voluntary contributions.
- Three main areas of work underpin the IAEA´s mission: Safety and Security; Science and Technology; and Safeguards and Verification. To fulfill this mission [202], it "serves as the global focal point for nuclear cooperation;...assists its Member States...in planning for and using nuclear science and technology for various peaceful purposes...and facilitates the transfer of such technology and knowledge in a sustainable manner to developing Member States;...develops nuclear safety standards, and...promotes the achievement and maintenance of high levels of safety...(and) verifies through its inspection system that States comply with their commitments, under ...non-proliferation agreements."
- The IAEA reports annually to the UN General Assembly and, when appropriate, to the UN Security Council regarding non-compliance by States with their safeguards obligations as well as on matters relating to international peace and security.
- The Agency's iNFCIS [203] (Integrated Nuclear Fuel Cycle Information Systems) website is designed as a "one stop" resource for technical and statistical information about nuclear fuel cycle activities worldwide.
Nuclear Energy Agency [204]
- The Nuclear Energy Agency (NEA) is a specialized agency within the Organization for Economic Co-operation and Development (OECD), an intergovernmental organization of industrialized countries, based in Paris, France.
- The mission [205]of the NEA is "to assist its Member countries in maintaining and further developing, through international co-operation, the scientific, technological and legal bases required for the safe, environmentally sound and economical use of nuclear energy for peaceful purposes. It strives to provide authoritative assessments and to forge common understandings on key issues as input to government decisions on nuclear energy policy and to broader OECD analyses in areas such as energy and the sustainable development of low-carbon economies."
- The NEA's current membership [206] consists of 34 countries, in Europe, North America the Asia-Pacific region plus two "strategic partners" (China and India). Together they account for approximately 82% of the world's installed nuclear capacity.
- The NEA works closely with the International Atomic Energy Agency (IAEA) in Vienna - a specialized agency of the United Nations - and with the European Commission in Brussels. Within the OECD, there is close coordination with the International Energy Agency and the Environment Directorate, as well as contacts with other directorates, as appropriate.
World Nuclear Association (WNA) [207]
- The World Nuclear Association is an International organization that promotes nuclear energy and supports the many companies that comprise the global nuclear industry. Note the difference between the WNA and the organizations above. The WNA is an industry organization, and thus promotes the nuclear industry, while the IAEA and NEA are focused primarily on international safety and management.
- WNA membership [208]includes (i) "virtually all of the world's uranium mining, conversion, enrichment, and fuel fabrication companies;" (ii) "all major reactor vendors;" (iii) "nuclear utilities providing 70% of world nuclear generation;" (iv) "major nuclear engineering, construction, and waste management companies; and research and development organizations;" and (v) "companies providing international services in nuclear transport, law, insurance, brokerage, industry analysis and finance."
- The WNA focus their activities on three strategic areas [208]:
- "Nuclear Industry Cooperation"
- "Nuclear Information Management"
- "Nuclear Energy Communication"
- Coordinated action through WNA yields both greater efficiency and stronger impact in:
- IAEA and NEA advisory committees on transport and all aspects of nuclear safety
- United Nations policy forums focused on sustainable development and climate change
- CRP and Ospar deliberations on radiological protection.
- The WNA's information library [209] contains an abundance of information about nuclear technology, generation statistics, safety, and more, including country-level data.
- WNA publishes the online news service, World Nuclear News [210] (WNN)
- WNA activities support the global nuclear industry by providing direct benefit to individual member-companies and collective benefit to the industry as a whole.
Nuclear Generation and Fuel Supply
Nuclear Generation
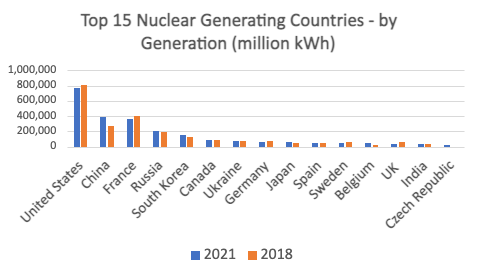
Click Here to expand for a text description of Figure 5.4
| Country | million kWh (2021) | million kWh (2018) | percent change |
|---|---|---|---|
| U.S. | 771,638 | 807,078.0 | -4.4% |
| China | 383,205 | 277,056.0 | 38.3% |
| France | 363,394 | 395,908.0 | -8.2% |
| Russia | 208,443 | 191,340.0 | 8.9% |
| South Korea | 150,456 | 127,077.0 | 18.4% |
| Canada | 86,780 | 94,450.0 | -8.1% |
| Ukraine | 81,126 | 79,532.0 | 2.0% |
| Germany | 65,444 | 71,866.0% | -8.9% |
| Japan | 61,304 | 49,330.0 | 24.3% |
| Spain | 54,218 | 53,364.0 | 1.6% |
| Sweden | 51,426 | 65,868.0 | -21.9 |
| Belgium | 47,962 | 27,251.0 | 76.0% |
| United Kingdom | 41,789 | 59,112.0 | -29.3% |
| India | 39,758 | 35,389.0 | 12.3% |
| Czech Republic | 29,044 | DNQ | -- |
Check it out!
Nuclear as share of total electricity production by country, 1965 - 2021 [212]. Note that you can change the data displayed (remove/add countries, change time span [up to 2021], view a map instead of a chart).
Source: Our World in Data [213], CC BY 4.0 [214].
As you can see, some of the top countries have decreased their overall generation, largely due to Covid. China increased its meteoric rise, increasing over 38%, this was after an increase of 30% from 2017 to 2018! Germany has continued to wind down its nuclear program after Fukishima, going from 80,100 million kWh in 2017 to 65,444 million kWh in 2021, and that was a drop from about 91,800 in 2017.
According to the World Nuclear Association [215], as of September 2022, there were about 467 nuclear power reactors operating throughout the world. 440 reactors provide about 10% of the world's electricity. Fifteen countries relied on nuclear energy to supply at least 20% of their electricity in 2021. France leading the way at (69%), Ukraine (55%), Slovakia (52%), and Belgium (50%) all derive 50% or more of their electricity from nuclear sources (source Nuclear Energy Institute [216]).
To Read Now
Visit the World Nuclear Association and explore Nuclear Power in the World Today [215]
Visit the World Nuclear Associations and explore Plans For New Reactors Worldwide [217]
Visit the U.S. Energy Information Administration and read about the U.S. Nuclear Industry [218]
Nuclear Fuel Supply
In Supply of Uranium [219], the World Nuclear Association describes the challenges and subjectivity of estimating uranium reserves. Following are some selected passages from this discussion.
Uranium is a relatively common element in the crust of the Earth (very much more in the mantle). It is a metal approximately as common as tin or zinc, and it is a constituent of most rocks and even of the sea...
Total world resources of uranium, as with any other mineral or metal, are not known exactly. The only meaningful measure of long-term security of supply is the known reserves in the ground capable of being mined.
An orebody is, by definition, an occurrence of mineralisation from which the metal is economically recoverable. Orebodies, and thus measured resources – the amount known to be economically recoverable from orebodies – are therefore relative to both costs of extraction and market prices. For example, at present neither the oceans nor any granites are orebodies, but conceivably either could become so if prices were to rise sufficiently. At ten times the current price, seawater, for example, might become a potential source of vast amounts of uranium. Thus, any prediction of the future availability of any mineral, including uranium, which are based on current cost and price data, as well as current geological knowledge, are likely to prove extremely conservative...
The question of uranium supply clearly does not have a simple answer! One could say, that how much we "have" depends on how badly we want it--how much we are willing to pay. (This is true for estimating other types of reserves as well, or as WNA states, "any other mineral.")
With these caveats in mind, the WNA provides the table below (as of May 2023).
| Country | tonnes U | Percentage of World |
|---|---|---|
| Australia | 1,684,100 | 28% |
| Kazakhstan | 815,200 | 13% |
| Canada | 588,500 | 10% |
| Russia | 480,900 | 8% |
| Namibia | 470,100 | 8% |
| South Africa | 320,900 | 5% |
| Niger | 311,100 | 5% |
| Brazil | 276,800 | 5% |
| China | 223,900 | 4% |
| Mongolia | 144,600 | 2% |
| Uzbekistan | 131,300 | 2% |
| Ukraine | 107,200 | 2% |
| Botswana | 87,200 | 1% |
| USA | 59,400 | 1% |
| Tanzania | 58,200 | 1% |
| Jordan | 42,500 | 1% |
| Other | 266,600 | 5% |
| World Total | 6,078,500 | 100% |
The Council on Foreign Relations, Global Uranium Supply and Demand [221] (2010) adds more perspective to our understanding of uranium reserve estimates (FYI, "grade of uranium ore" is the percent of ore that is actually uranium)
Still, the overall amount of uranium is less important than the grade of uranium ore, according to a 2006 background paper by the German research organization Energy Watch Group. The less uranium in the ore, the higher the overall processing costs will be for the amount obtained. The group contends that worldwide rankings mean little, then, when one considers that only Canada has a significant amount of ore above 1 percent--up to about 20 percent of the country's total reserves. In Australia, on the other hand, some 90 percent of uranium has a grade of less than 0.06 percent. Much of Kazakhstan's ore is less than 0.1 percent.
Toni Johnson. (2010). Global Uranium Supply and Demand [221]. Retrieved November 2022.
As of December 2020, the World Nuclear Association [222] offered this conclusion about supply and demand:
The world's present measured resources of uranium (6.1 Mt) in the cost category less than three times present spot prices and used only in conventional reactors, are enough to last for about 90 years. This represents a higher level of assured resources than is normal for most minerals. Further exploration and higher prices will certainly, on the basis of present geological knowledge, yield further resources as present ones are used up.
However, they provide the following insight at a subsequent point in the same article (emphasis added):
This focus on rates of depletion suggests that one of the dimensions of economic sustainability of metals has to do with their relative rates of depletion. Specifically, it suggests that economic sustainability will hold indefinitely as long as the rate of depletion of mineral resources is slower than the rate at which it is offset. This offsetting force will be the sum of individual factors that work against depletion, and include cost-reducing technology and knowledge, lower cost resources through exploration advances, and demand shifting through substitution of materials.
Estimating the amount of nuclear fuel left is complicated! How long nuclear energy is used for will certainly depend on a variety of economic, technological, societal, and political factors, all of which will occur on a global scale. Much of it will likely depend on some of the issues addressed on the following page.
Externalities and Internalized Costs
In the previous lesson of this course, we introduced the idea of externalities--the effects that a transaction has on parties that are external to the transaction and not integrated into the cost. We can think of externalities as the "side effects" that commercial activity has on other parties in a way that isn't reflected in the cost of the goods or services.
For the nuclear industry, major negative externalities have to do with the hazards of radioactive waste and the potential use of nuclear fuel for warfare, though it also has the positive externality of having near-zero lifecycle greenhouse gas emissions.
To View Now
The Fukushima nuclear disaster in Japan in 2011 was a stark reminder of the risk posed by nuclear energy, and had a major impact on how many countries view nuclear energy. Though it happened more than 10 years ago, its political and energy policy impacts reverberate today.
- Review the following for an explanation of what caused the Fukishima Daichi nuclear disaster. "Understanding the accident of Fukushima Daiichi [224]" from IRSN and "Explainer: What Caused The Incident At Fukushima-Daiichi [225]" from Forbes (here is a PDF copy [226] in case you cannot access it). Note the use of some of the terminology from earlier in this lesson (fuel rods, containment vessel, etc.) You are not expected to know every detail of nuclear power plant construction, but should have a solid understanding of the series of events that caused this disaster to occur.
- "In aftermath of Fukushima triple meltdown, Japan's nuclear industry faces fierce headwind [227]," The Japan Times, March 2019 (here [228]is a PDF in case you cannot access the article).
- "Nuclear energy, ten years after Fukushima [229]," Nature, March 2021.
Cost of Disaster
In the immediate aftermath of the March 2011, Fukushima nuclear disaster in Japan, the Washington Post ran an editorial by Anne Applebaum entitled, "If the Japanese can't build a safe reactor, who can?" [230] Without using the word "externality," the author describes these "costs to others" well,
But as we are about to learn in Japan, the true costs of nuclear power are never reflected even in the very high price of plant construction. Inevitably, the enormous costs of nuclear waste disposal fall to taxpayers, not the nuclear industry. The costs of cleanup, even in the wake of a relatively small accident, are eventually borne by government, too. Health-care costs will also be paid by society at large, one way or another. If there is true nuclear catastrophe in Japan, the entire world will pay the price.
I hope that this will never, ever happen. I feel nothing but admiration for the Japanese nuclear engineers who have been battling catastrophe for several days. If anyone can prevent a disaster, the Japanese can do it. But I also hope that a near-miss prompts people around the world to think twice about the true "price" of nuclear energy, and that it stops the nuclear renaissance dead in its tracks.
One could argue however, that to be fair, if these external costs are to be included in the price of nuclear energy, then similarly the costs of externalities, including global climate change from greenhouse gas emissions, should be included in the price of fossil-fuel energy sources. How do the risks compare? These arguments juxtapose the extreme externalities of nuclear generation: the risks of catastrophe from a nuclear accident versus the benefits of emissions-free electricity generation. This juxtaposition is at the heart of the nuclear discussion today among those concerned with climate change and the environment. Opinion is very much split on the matter.
Patrick Moore, for example, who 40 years ago helped found Greenpeace as an anti-nuclear group, had a change of heart ten years ago, after he left Greenpeace. In a post -Fukushima NPR interview [231], he explained that nuclear plants can produce dependable power 24-7 and don't produce greenhouse gases, so they can replace the coal-fired power plants that spew so much climate change pollution. And, they have a great safety record compared with other sources of electricity. "In the United States, for example — 104 nuclear reactors operating now for 50 years — no member of the public has ever been harmed by them," he says. "You can't say that about oil or gas or coal."
To Read Now
- For some insight into the pros and cons of nuclear energy from an environmental/climate change perspective, read "Is nuclear power worth the risk? [233]," from Nathaniel Johnson of Grist, January 2019.
The articles below provide a good synopsis of the saga of the Vogtle nuclear power plant expansion in Gerogia. The construction process has been anything but smooth, as you will see. This provides insight into some of the complexities of deploying nuclear power, but also of utility policy in general.
- From The New York Times, read "The U.S. Backs Off Nuclear Power. Georgia Wants to Keep Building Reactors. [234]" August 2017 (
link [235]to .pdf version).
- For insight into some non-market action that threatened this multibillion dollar project, read "Lawsuit Raises Stakes on Vogtle Nuclear Expansion Vote [236]" in Power, September 2018.
- For some insight into the status of the project (and some more nonmarket action!), as of 2019 read "Trump official: Ga.’s Vogtle project helps make nuclear ‘cool again’ [237]" from the Atlanta Journal Constitution, March 2019.
- Finally, for more up-to-date information, read "Southern delays Georgia Vogtle reactors startup, boosts costs [238]" by Reuters in July 2021..
Nuclear Proliferation and Terrorism
Not mentioned in the exchange above is the risk of nuclear proliferation and terrorism. This externality was addressed in a 2010 Department of Energy Report to Congress, Nuclear Energy Research and Development Roadmap [239] (Amazon Kindle). The report included four R&D objectives, one of which is "Understand and minimize the risks of nuclear proliferation and terrorism." This objective (page vii) is described,
It is important to assure that the benefits of nuclear power can be obtained in a manner that limits nuclear proliferation and security risks. These risks include the related but distinctly separate possibilities that nations may attempt to use nuclear technologies in pursuit of a nuclear weapon and that terrorists might seek to steal material that could be used in a nuclear explosive device. Addressing these concerns requires an integrated approach that incorporates the simultaneous development of nuclear technologies, including safeguards and security technologies and systems, and the maintenance and strengthening of non-proliferation frameworks and protocols. Technological advances can only provide part of an effective response to proliferation risks, as institutional measures such as export controls and safeguards are also essential to addressing proliferation concerns. These activities must be informed by robust assessments developed for understanding, limiting, and managing the risks of nation-state proliferation and physical security for nuclear technologies. NE [DOE Office of Nuclear Energy] will focus on assessments required to inform domestic fuel cycle technology and system option development. These analyses would complement those assessments performed by the National Nuclear Security Administration (NNSA) to evaluate nation state proliferation and the international nonproliferation regime. NE will work with other organizations including the NNSA, the Department of State, the NRC, and others in further defining, implementing and executing this integrated approach.
US Department of Energy. (2010). Nuclear Energy Research and Development Roadmap [239]. Retrieved November 2022.
A nonmarket action was taken/changed in January 2016 when the U.S., the European Union, plus China and Russia [240] negotiated and lifted sanctions on Iran after it agreed to largely dismantle its nuclear program [241]. This has a direct link to the externality of terrorism, and though opinions on the deal are mixed, it has had an impact on various aspects of world markets.
To Read Now
- From the BBC, read "What lifting Iran sanctions means for world markets [242]," January 2016 for some insight into how sanctions can impact global energy markets.
Optional Reading
For an update on this topic, read "Six charts that show how hard US sanctions have hit Iran [243]" from the BBC (December 2019)
Assignments
Weekly Activity 5
Please review Canvas calendar for all due dates related to your Nonmarket Analysis Case Study.
Deliverable
Complete "Weekly Activity 5," located in the "Weekly Activities" folder under the Modules tab. The activity may include a variety of question types, such as multiple choice, multiple select, ordering, matching, true/false, and "essay" (in some cases these require independent research and may be quantitative). Be sure to read each question carefully.
Unless specifically instructed otherwise, the answers to all questions come from the material presented in the course lesson. Do NOT go "googling around" to find an answer. To complete the Activity successfully, you will need to read the lesson, and all assigned readings, fully and carefully.
Each week a few questions may involve research beyond the material presented in the course lesson. This "research" requirement will be made clear in the question instructions. Be sure to allow yourself time for this! You will be graded on the correctness and quality of your answers. Make your answers as orderly and clear as possible. Help me understand what you are thinking and include data where relevant. Remember, numbers should ALWAYS be accompanied by units of measure (not "300" but "300 kW"). You must provide ALL calculations/equations to receive full credit - try to "talk me through" how you did the analysis.
This Activity is to be done individually and is to represent YOUR OWN WORK. (See Academic Integrity and Research Ethics [52] for a full description of the College's policy related to Academic Integrity and penalties for violation.)
The Activity is not timed, but does close at midnight EST on the due date as shown on the Calendar.
If you have questions about the assignment, please post them to the "Questions about EME 444?" Discussion Forum. I am happy to provide clarification and guidance to help you understand the material and questions (really!). Of course, it is best to ask early.
Summary and Final Tasks
In this lesson, you learned about general types of nonmarket strategy and specific strategies for activities in non-government arenas (private politics). The case study, continued from the previous lessons and concluded here, developed a nonmarket strategy based on the outcomes of the nonmarket analysis. The Case Study introduced new concepts related to non-profit organizations and their role in the nonmarket arena.
You learned:
- the meaning of "nuclear energy" and the difference between fission and fusion;
- details of steps in the uranium fuel cycle;
- profiles of major international nuclear agencies;
- to quantify nuclear generation capacity around the world;
- about externalities related to nuclear generation, including the risk of catastrophe and terrorism, but also the advantage of emissions-free generation;
- technical details and policy implications of March 11, 2011 accident at Fukushima nuclear power plant in Japan;
- how to research and report on international nuclear generation estimates;
- the status of the nuclear energy industry in the U.S.
Have you completed everything?
You have reached the end of Lesson 5! Double-check the list of requirements on the first page of this lesson to make sure you have completed all of the activities listed there.
6 Coal
Introduction
Overview of Lesson 6
With this lesson, we continue our survey of energy industries based on energy sources. In this lesson, we will review the coal industry--from mining and extraction to emissions from coal-fired power plants.
What will we learn?
By the end of this lesson, you should be able to...
- describe standard forms of coal and their properties;
- explain coal's role in the carbon cycle, including photosynthesis, coalification, and combustion;
- use concepts and terminology related to surface and underground mining;
- recognize various types of coal-fired power plant technologies;
- describe coal's role in greenhouse gas emissions, including carbon dioxide and methane;
- research and report on global coal reserves and consumption;
- explain the technology and status of clean coal technologies;
- explain the technology and status of carbon capture and sequestration (CCS);
- recognize and analyze externalities related to the coal industry.
What is due for Lesson 6?
The table below provides an overview of the requirements for Lesson 6. For details, please see individual assignments.
Please refer to the Calendar in Canvas for specific time frames and due dates.
| REQUIREMENT | SUBMITTING YOUR WORK |
|---|---|
| Read Lesson 6 content and any additional assigned material | Not submitted. |
| Weekly Activity 6 | Yes—Complete Activity located in the Modules Tab in Canvas. |
| Case Study--work with others on your Team to prepare Case Study, following course guidelines | Check Canvas calendar for all Case Study Due Dates. |
Hello Coal
Introducing Coal
What is Coal?
Coal is a combustible rock--a rock that burns. It is composed mostly of carbon and hydrocarbons. (A hydrocarbon is a molecule consisting of some combination of carbon and hydrogen, such as methane, CH4).
Coal is a fossil fuel, which means it was created over millions of years from dead plants trapped under layers of earth. The heat and pressure turned the plant remains into what we call coal today. Petroleum and natural gas are also fossil fuels, formed in similar ways.
Fossil Fuels and the Carbon Cycle
A fundamental point to realize about all fossil fuels is that the energy we release by burning them came originally from the sun. How's that?
Plants grow as a result of photosynthesis, a process where carbon dioxide (CO2), water (H2O), and energy from the sun combine to create simple sugars, such as glucose (C6H12O6), and oxygen (O2). Photosynthesis is an endothermic chemical reaction (meaning that it requires the net input of energy to occur). The sun provides this necessary energy, which is used to create chemical bonds. The simple sugars created in photosynthesis may later be converted into other types of molecules that make up all the "matter/stuff" of a plant, including specialized carbohydrates, such as cellulose. (Source: Virtual Chembook [246], Elmhurst College, 2003, retrieved August, 2011).
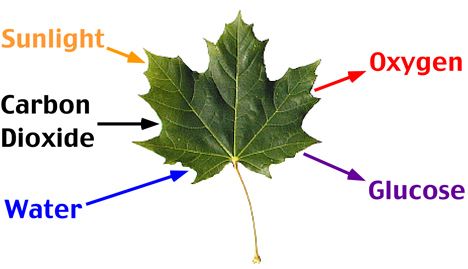
Over millions (and often hundreds of millions) of years, heat and pressure causes the chemistry of the dead plants to change somewhat, and some carbon dioxide and oxygen are released, but the energy from the sunlight is generally retained. So, we can think of coal as a bundle of carbon and hydrocarbon molecules held together by bonds that were formed from the sun's energy millions of years ago. It is this very energy that makes coal so useful to us now.
To release this energy, we burn the coal. This is an exothermic chemical process called combustion. It releases energy stored in the chemical bonds that hold the molecules together. Remember Smokey the Bear? (He's still around right? Did I just date myself? Moving on...) The fire triangle has three necessary components for combustion (fire) to begin: fuel, oxygen, and heat. Once the fire gets started, a chain reaction takes over between the hydrocarbons in the fuel and available oxygen. Some energy is used to break the bonds in the fuel, but even more energy is released when the new bonds form with the oxygen. Overall, the reaction is exothermic--energy is released. In complete combustion of a pure hydrocarbon, the hydrocarbon is converted to carbon dioxide (CO2), water vapor (H2O), and heat (and light). Note that fossil fuels usually have impurities (e.g. nitrogen, sulfur, mercury), and thus other byproducts usually result from the combustion reaction.
See the reaction below for complete combustion of a hydrocarbon, and the reaction for complete combustion of methane. (Methane is a hydrocarbon composed of one carbon and four hydrogen atoms). Note that the "extra" heat energy released as a byproduct provides heat for the continued combustion process. Combustion will continue to occur until either the heat, fuel source, or oxygen is insufficient to continue the reaction.

Please note that the reactions above describe complete combustion, which means that all of the fuel is completely converted to the given byproducts. In reality, this process is rarely so simple. When incomplete combustion occurs, other byproducts such as carbon monoxide (a silent, tasteless, and odorless deadly gas) and carbon (e.g. soot) result. In addition, there are often impurities in the hydrocarbon that result in additional byproducts. For example, a lot of coal contains traces of sulfur, which forms sulfur dioxide (SO2) when combusted. Sulfur dioxide emissions from power plants are proven to cause so-called "acid rain," which became a major nonmarket issue in the 1980's in the U.S. Coal also often contains traces of mercury, which is released when combustion occurs. Coal combustion is the second leading source of mercury pollution worldwide [248] (just a little bit behind artisanal and small scale gold mining), and mercury is a major human health hazard. Interestingly, the chemical content of the air used in the combustion reaction can be a problem as well. Our atmosphere is mostly nitrogen, and a byproduct of combustion with air will be nitrogen dioxide (NO2). In short, the products of combustion depend on the specifics of all the compounds involved in the reactions, and the combustion of coal nearly always results in unwanted byproducts.
While we're on this topic, another interesting consideration is the amount of greenhouse gases formed during the combustion process. When we burn a fuel, a reaction takes place between a hydrocarbon and oxygen that yields carbon dioxide and water. When we burn one pound of coal, we produce about two and half pounds of CO2. How can that be?
The atomic weight of carbon is 12 and oxygen is 16 (grams per mole), giving carbon dioxide a total molecular weight of 44. So, each atom of carbon results in 3.7 times its weight in CO2. (44/12 = 3.7)
The typical carbon content for coal ranges from more than 60 percent for lignite to more than 80 percent for anthracite, according to the EIA [250]. Let's consider coal that is around 70% carbon. One pound of this coal results in about (0.70 lb carbon/lb coal) x (3.7 lb CO2/lb carbon) = 2.6 pounds of CO2.
Coal Use and Reserves
Types of Coal
There are four basic varieties of coal: lignite, sub-bituminous, bituminous, and anthracite. All are formed from ancient plant material. Variations are the result of different geologic forces which affect the carbon content and heating value--also the dollar value!
- Lignite: Sometimes called "brown coal," this is a brownish-black coal with generally high moisture and ash content and lower heating value. It is the lowest ranked coal. It contains 25 to 35 percent carbon and has the lowest heating value, 4,000 to 8,300 Btus per pound.
- Sub-bituminous: A dull black coal, it contains about 35 to 45 percent carbon and has a heating value of 8,300 to 11,500 Btus per pound. It is used primarily for generating electricity and for space heating.
- Bituminous: Sometimes called "soft coal," this coal is 45 to 86 percent carbon, softer than anthracite, and has a heat content between 10,500 and 14,000 Btus per pound.
- Anthracite: Sometimes called "hard coal," this coal is 86 to 97 percent carbon and has the highest energy content of all coals, nearly 15,000 Btus per pound.
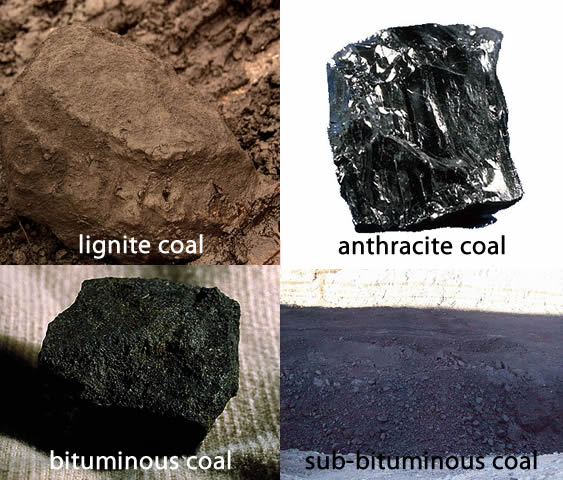
How does the World Use Coal?
To Read Now
Visit the World Energy Council and see the publication "World Energy Resources 2016 [253]." You can download your own copy, or access the copy under the Lesson 6 tab. The information in this publication is not the most current, but it collects some interesting data in one place that will give you an idea for how coal is (still) used globally as a major energy source.
Please read the following in the Introduction:
- For an explanation of how the Paris Agreement is likely to impact world energy markets, read the "THE ROLE OF THE PARIS AGREEMENT ON SHAPING ENERGY DEVELOPMENTS" section, pp. 10 - 11 (This is pp. 12 - 13 on the navigation bar at the top.)
- For an overview of the growth of the coal industry through the mid-2010s, read the Summary, pp. 12 - 13 (pp. 14 - 15 on the navigation bar)
In the main body of the report (this portion starts after the Introduction, which ends on p. 49) read:
- Generation Technologies, pp. 11 - 14 (pp. 53 - 56 on the navigation bar at the top)
- Socio-economics, pp. 34 - 36 (pp. 76 - 78 on the navigation bar)
As you read this, it will help to remember the international definition used by the United Nations for proved recoverable reserves: "the quantity within the proved amount in place that can be recovered in the future under present and expected local economic conditions with existing available technology" (World Energy Council [254]).
To Read Now
- Read through the "coal" section of the Energy Information Administration's (EIA's) International Energy Outlook 2021 [255]. This is the most recent full "IEO" report available. The material on global coal use is on pages 26-28.
Note: reference cases are forward-looking scenarios (through 2050 and 2040, respectively), which does not incorporate prospective legislation or policies that might affect energy markets, including prospective greenhouse gas reduction policies.
To Read Now
The global energy market is a dynamic place. This is but one reason that it is exciting to be in the energy field (hopefully I'm not the only one who realizes this!). Read the following to get an understanding for recent trends in the global coal market.
- "A tale of three countries: how Czechia, Germany, and Poland plan to ditch coal [256]" Euractive, May 2021.
- "Germany Flirts With Power Crunch in Nuclear and Coal Exit [257]" Bloomberg Green, August 2021 (here [258]is a .pdf in case there is a paywall)
- Read through the Coal section of the 2022 BP Statistical Review of World Energy. [259]
- Finally, for insight into various market and nonmarket forces impacting the price of coal, read "As Investors and Insurers Back Away, the Economics of Coal Turn Toxic [260]" at Yale Environment 360, March 2020.
The EIA and BP publish excellent (and free!) information, loaded with analysis and details far beyond the breadth and depth of this lesson. I encourage you to please keep these important publications and organizations (the International Energy Agency [261] and Yale Environment 360 [262] are great as well) in mind, however, as they may be helpful to you in other courses, research, and your professional life--now and in the future!
Coal Mining
Coal is a solid that, if we are to use it, must be extracted from the earth. This is coal mining, going into the earth to remove coal for our consumption. The basic steps of mining and processing coal are described below.
There are two general methods of coal mining: surface mining and underground mining.
Surface Mining
Generally called surface mining, the industry also calls it "opencast" or "open cut mining," while others may refer to it as "strip mining." In this type of mining, workers use explosives and heavy earth moving equipment, such as power shovels and draglines, to break up and scoop off the layers of soil and rock (overburden) covering the coal seam. Once exposed, the coal seam is systematically mined in strips. It is broken up using drills and explosives, and then smaller shovels lift the coal from the ground and load it into trucks or onto conveyors for transport to a coal preparation plant or directly to where it will be used.
Mountaintop removal is a variant of strip mining technology commonly used in West Virginia and eastern Kentucky where local topography provides adjacent valleys which can be used as repositories for overburden. In this type of mining, bulldozers are used first to remove all topsoil and vegetation from the mountaintop. Then explosives are used to break up the bedrock above the coal. Huge draglines (the bucket can hold 15-20 pickup trucks) then remove the overburden and dump the waste rock ("spoil") into the adjacent valleys. Then the coal seam is blasted and front end loaders scoop up the coal and load it into the huge dump trucks that carry the coal to the coal preparation plant. The video below provides a pretty dramatic birds-eye view of a mountaintop removal operation, including the overburden and the coal seams below it. It is also quite clear what the mountains used to look like, as evidenced by the scenery in the background. Please watch the following (3:18) video which shows the process described above.
Surface mining works only when the coal seam is near the surface. It is, however, usually more cost-effective than underground mining and requires fewer workers to produce the same quantity of coal. And the industry reports that 90% or more of the coal is recovered, a higher proportion than from underground mining. Recall also that from a previous lesson that the EROI of surface-mined coal is higher than underground mines.
The (6:43) video below from PBS provides a good sense of the scale of the largest mine in the U.S., the Black Thunder surface mine in the Powder River Basin in Wyoming.
PRESENTER: Coal. This one critical resource supplies nearly half of America's electricity. And this is the biggest coal mining operation in the country. The Black Thunder Mine in Wyoming's Powder River basin.
Black Thunder is one of 15 mines in the basin which stretches from Northeastern Wyoming into Montana. In the last 40 years, the area has been completely transformed.
This is what the barren landscape looked like in the 1950s. And here it is now. The terrain completely altered by mines like Black Thunder. Today, Wyoming produces more coal than any state in the nation-- far more than traditional coal mining locations like Kentucky and West Virginia. So what changed?
When you think about protecting the environment, the last thing that comes to mind is digging a giant coal mine in the middle of pristine ranch land.
Yet ironically, all this came about because of a government effort to clean up our air over 40 years ago. The environmental crusader who led the charge is the last person you might expect.
RICHARD NIXON: We can no longer afford to consider air and water common property free to be abused by anyone.
PRESENTER: With pressure from the growing environmental movement, President Richard Nixon signed the Clean Air Act of 1970 into law. It restricted emissions released into the air by big polluters like coal fired power plants. You might think that would have killed coal mining, but not here in Wyoming.
This stuff has a lot less sulfur than the coal mined elsewhere. So it burns cleaner, making the Powder River basin the new king of coal.
Josh Gardner drives one of the trucks that work these pits. It's a 6:30 AM shift change. Time to go to work.
Hey, morning Josh.
JOSH GARDNER: Hey, what's up? Hey.
PRESENTER: What's with you?
Our ride is basically a dump truck on steroids. It stands over two stories tall and weighs almost 200 tons.
But it seems dwarfed by the shovel at the base of the pit.
JOSH GARDNER: That's our first bucket in.
PRESENTER: It Felt like a small earthquake.
JOSH GARDNER: This actually is telling us how much weight we have on there. The first bucket was 68 tons. And then the second one, 60.
PRESENTER: Looks like it's raining coal.
JOSH GARDNER: So we got 174.
PRESENTER: Three bucketfulls and we're on our way. One truckload like this can produce enough energy to heat a home for more than 40 years or run your television for the next 2000 years.
All day long, Josh drives in a big loop filling his truck with coal, dumping it, filling it up again. In a single shift, he can haul 8,000 tons. And there's plenty to haul.
Typically, coal seams might be 10 feet thick. But here, they're 80 feet thick or more.
JOSH GARDNER: We're about 200 feet down. And you can see the definite line where the black starts up there and all the gray above it. And once we get done taking all the coal out of this seam, this shovel is done. Then they'll take all the dirt that sits above it. They'll blast it back down into this hole. And then they'll just start again.
PRESENTER: Again and again until the whole thing is cleared of all the coal.
JOSH GARDNER: Correct.
PRESENTER: And how long can they do that for? How much coal is there?
JOSH GARDNER: They say in the whole Powder River Basin, there's enough coal to last 150 years.
PRESENTER: So this coal will be around a lot longer than you or me.
JOSH GARDNER: Oh yeah.
PRESENTER: But digging it up may be the easiest part of the job where hundreds if not thousands of miles away from the power plants that need it.
So how to get this coal where it needs to go.
Trains.
But not just any trains. Some of them are a mile and a half long.
Carlin Vigil schedules the trains of Black Thunder. She's worked here nearly 30 years-- almost as long as a mine has been in business.
CARLIN SIGIL: We shipped our first train in December of 1977. And we were probably only loading a couple of trains a week at that time. And now you're looking at anywhere from 20 to 25 trains a day.
PRESENTER: This train is headed to a power plant in Montana. This one is on its way into Minnesota, Illinois, or Missouri. This one as far east as Georgia or New York.
And they all start out on the joint line. This 103 mile long set of tracks has developed into the busiest stretch of rail in the entire country.
It links these trains to national rail lines so the coal can get wherever it needs to go. The trains don't even stop as they roll under the chutes at the base of the tower.
CARLIN SIGIL: The coal runs right up this conveyor belt here. This tube that's down below us goes into the silos themselves. We can load a train out of here in about an hour and 20 minutes.
Generally, a good month is over 10 million tons of coal.
PRESENTER: 10 million tons of coal sounds like it's a big number. But I mean, what does that mean in terms of how much energy it's actually giving to the United States.
CARLIN SIGIL: It's actually 10% of the coal generated fuel for the United States.
PRESENTER: In the middle of nowhere, we've built ourselves the Grand Canyon of coal. With our vast reserves, it's no wonder America is still so reliant on the simple black rock to power the grid. Even though coal fired power plants are among the biggest air polluters in the US.
Underground Mining
When the coal deposit lies deep below the surface of the earth, underground mining is used. Miners dig tunnels deep into the earth near the place where the coal is located. The tunnels may be vertical, horizontal, or sloping. Once deep enough, the tunnels interconnect with a network of passageways going in many directions. Entries allow fresh air into the mine and give miners and equipment access to reach the ore and carry it out. The coal extraction is done by either a room-and-pillar method or longwall mining.
When the room-and-pillar method is used, miners cutting a network of 'rooms' into the coal seam and leaving behind 'pillars' of coal to support the roof of the mine. Working from the tunnel entrance to the edge of the mine property, they remove sections of the coal while leaving columns of coal in place to help support the ceiling. This process is then reversed, and the remainder of the ore is extracted, as the miners work their way back out.
In the case of longwall mining, the area being mined is covered with hydraulically-powered self-advancing roof supports that temporarily hold up the roof while the coal is extracted. After the coal is removed, the roof is allowed to collapse. This method requires careful planning and appropriate geological conditions. Carl Hoffman in Popular Mechanics offers this vivid description [263] of longwall mining,
From an elevator-like entrance shaft deep underground, continuous miners—cutting machines on wheels—bore passages on both sides of seams of coal up to a quarter mile wide and a mile or more long. At the mine face, a massive shearer on self-advancing ceiling supports known as 'shields' slides back and forth across the face like a giant cheese grater. Water sprays constantly against the coal face to dampen coal dust. After each pass, the whole apparatus, as wide as 1600 feet, lurches forward, letting the area behind the shields collapse. A conveyor belt catches the coal, moves it to another belt running along the side passages, and takes it to the surface, often several miles away. When a panel of coal is mined out, the longwall machine is moved to the next one. Over time, mines become enormous labyrinths of passages, and it can take miners a half hour or more to travel miles to the mine face in low-slung vehicles called mantrips.
To Watch Now
Please watch the following (3:30) video:
This song tells a story of a region, of a rugged landscape that challenges the eye, and a friendly people. It's all part of the legend of Virginia's great southwest. This is the most economically depressed area in the state. For decades, the best and practically only way to make a living in these rugged hills was beneath them in the darkness of a coal mine.
Well, I guess it just gets in your blood once you try it. It's just a daily routine.
A routine Emory Hess and thousands of other miners go through every day.
And over the last few years, you just had to continually move deeper and deeper.
This is Pittston Coal's Laurel Mountain Mine, one of about 290 licensed mines in a 10 county area.
How much longer will you be mining this particular mine?
Hopefully we can get another eight years in here. 8 to 10, anyway.
Every day, around the clock, miners make this journey underground and inside Virginia's hills and mountains. Mining is basically hit or miss. You've got to go where the coal is, and here's where it is. We're about 3 and a half miles underground, and there's about 700 feet of mountain right above us.
They've had to move a lot of rock to get this deep. Powerful machines help the miners chew and claw their way inside, and some places the shaft is less than 4 feet high. You practically have to crawl. They follow the vein, taking only the coal. This one is called the Jawbone Seam. It's hundreds of thousands of years old.
Once miners gather the coal, a conveyor belt takes it outside to be processed. Three a half miles underground means a 20 minute ride on the belt before coal sees the light of day.
Once the prize industry of southwest, coal mining is quickly losing its steam. Coal demand is down. Mines are closing, and that means layoffs. In some coal counties, the unemployment rate is 50%.
If you were looking at a crystal ball, you would see that coal mining wouldn't exactly be the thing to be trying to start into right now.
Uh, right, that's a pretty good assumption, pretty good-- [UNINTELLIGIBLE] with a crystal ball, yes.
Some coal companies are trying to mine coal a cheaper way. This is the White Stallion surface mine, also owned by Pittston, where miners literally rip off the top of the mountain to take out the coal. They're mining the Dorchester Seam here, more than 1,000 feet above the Jawbone below.
Today, the remnants of a hurricane hundreds of miles away have turned this site into a mountain of mud. But the work continues. Day and night, it never stops.
There have been better times here in southwest Virginia. Coal mining was once an old, reliable way to make a living. It isn't so reliable anymore. The people here realize that, but there's not a whole lot of other ways for them to make a dollar.
Coal Preparation ("Washing")
Once the coal is removed from the mine, it is taken to a coal preparation plant where the raw "run-of-mine" coal is processed to separate the coal from undesirable waste rock and minerals. The finer waste from this process (including silt, dust, water, bits of coal, and clay) is discharged as a thick slurry into a man-made impoundment. This structure is used to confine refuse or slurry, along with any chemicals used to wash and treat the coal at the coal preparation plant. Coarser waste from the preparation process, rock, is dumped back into the pit once mining has ceased or is used in the construction of an impoundment dam.
To Watch Now
Please watch the following (5:43) video:
Man has used coal as a fuel for over 3,000 years, and it remains one of the world's most vital natural resources. It generates more than 40% of the world's electricity and every year we go through 6 billion tons. Somehow, mines must ensure a constant supply, or our cities would be plunged into darkness and industries would grind to a halt. So how do they do it?
Pittsburgh, Pennsylvania. This industrial east coast city is famous for steel production and shipbuilding. But Pittsburgh is also surrounded by rich coal reserves. And here, just 30 miles from the city, are the Bailey and Enlow Fork mines. This is the largest underground mining complex in North America. And every year it produces more than 20 million tons of coal.
There are millions of dollars invested in this vast complex, and with more than 200 men working underground at any one time, keeping it running is a major logistical challenge.
At 4:00 in the afternoon, the day shift clocks off after eight hours of hard work, while the next shift makes its way into one of the lift cages to begin the 650 foot descent into the mine. Mining is one of the toughest jobs imaginable, and there's an unspoken bond between these men who spend every working day deep underground.
Once they arrive at the bottom of the shaft, they still face a long journey to the coal face. After almost 20 years of continuous mining, a vast network of underground tunnels now extends for an extraordinary 35 square miles. The miners face a five-mile journey to get to the section currently being mined. It's a cramped and uncomfortable ride aboard one of the mine's small trains, as the cars rattle their way through the maze of dark tunnels, following a network of rails that are now so busy they require traffic lights.
First up is a monster machine, known as a continuous miner. Armed with a 16-foot cutting drum, this ferocious beast chomps away at the scene, carving out a series of access tunnels. As it bores its way forward, it feeds the cold behind it to a crab-like loader and shuttle car. The continuous miner produces up to five tons of coal every minute-- more than a miner in the 1920s produced in a whole day. But its job is actually to prepare the way for the real monster-- the longwall shearer.
Armed with a set of teeth to put a Tyrannosaurus to shame, its cutting edge is over 1,000 feet long, and it can smash an amazing 50 tons of coal out of this seam every minute. Think about it. That's almost one ton of coal every second, enough to meet all the energy needs of an average household for 78 days. But there are 3 million tons of coal in this 13-foot-high seam. Despite its ferocious appetite, it will still take six months of shuttling back and forth before it has finished digging it all out.
Before the coal is fit for shipping, they first need to remove rock, soil, and contaminants, which account for up to 30% of the raw feed. So the material is fed via conveyor into the processing plant. To ensure it's all properly processed, it's first graded according to size. Next, to separate the coal from the waste rock, it's fed into this giant floatation tank. Because the rock is heavier than the coal, it sinks to the bottom where it can be removed, while the coal floats to the surface.
It's now soaking wet. So just like your home laundry, they load it into a spin dryer.
This industrial dryer spins the coal at high speed until excess water is removed. This water is then fed into vast tanks where the contaminants are removed before being disposed of as waste slurry.
Meanwhile, the different sized pieces of coal are recombined, crushed into a uniform mix, and fed into a giant hopper. Incredibly, just 15 minutes after entering the plant, it's ready for transport by rail. As they park beneath the hopper, a controller opens a chute to allow 6 tons of coal to fill each car. Once full, every train is able to transport over 10,000 tons of coal to power stations across North America.
Thanks to some extraordinary coal crunching machines and the guys who labor 24/7 to keep them working, this essential resource keeps flowing to the world's power stations, and there's enough electricity to power the wheels of the modern world.
Methane
Methane (CH4) is a gas that forms naturally in the process of coal formation. It is also a potent greenhouse gas [264], with a global warming potential (GWP) over 20-30 times greater than CO2 over a 100 year period, despite the fact that it remains in the atmosphere for a shorter time (about 12 years vs. hundreds or thousands of years for CO2). When coal is mined, methane is released. According to the EPA [265], about 9% of global anthropogenic methane emissions comes from coal mining, most of which is purposefully vented to maintain safe mining conditions. Steps to reduce methane emissions can have relatively near term effect. The Global Methane Initiative [266] reports, "of all the short-lived climate forces, methane has a large reduction potential and cost-effective mitigation technologies are available."
In addition to being a serious greenhouse gas, methane is highly combustible with serious implications for the safety of mine operations. Methane is highly explosive at concentrations of only 5 to 15%. You may remember the Upper Big Branch mine disaster [267] in West Virginia in 2010 that killed 29 people. This was a result of methane building up and exploding.
Coal Seam Methane
Methane is generated during the natural process of coalification (the transformation of plant material into coal) and is contained in the coal microstructure. Because natural gas is made up mostly of methane, coal bed methane can be seen as a useful "unconventional" source of natural gas. When concentration levels are high, methane recovered from coal mines can be fed into the existing gas pipeline network along with or in place of conventional natural gas. The gas can be used for cooking and heating or for electricity generation with gas turbines and gas engine systems, among other things.
A range of technologies are used to recover methane from coal. They may be broken down into three categories.
- Coal Bed Methane: This is methane recovered from un-mined coal seams. It is done to reduce the risk of explosion when mining does take place or simply to use the methane as an energy source, whether the coal is extracted later or not. When the mine will remain unmined, the process is called Virgin Coal Bed Methane (VCBM).
- Coal Mine Methane: Methane recovered during mining activities as the coal is in the process of being extracted and thus emitting significant quantities of the gas. Methane recovery in this case is done to improve mine safety, to avoid emissions for environmental reasons and may be used as an energy source.
- Abandoned Mine Methane: Methane recovered from mines that have been abandoned following the completion of mining operations. In this case, the methane recovery is done for the energy value and to reduce atmospheric emissions, if significant amounts are occurring, of methane continuing to escape from the mine following the completion of mining activities. AMM is most effective when the mine has been sealed to trap the methane.
Underground mines account for the vast majority of global methane emissions from coal mines. Surface mines also emit, but less, because there is less pressure to trap methane in the coal. Methane emissions also occur during post-mining operations, including processing, storage, and transportation. Coal can continue to emit methane for months after mining, especially when it is crushed, sized, and dried. And, methane emissions from coal mines can continue after operations have ceased (Source: EPA [268]).
How Much Methane is Emitted from Coal Mines?
According to the U.S. Environmental Protection Agency's Coalbed Methane Outreach Program's most recent assessment [269]:
U.S. coal mines emitted nearly four billion cubic meters or 61 million metric tons of carbon dioxide equivalent (MMTC02E) in 2015. Between 1990 and 2015, U.S. emissions decreased by 40 percent, in large part due to the coal mining industry's increased recovery and utilization of drained gas and decrease in ventilation air methane emissions.
By 2020, global methane emissions from coal mines are estimated to reach nearly 800 MMTCO2E, accounting for 9 percent of total global methane emissions. China leads the world in estimated coal mine methane (CMM) emissions with more than 420 MMTCO2E in 2020 (more than 27 billion cubic meters annually). Other leading global emitters are the United States, Russia, Australia, Ukraine, Kazakhstan, and India.
Methane Capture from Coal Mines
Methane is also the main component in natural gas, a valuable source of energy. Because of this, coal producers worldwide deploy technology to capture methane from coal mines. According to the EPA [270], there are more than 200 coal mine methane capture projects in 15 countries worldwide which will capture more than 4 billion cubic meters of methane annually, which is equivalent to over 60 MMTCO2e. In 2015 in the U.S., over 33 billion cubic feet of natural gas were recovered from coal mines. As a point of reference, the U.S. consumed approximately 27,500 billion cubic feet of natural gas in 2015, according to the EIA [271].

| Country | Million tons of CO2 equivalent |
|---|---|
| China | 421.55 |
| U.S. | 83.93 |
| Russia | 62.34 |
| Australia | 37.02 |
| Ukraine | 36.67 |
| Kazakhstan | 27.5 |
| India | 27.38 |
| Poland | 8.93 |
| Germany | 4.17 |
"Clean Coal"
According to the U.S. EPA [272], fossil fuels are the leading source of global carbon dioxide emissions, and according to data available [273] from the International Energy Agency (IEA), coal is responsible for just over 44% of all energy-related emissions worldwide. Coal is the most carbon-intensive fossil fuel, which means it emits more CO2 than an equivalent amount of oil, natural gas, or other fossilized hydrocarbon. According to the EIA's 2019 International Energy Outlook (IEO2019 [274]), coal became the leading source of world energy-related carbon dioxide emissions in 2006. Projections through 2050 indicate that it remains the leading source, even though the IEO2019 projects that natural gas emissions will rise the most year-on-year (1.1% per year increase for natural gas vs. 0.4% per year for coal). According to the IEO2016, all of this coal-based emissions growth in the reference scenario is in non-OECD countries, as you can see in the chart below.
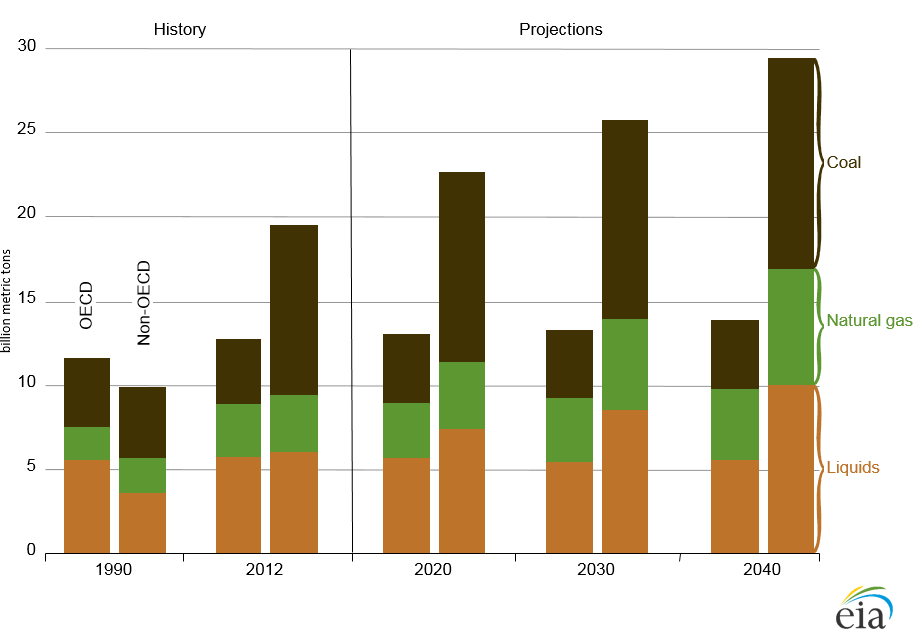
Click link to expand for a text description of Figure 6.2
| Year | Country Type | Coal | Natural Gas | Liquids |
|---|---|---|---|---|
| 1990 | OECD | 4.10 | 1.97 | 5.52 |
| 1990 | Non-OECD | 4.25 | 2.01 | 3.60 |
| 2012 | OECD | 3.93 | 3.13 | 5.72 |
| 2012 | Non-OECD | 10.07 | 3.44 | 5.97 |
| Year | Country Type | Coal | Natural Gas | Liquids |
|---|---|---|---|---|
| 2020 | OECD | 4.10 | 3.32 | 5.60 |
| 2020 | Non-OECD | 11.28 | 3.99 | 7.34 |
| 2030 | OECD | 4.06 | 3.77 | 5.49 |
| 2030 | Non-OECD | 11.87 | 5.38 | 8.52 |
| 2040 | OECD | 4.01 | 4.24 | 5.56 |
| 2040 | Non-OECD | 12.47 | 6.94 | 9.99 |
As described previously, burning coal also releases other dangerous pollutants, including soot and fly ash, sulfur, nitrogen oxides, and mercury. There is no known technology that can eliminate all of these pollutants. Even if they could, there are environmental consequences of coal extraction and processing. That is why the term "clean coal" is controversial, and frankly speaking a misnomer - there is no such thing as "clean" coal, only coal plants whose CO2 emissions are reduced or eliminated. But that aside, coal resources are abundant, coal-fired power plants are extremely reliable, and coal is relatively cheap (ignoring externalities of course), though in the past 10 years or so natural gas has been replacing coal as the power generation fuel of choice because it is less expensive [276].
Worldwide, efforts and projects are underway to mitigate the environmental impact of carbon combustion. Some of the technologies involved include scrubbers, selective catalytic reduction, fluidizer bed boilers, gasification, and carbon capture and sequestration (CSS).

Technology to Mitigate Environmental Impacts of Coal
The National Mining Association has published a helpful Clean Coal Technology Backgrounder [277]. The following is an excerpt, which describes currently available technologies.
Power plants being built today emit 90 percent less pollutants (SO2, NOx, particulates, and mercury) than the plants they replace from the 1970s, according the National Energy Technology Laboratory (NETL). Regulated emissions from coal-based electricity generation have decreased overall by over 40 percent since the 1970s, while coal use has tripled, according to government statistics. Examples of technologies that are deployed today and continue to be improved upon include:
Fluidized-bed combustion–Limestone and dolomite are added during the combustion process to mitigate sulfur dioxide formation. There are 170 of these units deployed in the U.S. and 400 throughout the world.
Integrated Gasification Combined Cycle (IGCC)–Heat and pressure are used to convert coal into a gas or liquid that can be further refined and used cleanly. The heat energy from the gas turbine also powers a steam turbine. IGCC has the potential to improve coal’s fuel efficiency rate to 50 percent. Two IGCC electricity generation plants are in operation in the U.S.
Flue Gas Desulfurization– Also called “scrubbers,” and removes large quantities of sulfur, other impurities, and particulate matter from emissions to prevent their release into the atmosphere.
Low Nitrogen Oxide (NOx) Burners– Reduce the creation of NOx, a cause of ground-level ozone, by restricting oxygen and manipulating the combustion process. Low NOx burners are now on 75 percent of existing coal power plants.
Selective Catalytic Reduction (SCR)– Achieves NOx reductions of 80-90 percent or more and is deployed on approximately 30 percent of U.S. coal plants.
Electrostatic Precipitators – Remove particulates from emissions by electrically charging particles and then capturing them on collection plates.
Optional Reading
If you're interested in more detail, try visiting the DOE's Clean Coal News [278] site.
To Read Now
For a summary of the various clean coal technologies, as well as some of the pros and cons, please read the following:
- "Carbon Capture [279]," Center for Climate and Energy Solutions
- "Everything You Need to Know About Clean Coal [280]", Popular Mechanics, November 2020
Carbon Capture and Storage (CCS)
There are two general approaches to addressing anthropogenic climate change: mitigation and adaptation. Adaptation refers to adjusting to the impacts of climate change that occur or are projected to occur, while mitigation refers to preventing greenhouse gas emissions from impacting the climate in the first place. (Keep in mind that planning - of both the market and nonmarket variety - can address both simultaneously.)
There are two general ways to mitigate emissions. Prevention is most often the focus of mitigation efforts. The most common examples are using renewable and carbon-free energy sources, and energy efficiency. However, Carbon Dioxide Removal (CDR) technologies and methods can also be effective mitigating agents. CDR technologies are frequently mentioned by many governments and organizations, including by the Intergovernmental Panel on Climate Change [281] (IPCC) in their Assessment Reports, including in their most recent report, the Sixth Assessment Report [282] (AR6). (The Physical Science Basis section of AR6 was published in August 2021, with the full report released in the spring of 2022. This section may have been subject to some revision.) The IPCC also noted the possible need for CDR in their oft-cited Special Report [283] that was published in 2018. The IPCC is the most prominent and well-regarded international organization studying and proposing solutions to climate change. Carbon capture and storage (sometimes referred to as carbon capture and sequestration), or CCS, is a prominent CDR technology. The IPCC states the following in the Executive Summary of Chapter 2 [284] of their 2018 report.
All analysed pathways limiting warming to 1.5°C with no or limited overshoot use CDR to some extent to neutralize emissions from sources for which no mitigation measures have been identified and, in most cases, also to achieve net negative emissions to return global warming to 1.5°C following a peak (high confidence). The longer the delay in reducing CO2 emissions towards zero, the larger the likelihood of exceeding 1.5°C, and the heavier the implied reliance on net negative emissions after mid-century to return warming to 1.5°C (high confidence). The faster reduction of net CO2 emissions in 1.5°C compared to 2°C pathways is predominantly achieved by measures that result in less CO2 being produced and emitted, and only to a smaller degree through additional CDR. Limitations on the speed, scale and societal acceptability of CDR deployment also limit the conceivable extent of temperature overshoot. Limits to our understanding of how the carbon cycle responds to net negative emissions increase the uncertainty about the effectiveness of CDR to decline temperatures after a peak. {2.2, 2.3, 2.6, 4.3.7}.
CDR deployed at scale is unproven, and reliance on such technology is a major risk in the ability to limit warming to 1.5°C. CDR is needed less in pathways with particularly strong emphasis on energy efficiency and low demand. The scale and type of CDR deployment varies widely across 1.5°C pathways, with different consequences for achieving sustainable development objectives (high confidence). Some pathways rely more on bioenergy with carbon capture and storage (BECCS), while others rely more on afforestation, which are the two CDR methods most often included in integrated pathways. Trade-offs with other sustainability objectives occur predominantly through increased land, energy, water and investment demand. Bioenergy use is substantial in 1.5°C pathways with or without BECCS due to its multiple roles in decarbonizing energy use. {2.3.1, 2.5.3, 2.6.3, 4.3.7}
It is a widely shared belief that unless policies are enacted to aggressively reduce CO2 emissions that carbon capture technologies will be necessary to avoid the worst impacts of climate change. The video below from the British Geological Society provides a good introduction to this process. Please watch the following (4:45) video.
To Watch Now
MIKE STEPHENSON: Carbon capture and storage, or CCS, is an important new geoengineering solution to climate change. The idea is simple-- we capture CO2 from large point sources, like power stations, cement factories, and oil refineries, and store it, or dispose of it deep underground. This stops the CO2 from getting into the atmosphere.
But we want to know that CCS works, and most of all that it's safe. CCS could be an industry the size of present-day North Sea oil within a few decades. It's simply the reverse of the oil and gas business, putting climate-changing CO2 gas back in the ground after fossil fuels have been burned. This new technology is one of the ways that Britain could reduce its emissions, as well as other big CO2 producers, reduce theirs.
Point sources would be connected in clusters to pipelines that would take CO2 across the country and onshore to wells, where it can be injected into former oil or gas fields, or deep aquifers. The argument is that if the underground storage structure is good enough, the gas will stay there for millions of years, just as natural gas does. Scientists have already shown, at a small scale, that they can capture, transport, and store CO2.
In Britain, we're lucky in being close to one of the largest areas of potential storage for CO2 in Europe. The rocks under the North Sea could absorb about 22 billion tons of CO2, which is 180 years of the UK's 20 largest point sources. This is a really hefty reduction in Britain's emissions.
We're very confident the CO2 won't leak. One of the reasons why is that we know a lot about natural gas, or methane, in the North Sea. We've been extracting natural gas from the North Sea for many years in this country. And as geologists, we know that that methane or natural gas has been in those structures for literally millions of years. It's actually stayed put for millions of years.
So if we engineer the structures in which we hope to store our carbon dioxide to the same level, there's no reason why they should leak at all. The CO2 should stay down there for millions of years. We're also very confident from the science because, for example, we've been injecting CO2 for a long time.
There are various places in the world where CO2 is successfully injected into rocks. For example, in the United States, CO2 is injected for enhanced oil recovery in oilfields, where it flushes the oil, the last remaining oil out of fields. And also, in the Sleipner field in the North Sea, we've been injecting CO2 for well over 10 years, very successfully.
Finally, we feel that we can image, or we can actually see the CO2 collecting in reservoirs. Using very sophisticated seismic techniques, we can actually see the layers of CO2 as they collect. So overall, science gives us a lot of confidence that our containers, the structures where we hope to store CO2 will not leak.
The UK is taking a lead in CCS worldwide, both in terms of British government support for CCS, but also because British scientists are exporting knowledge and expertise to big emitters in the developing world, like China and India.
Large-scale CCS can't happen until we know that it's viable, and that the CO2 won't escape. Would money spent on CCS be better spent on renewable energy, like wind farms? Is CCS a big opportunity for the UK? These are reasonable questions to ask. To answer them, scientists are working around the world to find out whether CCS is a viable long-term option.
There are many good sources of information about CCS, including The Global Status of CCS: 2021 [285], research by the World Resources Institute [286], also from the Energy Information Administration [287], and the International Energy Agency [288]. The best source of current and balanced information on this topic, at an appropriate level of depth and detail are from the source below, which has links to referenced studies.
To Read Now
- Carbon Dioxide Capture and Sequestration [289] (U.S. Environmental Protection Agency).
For an updated (but CCS industry-based) perspective, feel free to page through the Global CCS Institute's The Global Status of CCS: 2019 [290], which is the most recent report as of September 2020.
To Read Now
- "Carbon Capture [279]," Center for Climate and Energy Solutions (you can skip the "Carbon Capture Milestones" section)
- "Direct Air Capture: Resource Considerations and Costs for Carbon Removal [291]" World Resources Institute, 2021
- "You Asked: Does Carbon Capture Technology Actually Work [292]?", (Columbia University, September 2019.)
Nonmarket Strategies - Example
SourceWatch [294], and others (PRWatch [295], desmogblog.com [296],) cite a 2008 report prepared by the executive of a public relations (PR) firm working on behalf of the American Coalition for Clean Coal Electricity. The lengthy report to "friends and family" outlines the work the PR firm did on behalf of "clean coal." Whether you agree with the message or not, this letter presents a fascinating accounting of a remarkable orchestration of highly effective, well-funded nonmarket action.
To Read Now
Read this fascinating report in its entirety, To Hawthorne Friends & Family (this is an archived version saved by Kevin Grandia at Desmogblog [296], as the original version was removed by the Hawthorn Group following a backlash). Keep in mind the source, a public relations firm working on behalf of the American Coalition for Clean Coal Electricity. Feel free to read this article [297] for additional insight into how the Hawthorne Group tried to influence this issue in public and private arenas.
A note from the original author of this course: I saw this strategy in action, maybe you have at some point as well? At a 2008 event in Levittown, PA where President Obama was speaking, Clean Coal hats were everywhere. On my way in, I, like most others, was offered one (free) in the parking lot.
Lesson 6 Assignment
Weekly Activity 6
Please review Canvas calendar for all due dates related to your Nonmarket Analysis Case Study.
Deliverable
Complete "Weekly Activity 6," located in the "Weekly Activities" folder under the Modules tab. The activity may include a variety of question types, such as multiple choice, multiple select, ordering, matching, true/false, and "essay" (in some cases these require independent research and may be quantitative). Be sure to read each question carefully.
Unless specifically instructed otherwise, the answers to all questions come from the material presented in the course lesson. Do NOT go "googling around" to find an answer. To complete the Activity successfully, you will need to read the lesson, and all assigned readings, fully and carefully.
Each week a few questions may involve research beyond the material presented in the course lesson. This "research" requirement will be made clear in the question instructions. Be sure to allow yourself time for this! You will be graded on the correctness and quality of your answers. Make your answers as orderly and clear as possible. Help me understand what you are thinking and include data where relevant. Remember, numbers should ALWAYS be accompanied by units of measure (not "300" but "300 kW"). You must provide ALL calculations/equations to receive full credit - try to "talk me through" how you did the analysis.
This Activity is to be done individually and is to represent YOUR OWN WORK. (See Academic Integrity and Research Ethics [52] for a full description of the College's policy related to Academic Integrity and penalties for violation.)
The Activity is not timed, but does close at midnight EST on the due date as shown on the Calendar.
If you have questions about the assignment, please post them to the "Questions about EME 444?" Discussion Forum. I am happy to provide clarification and guidance to help you understand the material and questions (really!). Of course, it is best to ask early.
Summary and Final Tasks
In this lesson, you learned about the coal industry--from mining and extraction to greenhouse gas emissions, as well as estimates of coal reserves around the world and global demand for coal. We also reviewed the status and technologies for managing the carbon impacts of coal, including new methods of combustion and carbon capture and storage.
You learned:
- about standard forms of coal and their properties;
- about coal's role in the carbon cycle, including photosynthesis, coalification, and combustion;
- concepts and terminology related to surface and underground mining, as well as coal-fired technologies;
- about coal's role in greenhouse gas emissions, including carbon dioxide and methane;
- to research and report on global coal reserves and consumption;
- the technology and status of clean coal technologies;
- the technology and status of carbon capture and storage (CCS);
- to recognize and analyze externalities related to the coal industry.
Have you completed everything?
You have reached the end of Lesson 6! Double-check the list of requirements on the first page of this lesson to make sure you have completed all of the activities listed there.
7 Natural Gas
Introduction
Overview of Lesson 7
With this lesson, we continue our survey of energy industries based on energy sources. In this lesson, we will review the natural gas industry--including exploration and extraction, transportation, resource estimates, demand and, usage and externalities.
What will we learn?
By the end of this lesson, you should be able to...
- describe sources of natural gas;
- provide a simple explanation of seismology and its role in resource exploration;
- understand and use concepts and terminology related to on- and off-shore natural gas extraction;
- describe major components of the US natural gas pipeline system;
- explain benefits and uses of liquefied natural gas (LNG);
- discern qualifiers in resource allocations, and report on current estimates;
- weigh the relative advantages and externalities of hydraulic fracturing;
- about methane leakage and related considerations.
What is due for Lesson 7?
The table below provides an overview of the requirements for Lesson 7. For details, please see individual assignments.
Please refer to the Calendar in Canvas for specific time frames and due dates.
|
REQUIREMENT |
SUBMITTING YOUR WORK |
|---|---|
| Read Lesson 7 content and any additional assigned material | Not submitted. |
| Weekly Activity 7 | Yes—Complete Activity located in the Modules Tab in Canvas. |
| Case Study--work with others on your Team to prepare Case Study, following course guidelines | Check Canvas calendar for all Case Study Due Dates. |
About Natural Gas

What is Natural Gas?
Natural gas, like other fossil fuels (coal and oil), is formed from the ancient decaying remains of plants and animals. Over millions of years, pressure and heat change some of this organic matter into natural gas trapped as bubbles beneath and in layers of rock. Natural gas formed in this way is known as thermogenic gas.
The primary component of natural gas is our old friend methane, CH4, usually around 70 to 90%. Natural gas also contains ethane, propane, butane and may have some carbon dioxide, oxygen, nitrogen, hydrogen sulphide and trace amounts of rare gases (e.g. A, He, Ne, Xe).
Natural gas is also created through biogenic processes. ("Biogenic" means produced by living organisms.) In this type of process, small microorganisms (bacteria) chemically break down (digest) organic matter to produce methane. These microorganisms are anaerobic, meaning they thrive in environments that have no oxygen. They live in shallow sediments, marshes, bogs and landfills, as well as the intestines of most animals, including humans.
One example of biogenic methane (or biogas) is landfill gas. New technologies allow this gas to be harvested and added to the supply of natural gas.
Anaerobic processes for producing methane may also be managed in a digester (an airtight tank) or a covered lagoon (a pond used to store manure) for waste treatment.
Natural gas can be a confusing term. We put "gas" in our car, but this is not "natural gas." The "gas" we use in our BBQs is propane (which is also known as liquid petroleum gas, or LPG), commonly found in natural gas, but not natural gas itself.
And while we're at it, another interesting thing about natural gas...in its natural form, natural gas is odorless. The "rotten egg" smell is added before it gets to the end user for safety reasons to help detect leaks. (Yes, someone chose that smell.) The odorant is called mercaptan.
Units of Measure
Like other gases, natural gas is commonly measured as a volume expressed as hundreds of cubic feet (ccf), thousands of cubic feet (Mcf), millions of cubic feet (MMcf) or billions and trillions of cubic feet (Bcf and Tcf, respectively).
Another way natural gas may be measured is by its energy or heat content, expressed as British Thermal Units, or BTUs. A BTU is the amount of natural gas required to heat one pound of water one degree. One cubic foot of natural gas contains about 1,027 BTUs, and thus 1 ccf contains about 102,700 BTUs. Residential natural gas is usually sold in ccfs. A therm, sometimes used for billing purposes, is exactly 100,000 BTUs.
Finding and Extracting Natural Gas
Exploration
The section below gives an overview of the exploration activities necessary to locate natural gas resources. Most of the content has been excerpted from Exploration [299]. If you would like more information and far more detail (and pictures!), you are encouraged to consult this source.
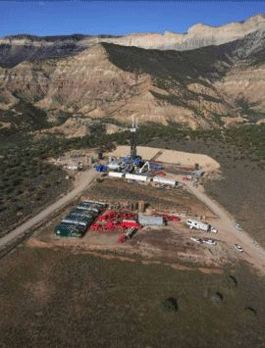
"Exploration for natural gas typically begins with geologists examining the surface structure of the earth, and determining areas where it is geologically likely that petroleum or gas deposits might exist. . . . By surveying and mapping the surface and sub-surface characteristics of a certain area, the geologist can extrapolate which areas are most likely to contain a petroleum or natural gas reservoir.
"Seismology, . . . the study of how energy, in the form of seismic waves, moves through the Earth's crust and interacts differently with various types of underground formations, . . . [is also] used to help locate underground fossil fuel formations.
"The basic concept of seismology is quite simple. As the Earth's crust is composed of different layers, each with its own properties, energy (in the form of seismic waves) traveling underground interacts differently with each of these layers. These seismic waves, emitted from a source, will travel through the earth, but also be reflected back toward the source by the different underground layers. Through seismology, geophysicists are able to artificially create vibrations on the surface and record how these vibrations are reflected back to the surface, revealing the properties of the geology beneath.
"An analogy that makes intuitive sense is that of bouncing a rubber ball. A rubber ball that is dropped on concrete will bounce in a much different way than a rubber ball dropped on sand. In the same manner, seismic waves sent underground will reflect off dense layers of rock much differently than extremely porous layers of rock, allowing the geologist to infer from seismic data exactly what layers exist underground and at what depth. While the actual use of seismology in practice is quite a bit more complicated and technical, this basic concept still holds"
Exploration [299], retrieved February 2014).
Seismology is also used for off-shore exploration, along with other techniques including measuring gravitational and magnetic differences and seismic imaging. Ultimately, the best way to gain a full understanding of subsurface geology and the potential for natural gas deposits to exist in a given area is to drill an exploratory well.
Extraction
To Read Now
Visit NaturalGas.org [300] (Website navigation is a little tricky, so direct links are below):
- Extraction [301]
- Onshore [302] (scan, read if you're interested and have time)
- Shale Shock: Hydraulic Fracturing [303]
- Offshore [304] (scan, read if you're interested and have time)
Transporting Natural Gas
Transportation Process and Flow
Like all energy sources, natural gas has to be available at the point of use. As a gas, the low density of natural gas presents special challenges for transportation. Because of its volume, it is not easily stored or moved by vehicle. For transportation across land, natural gas is usually moved through a network of pipelines. For transport across bodies of water, it is liquefied and carried by ship. The map below from the EIA shows the pipeline network in the U.S.
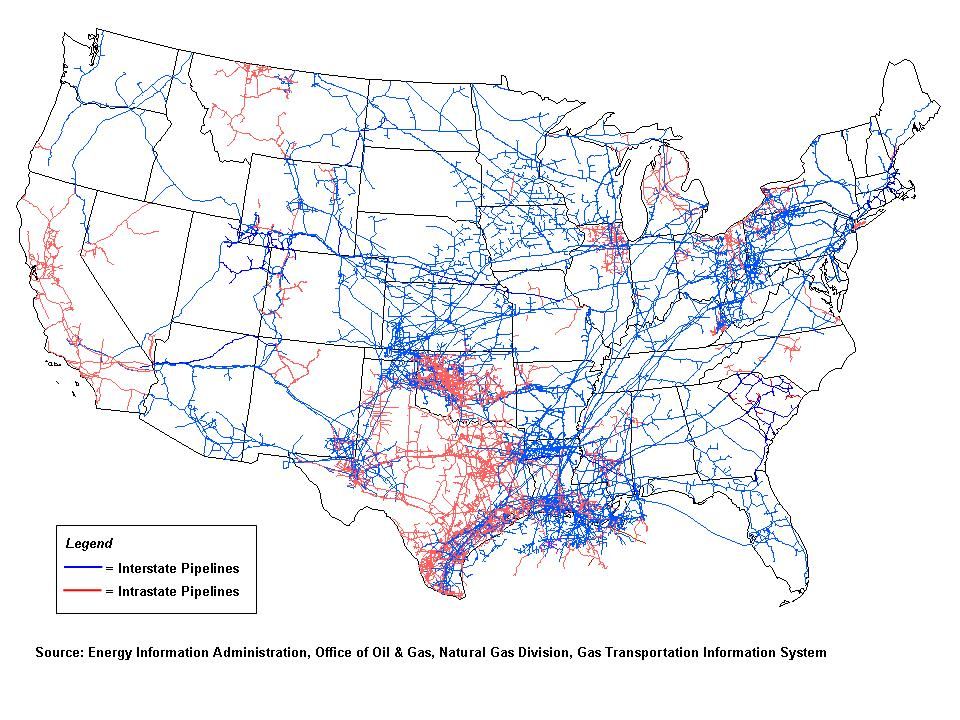
One if by Land
The section below describes the major components of the natural gas pipeline system in the United States. Most of the content has been excerpted from About U.S. Natural Gas Pipelines - Transportation Process and Flow [306]. (If you would like more information and far more detail, you are encouraged to consult this source.)
The Natural Gas Gathering System

A natural gas pipeline system begins at a natural gas producing well or field. In the producing area many of the pipeline systems are primarily involved in "gathering" operations. That is, a pipeline is connected to a producing well, converging with pipes from other wells where the natural gas stream may be subjected to an extraction process to remove water and other impurities if needed. Natural gas exiting the production field is usually referred to as "wet" natural gas if it still contains significant amounts of hydrocarbon liquids and contaminants. . . .
Once it leaves the producing area, a pipeline system directs flow either to a natural gas processing plant or directly to the mainline transmission grid. Non-associated natural gas, that is, natural gas that is not in contact with significant quantities of crude oil in the reservoir, is sometimes of pipeline-quality after undergoing a decontamination process in the production area, and does not need to flow through a processing plant prior to entering the mainline transmission system.
The Natural Gas Processing Plant
At the wellhead, natural gas is usually a mix of mostly methane along with other hydrocarbons including ethane, propane, butane, and pentanes. Raw natural gas also contains water vapor, hydrogen sulfide (H2S), carbon dioxide, helium, nitrogen, and other compounds. This is why natural gas is sent to a processing plant after being extracted.
The principal service provided by a natural gas processing plant to the natural gas mainline transmission network is that it produces pipeline-quality natural gas. Natural gas mainline transmission systems are designed to operate within certain tolerances. Natural gas entering the system that is not within certain specific gravities, pressures, Btu content range, or water content level will cause operational problems, pipeline deterioration, or even cause pipeline rupture.
In processing, associated hydrocarbons (e.g., ethane, propane, butane, and pentanes) are removed and captured from natural gas and are known as "natural gas liquids " (NGLs), valuable by-products of natural gas processing. Natural gas processing plants also extract contaminants from the natural gas stream to produce pipeline quality "dry" gas, which is transported to end-users. "Dry" or "consumer grade" gas is almost pure methane and is what is used by consumers.
The Transmission Grid and Compressor Stations
The natural gas mainline (transmission line) is a wide-diameter, often-times long-distance, portion of a natural gas pipeline system, excluding laterals, located between the gathering system (production area), natural gas processing plant, other receipt points, and the principal customer service area(s). The lateral, usually of smaller diameter, branches off the mainline natural gas pipeline to connect with or serve a specific customer or group of customers. . . .
Between the producing area, or supply source, and the market area, a number of compressor stations are located along the transmission system. These stations contain one or more compressor units whose purpose is to receive the transmission flow (which has decreased in pressure since the previous compressor station) at an intake point, increase the pressure and rate of flow, and thus, maintain the movement of natural gas along the pipeline. . . .
To address the potential for pipeline rupture, safety cutoff meters are installed along a mainline transmission system route. Devices located at strategic points are designed to detect a drop in pressure that would result from a downstream or upstream pipeline rupture and automatically stop the flow of natural gas beyond its location.

Natural Gas Market Centers/Hubs
Natural gas market centers and hubs evolved, beginning in the late 1980s, as an outgrowth of natural gas market restructuring and the execution of a number of Federal Energy Regulatory Commission’s (FERC) Orders culminating in Order 636 issued in 1992. Order 636 mandated that interstate natural gas pipeline companies transform themselves from buyers and sellers of natural gas to strictly natural gas transporters. Market centers and hubs were developed to provide new natural gas shippers with many of the physical capabilities and administrative support services formally handled by the interstate pipeline company as “bundled” sales services.
Two key services offered by market centers/hubs are transportation between and interconnections with other pipelines and the physical coverage of short-term receipt/delivery balancing needs. . . .
Underground Storage Facilities
At the end of the mainline transmission system, and sometimes at its beginning and in between, underground natural gas storage and LNG (liquefied natural gas) facilities provide for inventory management, supply backup, and the access to natural gas to maintain the balance of the system. There are three principal types of underground storage sites used in the United States today: depleted reservoirs in oil and/or gas fields, aquifers, and salt cavern formations. In one or two cases mine caverns have been used. Two of the most important characteristics of an underground storage reservoir are the capability to hold natural gas for future use, and the rate at which natural gas inventory can be injected and withdrawn (its deliverability rate). . . .
Peak Shaving
Underground natural gas storage inventories provide suppliers with the means to meet peak customer requirements up to a point. Beyond that point the distribution system still must be capable of meeting customer short-term peaking and volatile swing demands that occur on a daily and even hourly basis. During periods of extreme usage, peaking facilities, as well as other sources of temporary storage, are relied upon to supplement system and underground storage supplies.
Peaking needs are met in several ways. Some underground storage sites are designed to provide peaking service, but most often LNG (liquefied natural gas) in storage and liquefied petroleum gas such as propane are vaporized and injected into the natural gas distribution system supply to meet instant requirements. Short-term linepacking is also used to meet anticipated surge requirements.
The use of peaking facilities, as well as underground storage, is essentially a risk-management calculation, known as peak-shaving. The cost of installing these facilities is such that the incremental cost per unit is expensive. However, the cost of a service interruption, as well as the cost to an industrial customer in lost production, may be much higher. In the case of underground storage, a suitable site may not be locally available. The only other alternative might be to build or reserve the needed additional capacity on the pipeline network. Each alternative entails a cost.
A local natural gas distribution company (LDC) relies on supplemental supply sources (underground storage, LNG, and propane) and uses linepacking to "shave" as much of the difference between the total maximum user requirements (on a peak day or shorter period) and the baseload customer requirements (the normal or average) daily usage. Each unit "shaved" represents less demand charges (for reserving pipeline capacity on the trucklines between supply and market areas) that the LDC must pay. The objective is to maintain sufficient local underground natural gas storage capacity and have in place additional supply sources such as LNG and propane air to meet large shifts in daily demand, thereby minimizing capacity reservation costs on the supplying pipeline (About U.S. Natural Gas Pipelines - Transportation Process and Flow [308]).
Two if By Sea
When natural gas is cooled to about -260°F, it becomes a liquid and, cleverly, is called Liquefied Natural Gas or LNG. In this form, it takes up about one six hundredth the volume of gaseous natural gas.
This has clear advantages for transportation and storage. Because it is easier to move, LNG can give "economically stranded" natural gas deposits access to markets.
LNG is shipped in specialized tankers with insulated walls. This makes it possible for countries that are separated by large bodies of water to import and export gas to one another.
LNG also makes it possible to store quantities of natural gas economically at sites where geologic conditions are not suitable for underground gas storage. This is especially important when LNG is stored at peak-shaving facilities, where it can be gasified and added to pipelines to meet consumer needs at times of peak demand. The videos below provide a good overview of the LNG production chain, including the liquefaction process. (Note that both videos have a closed-captioning option, and a link to the transcripts is available as well.) Please watch the following (3:44) and (2:23) videos:
PRESENTER: LNG, Liquefied Natural Gas. LNG is natural gas that has been cooled to at least minus 162 degrees Celsius to transform the gas into a liquid for transportation purposes.
To understand why liquefying natural gas is important, we first need to understand natural gas's physical properties. Methane has a very low density and is therefore costly to transport and store. When natural gas is liquefied, it occupies 600 times less space than as a gas.
Normal gas pipelines can be used to transport gas on land or for short ocean crossings. However, long distances and overseas transport of natural gas via pipeline is not economically feasible. Liquefying natural gas makes it possible to transport gas where pipelines cannot be built, for example, across the ocean.
The four main elements of the LNG value chain are, one, exploration and production, two, liquefaction, three, shipping, four, storage and regasification. At the receiving terminal, LNG is unloaded and stored before being regasified and transported by pipe to the end users.
The demand for LNG is rising in markets with limited domestic gas production or pipeline imports. This increase is primarily from growing Asian economies, particularly driven by their desire for cleaner fuels and by the shutdown of nuclear power plants.
The largest producer of LNG in the world is Qatar with a liquefaction capacity in 2013 of roughly one-quarter of the global LNG production. Japan has always been the largest importer of LNG and in 2013 consumed over 37% of global LNG trade.
The extraction process also has environmental and social issues to consider. LNG projects require large energy imports for liquefaction and regasification and therefore have associated greenhouse gas emissions.
Spills pose concerns to local communities. There have been two accidents connected to LNG. But in general, liquefaction, LNG shipping, storage, and regasification have proven to be safe. LNG projects require large upfront capital investments, which can be a challenge in moving projects ahead.
That's LNG.
PRESENTER: Heat and cold, Shakespeare told us to fear no more the heat of the sun nor the furious winter's rages, and natural gas now rises above other fuels to beat those forces back.
Natural gas is abundant, at least in some parts of the world, but how do we get it from regions that have it to regions that don't.? So we cool natural gas until it condenses into a compact liquid. Now we can ship it on special tankers.
Natural gas is mostly methane, with varying amounts of other hydrocarbons and impurities that can freeze and foul equipment. We remove the impurities in the pretreatment area of the LNG plant. Here we also remove heavy hydrocarbons, inert gases, and other gases that accompany the methane that is natural gas.
Now we can begin to liquefy this clean gas. Many technologies can do that, but also based on the same cyclic process that serves our kitchen refrigerators. That means we need some kind of refrigerant to remove heat from the gas, so it'll condense into liquid. Here's how it works.
First, the liquid refrigerant expands from a high pressure to a low pressure, turning it into a cold mixture of liquid and some vapor. Next, it passes through a heat exchanger that uses heat from the natural gas to turn the refrigerant into pure vapor. The natural gas is now a lot colder, and we can compress the refrigerant back to its high pressure. We cool the hot refrigerant in another heat exchanger until it condenses back into liquid, then we expand the refrigerant again to repeat the cycle.
The key to cooling condensing natural gas into LNG is flashing the liquid refrigerant. And once the gas is LNG, we store it in tanks at very nearly atmospheric pressure. Liquid natural gas looks like water, except that it boils off at room temperature. It's odorless, colorless, non-toxic, and virtually non-flammable.
The cryogenic LNG stays in these storage tanks at a constant temperature between minus 159 and 162 Celsius. Evaporation helps keep it cool and liquid while it's stored on land or in the ship. We capture the vapors and either burn them for fuel or we re-condense them and send them back to storage. Who then uses the LNG? Typically, a power plant or industrial user, they convert the liquid back to a gas, so it can be burned as a fuel or used as a feedstock.
More than half of today's LNG comes from just four countries-- Qatar, Indonesia, Australia, and Malaysia, but that's soon likely to shift. New natural gas discoveries promised to send Australia, the US, and Africa to the forefront.
The companies that build these plants have much to think about. Who will buy their gas? How best to meet buyer specifications. How much LNG will buyers want? Another thing, buyers have to make long-term commitments before suppliers can invest in new units.
If this is a golden age for natural gas, it rests upon vast ingenuity and daring. What gulfs of heat and cold we must cross to provide that Elixir of warmth anywhere in the world.
To Read Now
- Read "Liquefied Natural Gas (LNG) [309]" from the U.S. Department of Energy's Office of Fossil Energy.
- For some insight into the recent and projected global LNG market, read the 2023 Shell LNG Outlook [310]. Note in particular how the Russia-Ukraine conflict has affected the global LNG market.
- LNG is not embraced by everyone. Read "Canada’s LNG dreams fade as blockades add new costs to industry [311]" by Kevin Orland for some insight into some recent nonmarket action in Canada.
Optional Reading
- Browse through "LNG Monthly [312]" and "Summary of LNG Export Applications [313]" from the Office of Fossil Energy. (These are both linked to in the article above.)
- See "U.S. Liquefied Natural Gas Exports, A Primer on the Process and the Debate [314]" (Center for American Progress). This is an older reading, so the statistics are a little outdated, but the description of the process and other considerations are accurate.
The map below, Major Trade Movements 2021, is from BP Statistical Review of World Energy 202 [315]2 (page 36). For a larger version of the map and more information (you may need to do this for this week's questions), please see the original source.
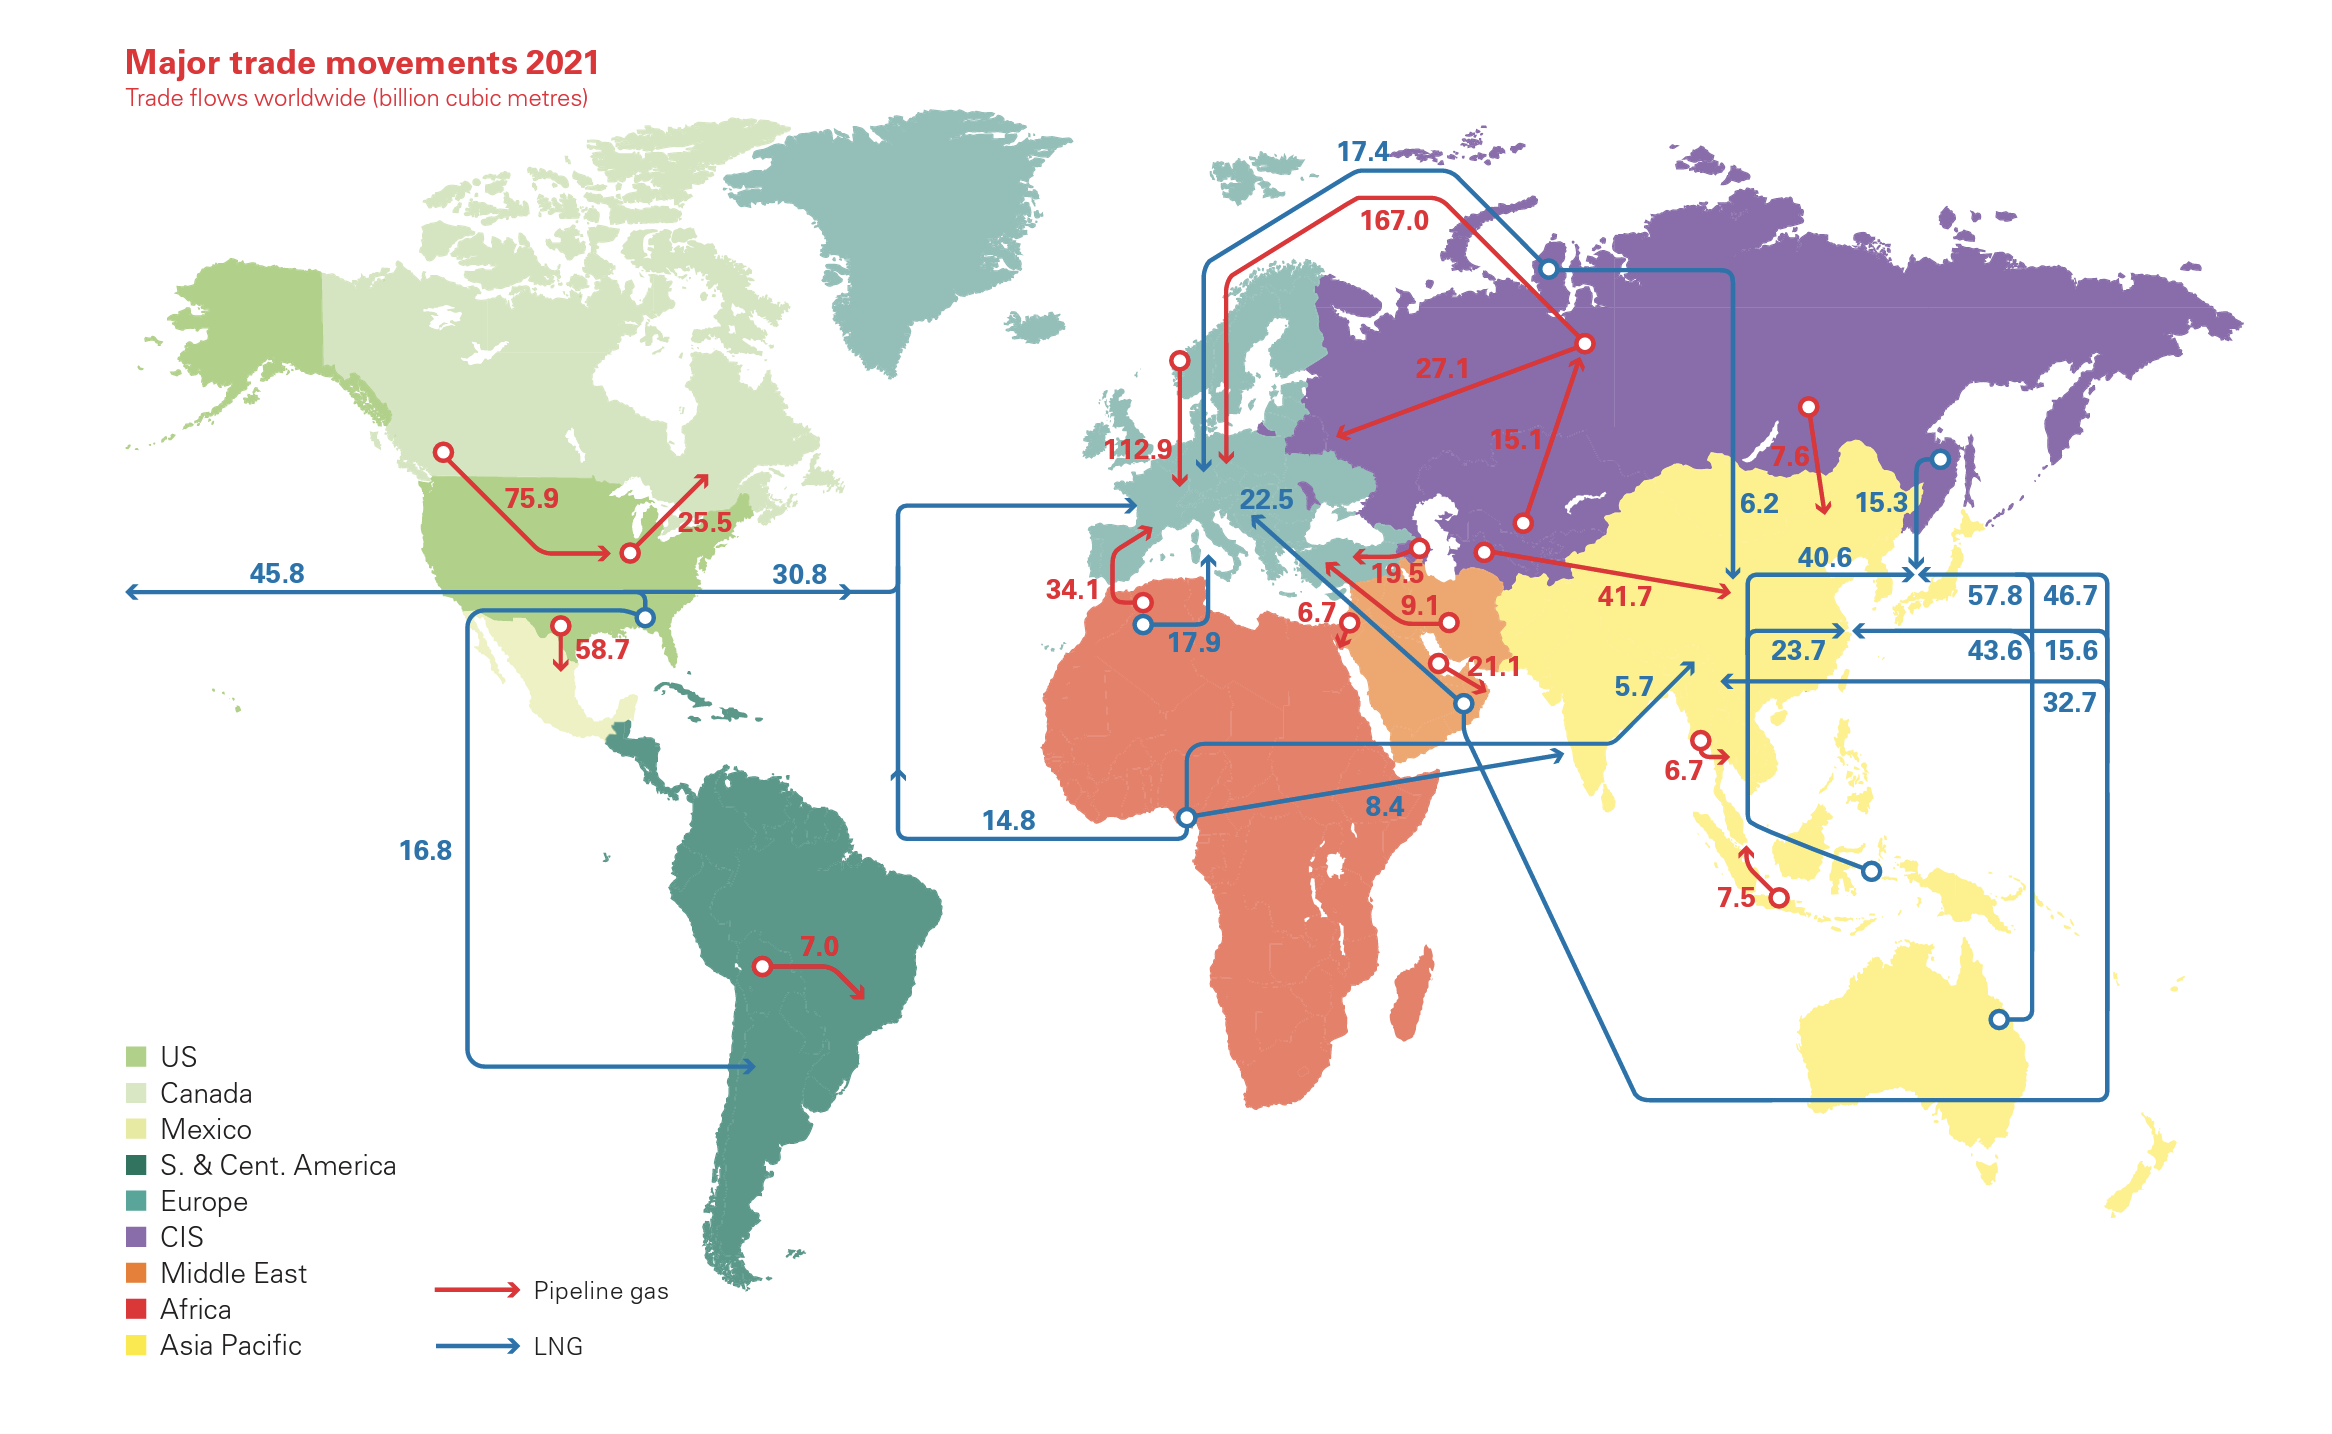
Where is Natural Gas located; how much is there?
To Read Now
- Go to the Energy Information Administration's (EIA's) International Energy Outlook 2019 [255] (IEO 2019). Read through the entire natural gas section. (Note that new versions of the IEO use the same model, so none of the projections have changed substantially.)
- (OPTIONAL) The EIA produces an IEO every year. The 2016 IEO (as I noted previously) provides more comprehensive information. Visit the IEO 2016 [275] and navigate to the "Natural Gas" section. Read or browse as much as you like.
This document includes the following chart, which provides a snapshot of projected natural gas consumption through 2040:
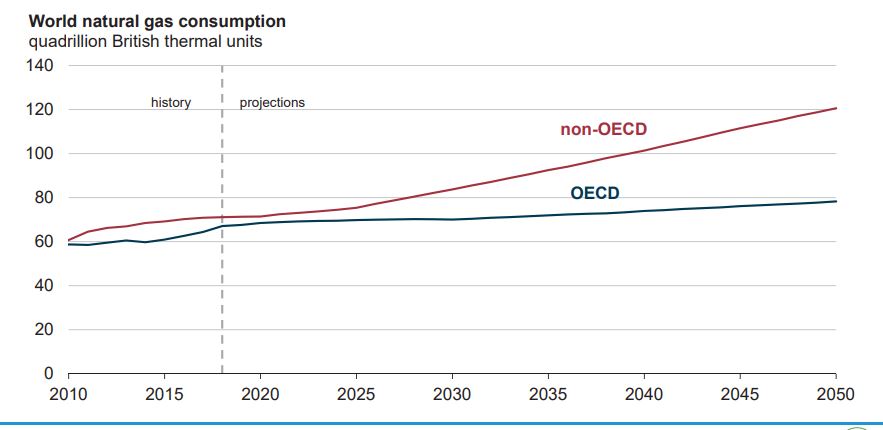
| Year | OECD | Non-OECD |
|---|---|---|
| 2015 | 59.0 | 65.1 |
| 2020 | 59.9 | 66.9 |
| 2025 | 62.0 | 76.0 |
| 2030 | 64.8 | 83.7 |
| 2035 | 69.1 | 93.2 |
| 2040 | 73.5 | 103.5 |
In the opening section, the 2016 Outlook report contains this statement, which emphasizes the role of unconventional natural gas reserves.
Although there is more to learn about the extent of the world's tight gas, shale gas, and coalbed methane resource base, the IEO2016 Reference case projects a substantial increase in those supplies—especially in the United States and also in Canada and China...The application of horizontal drilling and hydraulic fracturing technologies has made it possible to develop the U.S. shale gas resource, contributing to a near doubling of estimates for total U.S. technically recoverable natural gas resources over the past decade. Shale gas accounts for more than half of U.S. natural gas production in the IEO2016 Reference case, and tight gas, shale gas, and coalbed methane resources in Canada and China account for about 80% of total production in 2040 in those countries.
Things had not changed by the time the 2017 report was published.
- In the United States and China, increases in natural gas production between 2016 and 2040 are projected to mainly come from the development of shale resources...
- Shale resource development accounts for 50% of U.S. natural gas production in 2015, increasing to nearly 70% in 2040, as the country leverages advances in horizontal drilling and hydraulic fracturing techniques and taps into newly discovered technically recoverable reserves.
- Shale resource developments are projected to account for nearly 50% of China’s natural gas production by 2040, making the country the world’s largest shale gas producer after the United States.
- In Canada, future natural gas production is expected to come mainly from tight resources, from several regions in British Columbia and Alberta.
Remember, the IEO "Reference" case refers to IEO projections about the future that are based on the assumption that legislation and policy related to energy stays the same as when the report was generated. The Reference case "does not incorporate prospective legislation or policies that might affect energy markets."
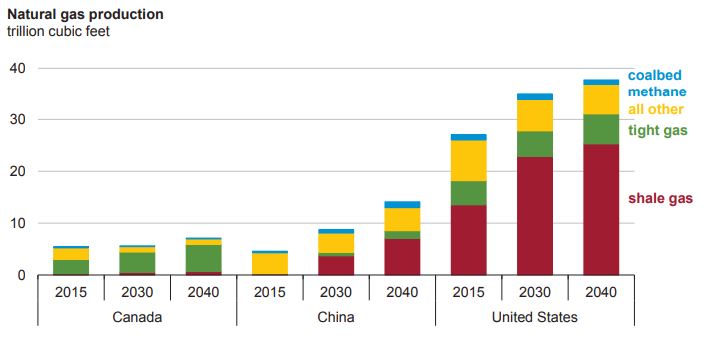
| gas type | 2015 | 2030 | 2040 |
|---|---|---|---|
| tight gas, shale gas, and coalbed methane | 19.2 | 28.8 | 31.9 |
| other gas | 7.8 | 6.1 | 5.8 |
| total gas | 27.0 | 34.9 | 37.7 |
| gas type | 2015 | 2030 | 2040 |
|---|---|---|---|
| tight gas, shale gas, and coalbed methane | 3.2 | 4.4 | 5.9 |
| other gas | 2.2 | 1.3 | 1.2 |
| total gas | 5.5 | 5.6 | 7.1 |
| gas type | 2015 | 2030 | 2040 |
|---|---|---|---|
| tight gas, shale gas, and coalbed methane | 0.6 | 5.0 | 9.7 |
| other gas | 4.1 | 3.7 | 4.5 |
| total gas | 4.6 | 8.7 | 14.1 |
Clearly, shale gas, and to a lesser extent, tight gas and coal bed methane, are to play an increasingly important role in global natural gas production!
The 2016 IEO provides the following chart for natural gas proved reserves (this information is not available in the 2017 or 2019 reports).
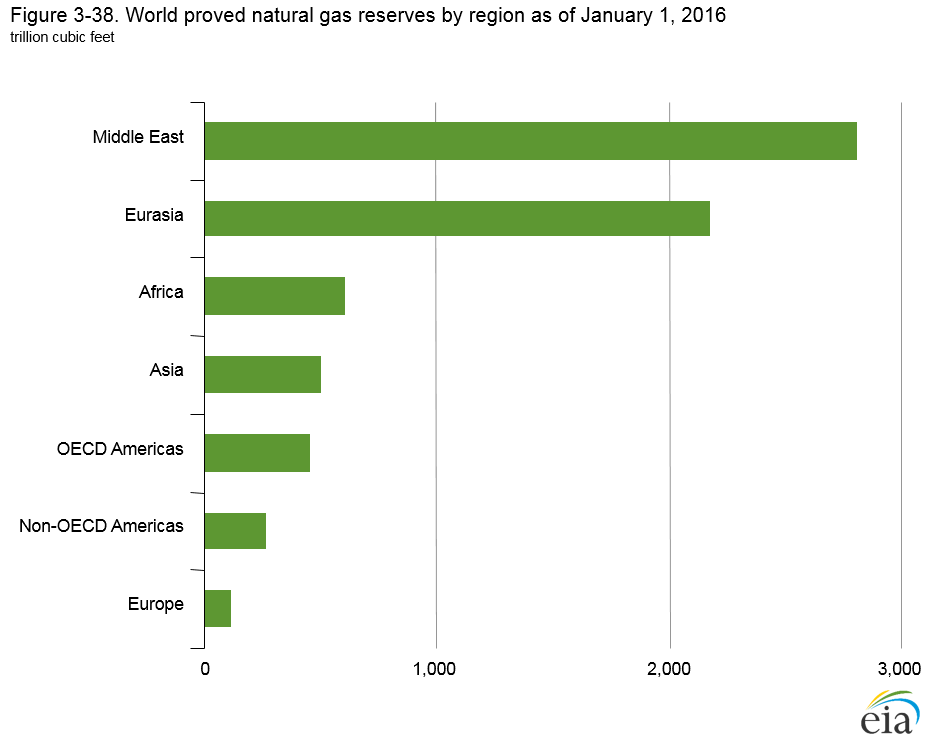
| Country | Trillion Cubic Feet |
|---|---|
| Middle East | 2,810.23 |
| Eurasia | 2,184.56 |
| Africa | 605.27 |
| Asia | 502.12 |
| OECD Americas | 457.27 |
| Non-OECD Americas | 271.62 |
| Europe | 118.71 |
The data in the second chart represents proved reserves. The Outlook study says, "the world's proved natural gas reserves have grown by about 40% over the past 20 years, to a total of 6,950 Tcf as of January 1, 2016."
As with coal, "proved reserves" means the natural gas that has been discovered and defined at a significant level of certainty and that can be economically recovered. "Technically recoverable" resources are estimates of the amount of gas that can be recovered, using current technology, without regard to cost. The chart below demonstrates that even as natural gas use increases, proved reserves continue to (paradoxically) increase. This is the result of improved extraction technology rendering natural gas increasingly economic, particularly with regard to unconventional sources. (For example, the 2013 International Energy Outlook stated that reserves had grown by 39 percent over the past 20 years, and that the total reserves were 6,793 Tcf, both of which are smaller than the 2016 numbers.) The chart below indicates the proved reserves of various regions since 1960. The exact numbers in the chart are not important, but it should give you a feel for the general trend over time. (In case you have trouble seeing it, the top line is the Middle East, the blue line is Africa, the brown line is Asia & Oceana, the black line is North America, the green line is Central & South America, and Europe is in yellow.)
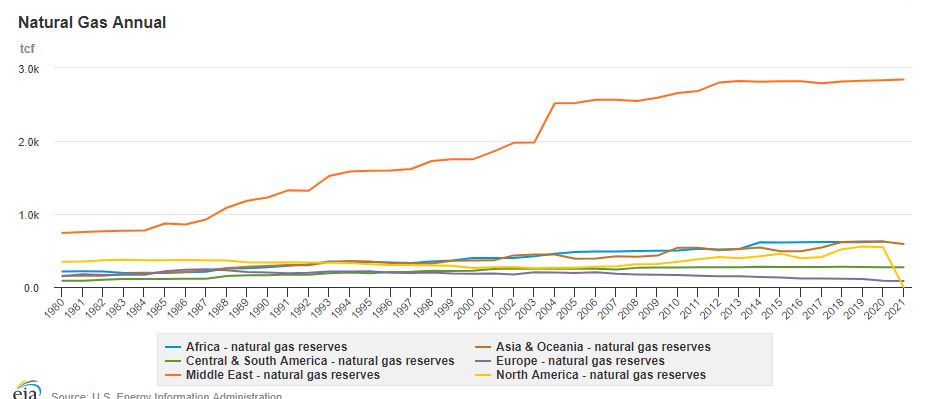
The nuances of resource estimates for non-renewable energy sources are rather complex. (For those who are interested, here is a full explanation of natural gas resource classifications [322].) The larger point is the importance of being fully aware of these concepts and qualifiers whenever you are working with or analyzing data related to reserves of non-renewable energy sources.
Shale Gas, the Play
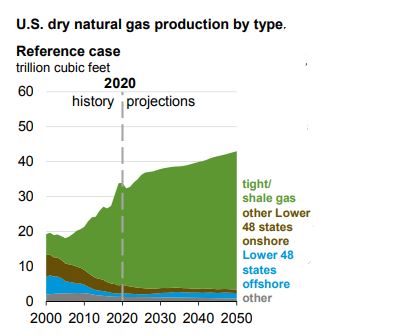
Contributing mightily to the interest in natural gas, are new extraction techniques that make it economical to recover gas from "unconventional" sources, which (as defined by the EIA) include tight gas, shale gas, and coalbed methane.
Coalbed methane we understand from our previous lesson. "Tight gas" refers to natural gas that is locked in extraordinarily impermeable hard rock or that is trapped in sandstone or limestone formations that are impermeable or nonporous ("tight sand"). "Shale gas" refers to natural gas that is trapped within shale, a formation of fine-grained sedimentary rocks.
In the International Energy Outlook 2013 [324], the EIA reports, "In the United States, one of the keys to increasing natural gas production has been advances in the application of horizontal drilling and hydraulic fracturing technologies, which have made it possible to develop the country's vast shale gas resources and have contributed to a near doubling of estimates for total U.S. technically recoverable natural gas resources over the past decade" (p. 41). This trend, as clearly indicated above, continues today.
To Read Now
From the Department of Energy's Energy in Brief series, read "What is shale gas and why is it important? [325]" (the statistics are outdated, but the descriptions are concise and valid) and "Natural Gas and the Environment [326]" from the U.S. EIA.
| air pollutant | natural gas | oil | coal |
|---|---|---|---|
| Carbon dioxide | 117,000 | 164,000 | 208,000 |
| carbon monoxide | 40 | 33 | 208 |
| nitrogen oxides | 92 | 448 | 457 |
| sulfur dioxide | 0.6 | 1,122 | 2,591 |
| particulates | 7.0 | 84 | 2,744 |
| formaldehyde | 0.750 | 0.220 | 0.221 |
| mercury | 0.000 | 0.007 | 0.016 |
Natural Gas Demand and Uses
Demand

| region | Consumption (billion cubic tons | Percent of total |
|---|---|---|
| North America | 37,481 | 26% |
| Asia & Oceana | 29,325 | 20% |
| Eurasia | 21,426 | 17% |
| Europe | 18,908 | 15% |
| Middle East | 18,809 | 14% |
| Central & South America | 5,832 | 4% |
| Africa | 5,259 | 4% |
According to the Energy Information Administration, the world consumed more than138,000 billion cubic feet (Bcf) of natural gas in 2018. The chart above depicts how this consumption was distributed worldwide. Overall, in 2018, a little over 27% of the world's primary energy consumption was from natural gas, according to BP's 2020 Statistical Review of World Energy [329].
Regarding future demand, in International Energy Outlook 2016 [275], the Energy Information Administration reports,
By energy source, natural gas accounts for the largest increase in world primary energy consumption...Natural gas remains a key fuel in the electric power sector and industrial sector. In the power sector, natural gas is an attractive choice for new generating plants because of its fuel efficiency. Natural gas also burns cleaner than coal or petroleum products, and as more governments begin implementing national or regional plans to reduce carbon dioxide (CO2) emissions, they may encourage the use of natural gas to displace more carbon-intensive coal and liquid fuels...Consumption of natural gas increases in every IEO region..
As you might guess (and may recall reading previously), as natural gas becomes a more popular fuel source worldwide, international trade will also increase. As you can see, the U.S., Russia, and China will play major roles in this. As stated in the IEO 2019 [274],
- Asia experiences the greatest growth in global natural gas consumption because the economies of countries such as China and India are rapidly expanding. Non-OECD natural gas demand in Asia increasingly outpaces regional supply, despite relatively large increases in natural gas production in China. As a result, net imports of natural gas to Asia (all countries) more than triple from 2018 to 2050
- Despite strong growth in LNG trade, pipeline flows continue to account for most of the interregional natural gas trade during the projection period as pipeline infrastructure is further developed
- Non-OECD Europe and Eurasia (primarily Russia) remains the largest net exporter of natural gas in 2050, followed by the Middle East. During this time, OECD Europe increases its dependence on Russian pipeline natural gas, and non-OECD Asia imports a growing amount of LNG.
- The Americas grow as a net exporter of natural gas, driven mostly by LNG shipments from the United States, to countries outside the region.
Uses
Natural gas is used in many ways, including power generation, residential heating and appliances (cooking, clothes dryers) and in the production of many products.
According to the U.S. EIA [330], in the United States, about 34% of all the energy we used came from natural gas in 2020. About 38% of the natural gas we used was for electricity generation (up from 30% in 2014). Another 33% was used for industrial purposes, and about 15% was used in homes, while 10% was used in commercial buildings. Only 3% was used for transportation.
Natural gas can be used in several different ways to generate electricity--it may be burned to create steam that turns a turbine (similar to a coal-fired plant) or may be used with a gas turbine, where hot gases from the burning gas turn the turbine (instead of heating steam). Gas turbines may be turned on and off quickly, making them well suited to meet peak load demands. Gas turbines are also used in combined cycle units, where the waste heat from the gas turbine is used to create steam and drive a turbine. These arrangements are much more efficient than steam or gas turbines alone - many combined cycle units approach 60% efficiency, compared to just over 30% for coal and nuclear. Because of its widespread availability and other advantages, natural gas is used for distributed generation--where electricity is generated at or very near the point of use, often a commercial or industrial site.
Natural gas is also used to produce steel, glass, paper, clothing, and brick. Many products use natural gas as a raw material, such as paints, fertilizer, plastics, antifreeze, dyes, photographic film, medicines, and explosives.
In the United States, more than half of the homes use natural gas as their main heating fuel. In our homes we also use it for cooking, water heaters, clothes dryers, and other appliances.
To Read Now
The increasing use of natural gas for electricity generation has been an important development in the global power sector. Though it has been outcompeting coal (for the most part) in the U.S., in some situations and locations, other sources are replacing natural gas, as you will see below.
- Read "Energy Transitions Begin to Leave Out Natural Gas Power [331]" from Power Magazine and "Natural gas prices, not 'war on coal,' were key to coal power decline: study [276]" from Phys.org.
Hydrogen Production


Natural gas is also used in the production of hydrogen to power fuel cells. [A fuel cell converts chemical energy of a fuel (usually hydrogen) and an oxidant into electricity. If you're interested, visit the DOE's Fuel Cell Technologies Office [333].]
Remember that natural gas is mostly methane and that methane is CH4? Aha, makes sense! Hydrogen is produced from natural gas through a type of thermal process called natural gas reforming.
To Read Now
- Visit the Department of Energy's Fuel Cell Technologies Program. Read "Natural Gas Reforming [334]." (And of course, you are encouraged to poke around more on this nifty topic, if you have the time and interest.)
- When hydrogen is used to generate energy, there are no emissions. However, the production of hydrogen almost always has a carbon footprint. For an overview of the impact of various forms of hydrogen production, read the following sections of "Decarbonized Hydrogen in the US Power and Industrial Sectors: Identifying and Incentivizing Opportunities to Lower Emissions [335]" by Resources for the Future from December 2020. (As always, feel free to read through more of the report. It provides a very comprehensive and well-sourced look at the state of hydrogen production.):
- Abstract
- Key Findings
- Introduction
- Hydrogen Supply - Read everything until Section 2.3.2 Cost and Opportunities for Reduction.
Compressed Natural Gas
In addition to its gas and liquid states, natural gas may also be compressed to be used as a fuel for vehicles. According to NGV Global [336], there were over 26 million Natural Gas Vehicles (NGVs) operating worldwide by November 2018 (the most recent date data were available for), including motorcycles, cars, vans, light and heavy-duty trucks, buses, lift trucks, locomotives, even ships and ferries. From 1996 to 2018, the number of NGVs has grown by nearly 3,000%! (850,445 vehicles in 1996 and 26,366,422 vehicles in 2018, according to NGV Global [336].) As you can see in the image below, global growth is driven by the Asia-Pacific region and to a lesser extent, Latin America.

In the United States, however, at 175,000 in 2017 the number of NGVs is small and increasing slowly. Vehicles fueled by natural gas get fewer miles on a tank of fuel and, here, refueling stations are not widely available and new CNG-fueled vehicles are limited. According to the U.S. DOE [337], the 2016 Chevrolet Impala Bi-Fuel (CNG) is the only new vehicle currently available in the U.S. However, conventional gasoline, and diesel vehicles can be retrofitted for CNG.
When biogas (produced from decomposing organic matter) is processed to purity standards, it is a renewable natural gas (RNG) that can substitute for natural gas as an alternative fuel for natural gas vehicles. In fact, according to the U.S. DOE [338], "about 60% of the gas used in Sweden's 38,500 natural gas vehicles is RNG. In Germany, 25% of the public compressed natural gas stations dispense 100% RNG. In the United States, biomethane vehicle activities are on a smaller scale."
Looking Ahead
A Mixed Bag of Climate Benefits
From a climate change perspective, natural gas has some strong positive and negative aspects. One of the primary environmental benefits of natural gas is that it emits much less CO2 per MMBTU (million BTUs) than other fossil fuel sources. Much less, in fact, as can be seen in the chart below.
| Fuel Type | Pounds of CO2 |
|---|---|
| Coal (anthracite) | 228.6 |
| Coal (bituminous) | 205.7 |
| Coal (lignite) | 215.4 |
| Coal (subbituminous) | 214.3 |
| Diesel Fuel and Heating Oil | 161.3 |
| Gasoline | 157.2 |
| Propane | 139.0 |
| Natural Gas | 117.0 |
As you can see, natural gas has the lowest carbon intensity of all fossil fuels, and emits about half as much CO2 per unit of energy as coal. Coal and natural gas are the two primary sources of electricity, and in addition to natural gas emitting less carbon dioxide on a raw energy basis, as mentioned previously combined cycle turbines are more efficient than coal-fired power plants, which decreases the carbon footprint further relative to coal in terms of pounds of CO2 per kWh generated.
The shale gas boom has been one of the drivers of the decreasing carbon intensity of the energy sector and the U.S. economy. There are five lines in the chart below, each of which indicate a relatively clear trend. Each of these lines shows a trend relative to 1990. For example, As of 2003, the GDP (the blue line at the top) increased to a factor of 1.5, which means the GDP was 50% larger in 2003 relative to 1990. (This chart is from the US EIA, and there are a number of excellent charts on the page if you are interested):
- GDP (blue line at the top): "Total value of goods and services produced over a specific time period" (From Investopedia [340], a great source of economic/financial information, by the way!).
- Energy CO2 (red line, second from top): These are the total emissions that were emitted as a result of energy use.
- Carbon intensity of energy (yellow line, third from the top): This indicates the ratio of carbon dioxide emissions to energy consumed.
- Energy intensity of the economy (green line, fourth from the top): Indicates the ratio of energy use to economic output.
- Carbon intensity of the economy (brown line, bottom): Indicates the amount of CO2 emitted per unit of economic output.

Index of key energy related emissions drivers, 1990-2014. 1990 acts as a baseline labeled 1.0
- Gross Domestic Product: increases fairly steadily with a slight dip in 2009, reaching about 1.9 in 2014
- Energy CO2: increases slightly 1990-2009, then declines to about 1.1 in 2014
- Carbon Intensity of the economy: steadily decreases to approximately .6 in 2014
- Energy Intensity of the economy: Follows the same trend as carbon intensity of the economy
- Carbon Intensity of the energy: fairly stable at 1 until 2007-2008, where it slightly decreases to .9 to 2014
The EIA attributes part of the decline in overall emissions and decreased carbon intensity of the economy and energy generation to natural gas usage. However, natural gas can have (and has had) negative climate impacts.
To Read Now
- "Natural-Gas Boom Driving Methane Leaks, Study Finds [342]" (Wall Street Journal, June 21, 2018) (.pdf file also available [343])
- For a somewhat longitudinal view of methane regulation in the U.S., first read "EPA Aims To Roll Back Limits On Methane Emissions From Oil And Gas Industry [344]" (NPR, August 29, 2019) then "Biden Signs Bill To Restore Regulations On Climate-Warming Methane Emissions [345]" (NPR, June 30, 2021).
- For a more global perspective, read "Rhodium Group Report on Global Oil & Gas Methane Emissions [346]" (Environmental Defense Fund, April 2015). You only need to read the summary on the link, but feel free to download the entire report.
The Future of Natural Gas
The following essays are from the Union of Concerned Scientists (UCS). The UCS is known as a strong proponent of renewable energy and energy efficiency, safe and clean energy supplies, and policies that address climate change. The essays appear at the same location on the same web page, but at two different points in time. The first essay was originally accessed in February 2014, and the second was last accessed in September 2017. The first essay thoughtfully draws together the vying promises and challenges of natural gas at a time when fracking was not quite as ubiquitous (the essay was written in 2010, as it turns out). The second essay was written in 2015. These positions illustrate both the promise of natural gas as a (possibly) lower-carbon "transition" fuel and, when taken together, the cautiousness with which societies should approach increased natural gas production... and give us a nice landing spot for this hard-working lesson. Enjoy.
The Future of Natural Gas
A convergence of factors is driving our society towards greater reliance on natural gas as a source of energy. An increased focus on the potential reductions in carbon emissions and air pollution from burning natural gas instead of coal or oil have made natural gas an environmentally attractive alternative to other fossil fuels. Concurrently, improved techniques for extracting unconventional sources of gas have dramatically raised estimates of the U.S.’s available gas resource.
Because energy produced from natural gas has much lower associated carbon emissions than these other fossil fuels, natural gas could act as a “bridge” fuel to a low-carbon energy future. Particularly in the electric sector, natural gas has the potential to ease our transition to renewable energy.
In the short term, renewable energy added to the grid may displace natural gas use, because natural gas power typically has the highest operating costs. In the long term, increased amounts of renewable energy are likely to encourage the use of natural gas as a complementary source of power. The integration of large amounts of renewable energy sources into the electrical generation mix will pose some challenges for the nation’s electric system because of the inherent variability of solar and wind power. Natural gas plants have the operational flexibility to vary their production rapidly, allowing them to provide reliability to the electric power system as it transitions to greater shares of renewable generation.
Natural gas is by no means a panacea for the environmental problems caused by our energy use. There is broad agreement among climate scientists that carbon reductions of about 80 percent will be needed to avert the worst effects of climate change, so simply switching to natural gas from coal and oil will not ultimately bring about the necessary reductions. In addition, the development of our newly-discovered shale gas resource will disturb areas previously untouched by oil and gas exploration and raise serious water management and quality challenges. Some researchers have also suggested that abundant shale gas resources could delay the transition to renewables by providing a cheap, plentiful alternative.[48] Given the competing uses of natural gas and the vagaries of regional supplies, increased dependence on natural gas also exposes our economy to its frequent price volatility.
Overall, the increased use of natural gas over coal and oil will produce real and substantial reductions in global warming emissions and improvements in public health. As gas use expands, the natural gas industry must also minimize the environmental effects of its extraction and production. If used wisely and efficiently, natural gas can help our economy effectively transition toward even cleaner, more sustainable sources of energy like wind, solar, geothermal, and bioenergy.
The Future of Natural Gas
Despite significant environmental concerns associated with its extraction, production, and distribution, natural gas burns more cleanly than coal and oil and therefore offers advantages in reducing emissions and improving public health. However, natural gas is a fossil fuel whose emissions do contribute to global warming, making it a far less attractive climate solution than lower- and zero-carbon alternatives such as energy efficiency [348] and renewable energy [349].
Furthermore, new research suggests that methane leakage during the extraction and distribution of natural gas may be undermining the potential to reduce global warming emissions by using natural gas in place of higher-carbon fossil fuels such as coal and oil. And new horizontal drilling and hydraulic fracturing (or "fracking") techniques that have allowed domestic gas and oil production to expand rapidly over the past decade have raised new questions about the impacts that natural gas extraction and use will have on climate change, public health and safety, land and water resources, and people. This expansion is currently outpacing our capacity to understand and manage the attendant risks.
During our nation's transition to a low-carbon energy future, natural gas can play an important but limited role in the electricity and transportation sectors [350] -if policies sufficient to minimize emissions and protect communities and public health are put in place.
Lesson 7 Assignment
Weekly Activity 7
Please review Canvas calendar for all due dates related to your Nonmarket Analysis Case Study.
Deliverables
Complete "Weekly Activity 7," located in the "Weekly Activities" folder under the Modules tab in Canvas. The activity may include a variety of question types, such as multiple choice, multiple select, ordering, matching, true/false, and "essay" (in some cases these require independent research and may be quantitative). Be sure to read each question carefully.
Unless specifically instructed otherwise, the answers to all questions come from the material presented in the course lesson. Do NOT go "googling around" to find an answer. To complete the Activity successfully, you will need to read the lesson, and all assigned readings, fully and carefully.
Each week, a few questions may involve research beyond the material presented in the course lesson. This "research" requirement will be made clear in the question instructions. Be sure to allow yourself time for this! You will be graded on the correctness and quality of your answers. Make your answers as orderly and clear as possible. Help me understand what you are thinking and include data where relevant. Remember, numbers should ALWAYS be accompanied by units of measure (not "300" but "300 kW"). You must provide ALL calculations/equations to receive full credit - try to "talk me through" how you did the analysis.
This Activity is to be done individually and is to represent YOUR OWN WORK. (See Academic Integrity and Research Ethics [52] for a full description of the College's policy related to Academic Integrity and penalties for violation.)
The Activity is not timed, but does close at 11:59 pm EST on the due date, as shown in Canvas.
If you have questions about the assignment, please post them to the "Questions about EME 444?" Discussion Forum. I am happy to provide clarification and guidance to help you understand the material and questions (really!). Of course, it is best to ask early.
Summary and Final Tasks
With this lesson, we continued our survey of energy industries based on energy sources. In this lesson, you learned about the natural gas industry--from exploration and extraction, transportation, resource estimates, demand, usage, and externalities.
You learned:
- about sources of natural gas;
- a simple explanation of seismology and its role in resource exploration;
- concepts and terminology related to on- and off-shore natural gas extraction;
- about major components of the US natural gas pipeline system;
- benefits and uses of liquefied natural gas (LNG);
- qualifiers in resource allocations and how to report on current estimates;
- to weigh the relative advantages and externalities of hydraulic fracturing;
- about methane leakage and related considerations.
Have you completed everything?
You have reached the end of Lesson 7! Double-check the list of requirements on the first page of this lesson to make sure you have completed all of the activities listed there.
8 Biomass and Hydro
Introduction
Overview of Lesson 8
With this lesson, we continue our survey of energy industries based on energy sources. In this lesson, we will review the natural gas industry--including exploration and extraction, transportation, resource estimates, demand, usage, and externalities.
What will we learn?
By the end of this lesson, you should be able to...
- describe sources of renewable energy, in the USA and worldwide;
- quantify biomass and hydropower energy sources, in the USA and worldwide;
- explain biomass conversion processes, including feedstocks and products of each;
- discuss biomass logistics and identify major operations;
- explain in detail major factors related to bioenergy economic, social, and environmental sustainability;
- present and consume electricity data using appropriate and correct units of measure;
- reflect on worldwide trends and projections for electricity generation from renewable sources;
- describe major types and components of hydropower plants;
- apply major factors related to hydropower economic, social, and environmental sustainability.
What is due for Lesson 8?
The table below provides an overview of the requirements for Lesson 8. For details, please see individual assignments.
Please refer to the Calendar in Canvas for specific time frames and due dates.
|
REQUIREMENT |
SUBMITTING YOUR WORK |
|---|---|
| Read Lesson 8 content and any additional assigned material | Not submitted. |
| Weekly Activity 8 | Yes—Complete Activity located in the Modules Tab |
Renewable Energy
Introduction
The Energy Information Administration glossary [352] defines renewable energy sources as "energy resources that are naturally replenishing but flow-limited. They are virtually inexhaustible in duration but limited in the amount of energy that is available per unit of time. Renewable energy resources include biomass, hydro, geothermal, solar, wind, ocean thermal, wave action, and tidal action."
On the other hand, the EIA, in the context of transportation fuels, defines alternative fuels [353] as fuel that is "substantially not petroleum and would yield substantial energy security benefits and substantial environmental benefits." Of the energy sources we have considered so far, coal and natural gas are non-renewable energy sources. Nuclear, though not renewable, is often considered an alternative fuel source because it does not have greenhouse gas emissions associated with fossil fuels. Natural gas is considered by the EIA as an alternative transportation fuel. Other alternative fuels include biofuels such as ethanol and biodiesel.
The most commonly used renewable energy sources are hydroelectricity, wind, biomass, solar, and geothermal. In this course, we are going to look closely at hydropower and biomass (this lesson) and wind and solar (next lesson), since they are by far the most-used sources in the world.
According to the International Energy Agency's (IEA's) 2019 "Key World Energy Statistics [354]" renewable energy accounted for around 13.8% of total primary energy supply (TPES) in 2017, down from 14.1% in 2014 and even with the13.8% in 2013 (2017 is the most recent year for which global data are available). Note that this includes "waste" which in part consists of municipal, commercial, and industrial waste (i.e., garbage) that is burned and used to generate electricity and/or heat (see the glossary for an explanation). Believe it or not, it is standard practice to consider waste incineration as renewable energy, regardless of the composition of the waste. Whether or not this is valid is a debate for another time, but for now, we'll consider it renewable since it cannot be disaggregated from biomass in the IEA data.
Primary energy refers to energy in its "original" form, in other words "before any transformation to secondary or tertiary forms of energy" (source: US EIA [355]). For example, coal is a primary energy source, but any electricity or heat it generates is not. Renewable energy sources are also primary energy sources, as are oil, nuclear, and natural gas (but again, any electricity generated from non-renewable sources is not primary energy). Total primary energy supply (TPES) refers to all primary energy used in a given geographical area.
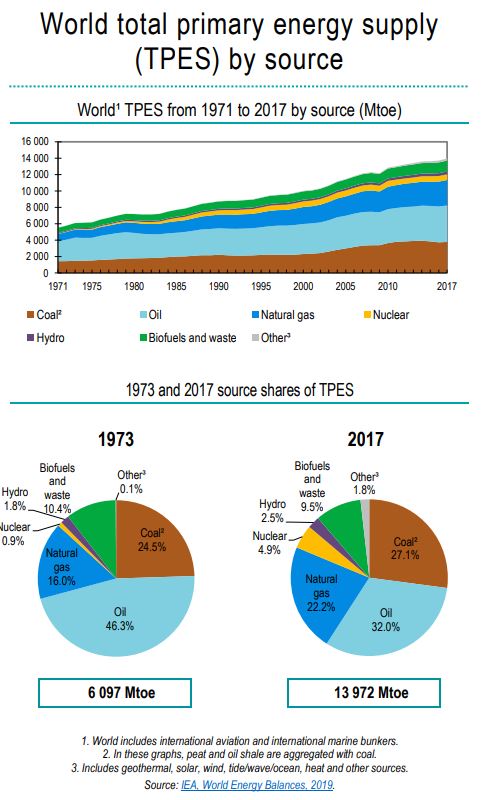
Click here to see a text description of Figure 8.1.
World total primary energy supply (TPES) by fuel
The first graph shows the World* TPES from 1973 to 2017 by fuel (Mtoe) showing that all fuel types have been rising steadily. The fuel types include coal (including peat and oil shale), oil, natural gas, nuclear, hydro, biofuels and waste, and other (including geothermal, solar, wind, tide/wave/ocean, heat and other). *The world includes international aviation and international marine bunkers.
The following table compares 1973 and 2017 energy supply by source.
| Energy Type | 1973 | 2017 (2015) |
|---|---|---|
| OIl | 46.3% | 32.0% (31.7%) |
| Coal | 24.5% | 27.1% (28.1%) |
| Natural Gas | 16.0% | 22.2% (21.6%) |
| Nuclear | 0.9% | 4.9% (4.9%) |
| Hydro | 1.8% | 2.5% (2.5%) |
| Biofuels and Waste | 10.4% | 9.5% (9.7%) |
| Other | 0.1% | 1.8% (1.5%) |
| Total Mtoe | 6097 | 13,972 (13,647) |
According to the IEA [356], about 27% of all electricity generation worldwide was from renewables in 2019 (up from around 24% in 2015), and is predicted to rise to 28% by 2021 (these are the most recent data available from IEA). Renewable energy accounted for over half of all net electric power capacity additions in 2015, which is the first time that they have accounted for more than 50%. This was led by onshore wind at 63 GW (gigawatts, or billion Watts) and solar photovoltaics at 49 GW (both of these will be addressed in the next lesson).
The IEA reported in 2021 that "renewables are expected to account for 90% of total global power capacity increases in both 2021 and 2022." 90%! That is a staggering number, and is led by wind and solar installations across the world, despite the fact that China had been opening about one coal plant per week [357] in 2020.
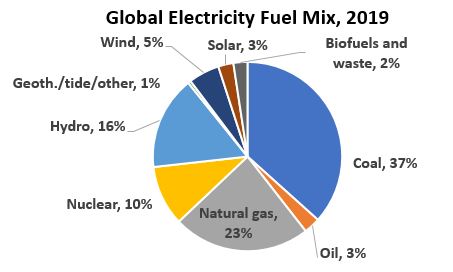
Energy and Power
Hopefully, this is a refresher at this point, but because it is so important and so easily confused, let’s be certain…
Power is the rate at which work is performed or energy is converted from one form to another. A car, for example, will have a power rating in “horsepower.” This power rating basically indicates how fast the car can convert chemical energy (from the fuel) into kinetic energy (motion). The power rating is separate from how fast or how far the car actually goes. For example, a 1967 Corvette with a 435 hp power rating will have that rating whether it is sitting in the driveway, rolling along a country road, or racing around a track. But while in operation, the engine's actual hp (the rate the energy is physically being converted) can increase and decrease.
Similarly, a light bulb has a power rating measured in watts. In this case, the light bulb is transforming electrical energy into heat and light. The higher the wattage, the higher the rate of energy transformation. And like our car engine, the power rating stays the same whether the light bulb is on or not. A 75-W bulb is always a 75-W bulb.
To understand energy, think about your power bill. You don’t get a bill for how many light bulbs you have, or how many watts they are. You get a bill for how much you use them. And when you use them, they use energy (electrical energy). The amount of electricity (energy) they use is measured in kilowatt hours (kWh). In two hours, a 150-W bulb will use 300 Wh of electricity (150 W x 2 h = 300 Wh). Since there are 1,000 Wh in a kWh, this is 0.3 kWh. A 50-W bulb will use 100 Wh in the same amount of time (0.1 kWh).
When we refer to electricity generation of power stations (including hydroelectric, wind, and solar), the systems themselves have a power rating that is in watts (or kW or MW). This is generally referred to as capacity. You can think of capacity as the maximum power output of an energy source. For example, a 1 MW (megawatt, or million watt) power plant has a peak electric power output of - you guessed it - 1 MW. If it operates at full capacity for 1 hour it would generate 1 MWh (1 MW x 1 hr) (a MWh is a megawatt-hour, which should ring a bell because SRECs are measured in MWh). If it operated at full capacity for one day it would output 24 MWh (1 MW x 24 hr).
Wind and solar energy are notoriously intermittent, but even coal and natural gas power plants have downtime. Nuclear power plants generally operate at near capacity most of the time and are viewed as one of the most reliable renewable energy sources. Hydroelectricity can be designed to operate at near full capacity, but generally, do not. The capacity factor of an energy source is determined by dividing the actual energy generation over a given period of time by the maximum possible generation over that same period (hopefully this sounds familiar, as it was the subject of a question in an earlier homework). Capacity factor generally refers to a year or an average year of generation but can refer to any amount of time. In the example above, if the 1 MW power plant output 12 MWh in one day, the capacity factor for that day would be 50% (12 MWh/24 MWh = 50%). Nuclear tends to have an average capacity factor above 90%, while hydroelectricity hovers in the 40% range. See this table from the EIA [358] for the average capacity factors of different non-fossil fuel sources of electricity in the U.S., and this table for fossil-fuel capacity factors. [359]
Generation is the amount of electricity generated (should be easy to remember!) by an energy-generating system. The amount of electricity a system generates can be measured in kWh, but can also be measured in MWh (million Wh) or GWh (billion Wh), or even TWh (trillion Wh). The amount of electricity a hydroelectric power plant will generate is basically determined by the plant's capacity and the amount of fuel (moving water), and whether or not full output is desired at the time. The amount of electricity a solar array will generate is basically determined by the solar array’s capacity and the amount of fuel (sunshine). The amount of electricity a wind turbine will generate is determined by the turbine’s capacity and the amount of fuel (wind) that is being provided at the time.
U.S. Energy Use
The image below illustrates the total energy flows in the U.S. in 2020. All the fuel sources on the left are primary energy sources, and the quantities are given in quads (a quad is one quadrillion BTUs, or 1 x 10¹⁵ BTUs). The image indicates how each energy source is used, and how much is wasted ("rejected"), mostly as heat. (You can click on the image to see a larger and resizable version.) You can view a short explanation of this chart [360] by a representative from Lawrence Livermore National Laboratory [361] (LLNL), the U.S. national lab that generates this chart every year.
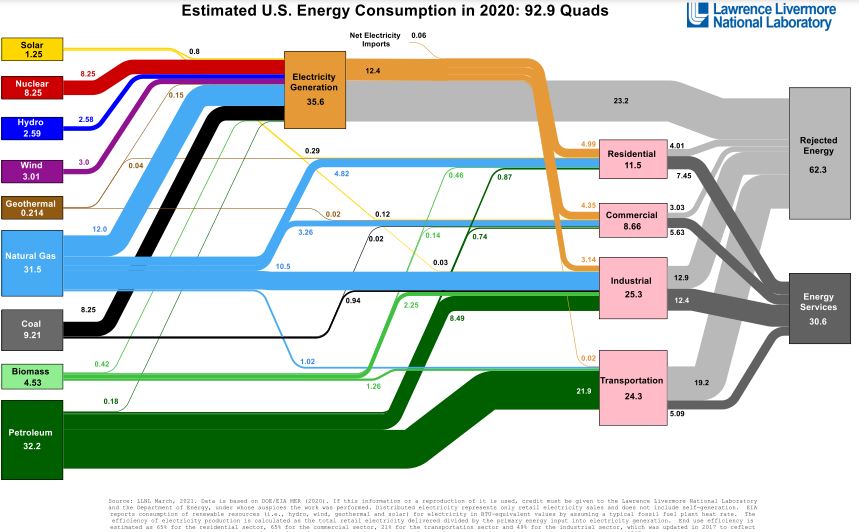
Lawrence Livermore National Laboratory also publishes an annual carbon emission flow chart (this type of "flow" chart is called a Sankey diagram). The 2018 chart (the most recent available) can be seen below. Note that the subjects of this Lesson (hydroelectric and biomass) and the next lesson (solar and wind) do not account for any of the U.S.'s carbon footprint.

Biomass
The table and chart below comes from the EIA's monthly report [363], "Short-Term Energy Outlook," September 2021. (Commonly referred to as STEO).
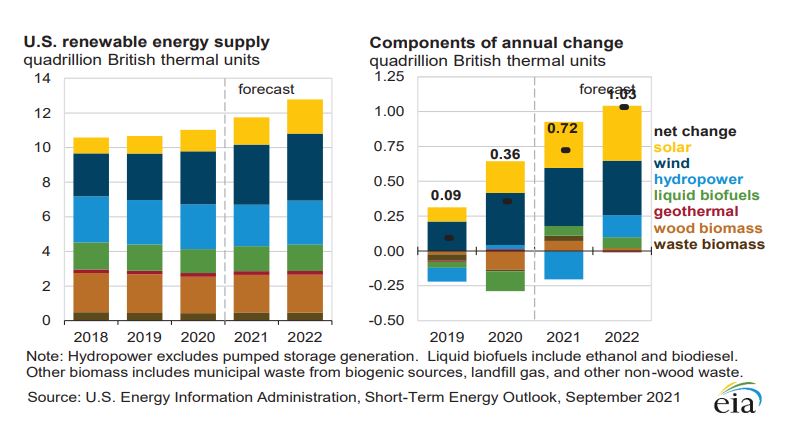
| Energy Source | 2017 | 2018 | 2019 | 2020 |
|---|---|---|---|---|
| Hydroelectric Powera | 3.640 | 7.031 | 2.492 | 2.592 |
| Geothermal | 0.300 | 0.578 | 0.209 | 0.214 |
| Solar | 1.021 | 2.170 | 1.043 | 1.246 |
| Wind | 3.197 | 6.479 | 2.729 | 3.065 |
| Wood Biomass | 3.121 | 6.109 | 2.297 | 2.101 |
| Ethanol | 1.694 | 3.284 | 1.200 | 1.045 |
| Biomass-based diesel | 0.424 | 0.777 | 0.265 | 0.275 |
| Waste Biomassb | 0.705 | 1.356 | 0.433 | 0.430 |
| Biofuel losses and co-productsc | 1.163 | 2.266 | 0.800 | 0.698 |
| Total | 15.236 | 29.990 | 11.441 | 11.657 |
Biomass clearly comes from a variety of sources, so what is biomass? In the table above, it is wood biomass, waste biomass, ethanol, biomass-based diesel ("biodiesel"), and biofuel losses and co-products. Is it me, or does it seems like other renewable sources like solar and wind get most of the press? Don't get me wrong - these are great sources, but biomass is by far the largest single source of renewable energy both in the U.S. and worldwide. Altogether, about 38% of renewable energy consumed in the USA in 2020 came from biomass sources (not included the biofuel losses and co-products). About the same amount as wind and solar combined!
What is Biomass?
Biomass is "organic nonfossil material of biological origin constituting a renewable energy source." (Source: EIA [364]). Why the word "nonfossil?" We know that fossil fuels are formed in the Earth's crust from decayed organic material. So why aren't fossil fuels considered "biomass"?
Another definition describes biomass as "derived from living, or recently living organisms." This is the trick: the difference is one of time scale. "Fossil fuels such as coal, oil, and gas are also derived from biological material, however material that absorbed CO2 from the atmosphere many millions of years ago" (Biomass Energy Centre [365]). Biomass then is a renewable energy source, as indicated by the EIA definition, and thus is "virtually inexhaustible in duration but limited in the amount of energy that is available per unit of time." Biomass differs from other renewables such as solar and wind because, in addition to being limited in availability, it is possible to use it at a much higher rate than it can be replenished. Think of a clear-cut forest or decimated cornfield.
Biomass Applications and Processes
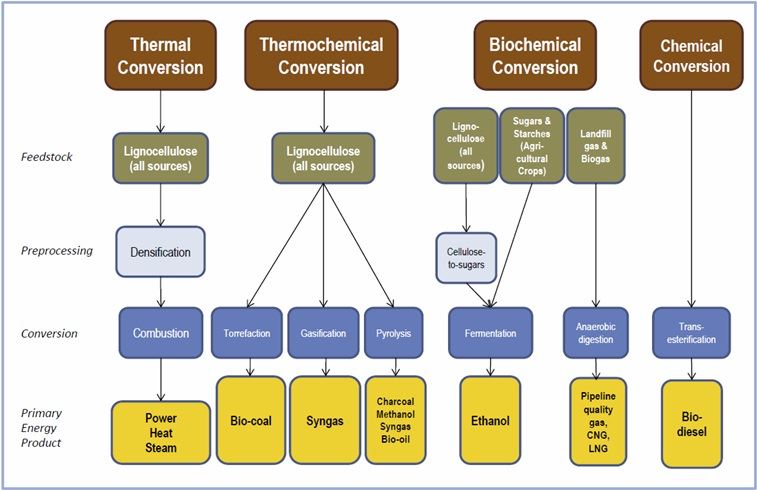
Click link to expand for a text description of Figure 8.5
Diagram examines bioenergy conversion technologies of various different energies. F stands for Feedstock. PP stands for Preprocessing, C stands for conversion and PEP stands for primary energy product.
Thermal Conversion
F: Lignocellulose (all sources)
PP: Densification
C: Combustion
PEP: Power, Heat, Steam
Chemical Conversion
F: N/A
PP: N/A
C: Transesterification
PEP: Bio-diesel
Thermochemical Conversion
F: Lignocellulose (all sources)
PP: N/A
C: Torrefaction
PEP: Bio-coal
C: Gasification
PEP: Syngas
C: Pyrolysis
PEP: Charcoal, methanol, syngas, bio-oil
Biochemical conversion
F: Lignocellulose (all sources)
PP: Cellulose to Sugars
C: Fermentation
PEP: Ethanol
F: Sugars & Starches (Agricultural Crops)
PP: N/A
C: Fermentation
PEP: Ethanol
F: Land Fill gas & Biogas
PP: N/A
C: Anaerobic Digestion
PEP: Pipeline quality gas, CNG, LNG
A feedstock is "any renewable, biological material that can be used directly as a fuel, or converted to another form of fuel or energy product." According to the Office of Energy Efficiency and Renewable Energy [367], "biomass feedstocks are the plant and algal materials used to derive fuels like ethanol, butanol, biodiesel, and other hydrocarbon fuels".
There are two basic categories of biomass material: woody & .... non-woody! "Lignocellulose" is woody biomass. (For an excellent description and discussion, see Sources of biomass [368] from the Wisconsin Grasslands Bioenergy Network. This is not required reading.)
From the Environmental and Energy Study Institute [369], here is a list of some of the most "common (and/or most promising)" biomass feedstocks--
- Grains and starch crops – Sugar cane, corn, wheat, sugar beets, industrial sweet potatoes, etc.
- Agricultural residues – Corn stover, wheat straw, rice straw, orchard prunings, etc.
- Food waste – Waste produce, food processing waste, etc.
- Forestry materials – Logging residues, forest thinnings, etc.
- Animal byproducts – Tallow, fish oil, manure, etc.
- Energy crops – Switchgrass, miscanthus, hybrid poplar, willow, algae, etc.
- Urban and suburban wastes – Municipal solid wastes (MSW), lawn wastes, wastewater treatment sludge, urban wood wastes, disaster debris, trap grease, yellow grease, waste cooking oil, etc.
Logistics
Feedstock logistics encompass all of the operations necessary to harvest the biomass and move it to the conversion reactor at the biorefinery (or the heat and/or electricity generation facility), including the processing steps necessary to ensure that the delivered feedstock meets the specifications of the biorefinery conversion process. A biorefinery is where "biomass is upgraded to one or more valuable products such as transport fuels, materials, chemicals, electricity and, as a byproduct, heat" (Source: "What is a Biorefinery? [370]" by Bernstsson, Snadén, Olsson, and Åsblad. This article provides an excellent explanation of various biorefining processes if you are so inclined!). Conventionally, facilities that generate electricity and/or heat through direct thermal conversion (combustion) are not considered biorefineries unless they first convert the biomass into a "novel" material like biogas. In the chart at the top of this page, biorefineries are used in all technologies except for thermal conversion.
Logistics includes harvest and collection, preprocessing, storage and queuing, handling and transportation, and is used in all four of the technologies in the chart above.
In its natural form, most biomass is bulky, relatively wet, and due to its low bulk-density, costly to transport. Preprocessing includes production steps, like chipping, grinding, compacting and drying, that turn biomass into what is properly called feedstock.
Biomass densification is the compression or compaction of biomass to reduce its volume per unit area. Densification is used for solid fuel applications (e.g., pellets, briquettes, logs). Drying biomass improves the grinding process, and results in smaller more uniform particles of biomass.
For cellulosic biomass, mechanical (e.g., crushing) and thermochemical (e.g., hydrolysis) pretreatments are necessary.
Many herbaceous feedstocks, for example, corn stover, are only harvested over a few weeks during the year in the U.S. Corn Belt. To maintain a continuous supply of this feedstock to biorefineries, storage is required. Biological degradation can reduce the amount of biomass available for bioenergy production and also impact the conversion yield, by altering biomass chemical composition.
Unprocessed biomass leaving the field or forest is often bulky, aerobically unstable, and has poor flowability and handling characteristics. These traits can make raw biomass handling and transportation inefficient. Transport can be expensive, especially as distance increases.
The video below from the U.S. Department of Energy may help you visualize some of the processes involved with harvesting and using various feedstocks. Please watch the following (3:39) video:
PRESENTER: Nearly a billion dollars a day-- that's how much we spend on oil imports in the US. Oil that powers our nation's transportation systems and industries.
But here's something to think about-- a strong biofuels industry could meet much of our demand. Biofuels are made from organic materials, or biomass, grown in our own fields and forests. A booming biofuels industry would also keep a lot of the money we spend on imported oil in the country-- plus it would reduce our dependence on foreign oil, and create jobs in rural America.
In fact, we can use homegrown biomass to replace or supplement almost every product that comes from a typical barrel of crude oil. These are things like gasoline, diesel, jet fuel, and other consumer products, like plastics. Much of our imported oil could be replaced with sustainable, renewable biofuels and products made in the USA.
Check this out. This is the Billion-Ton Update Study by the US Department of Energy. This study found that potential biomass resources could produce about 85 billion gallons of biofuels a year-- that's about a third of the oil we use.
OK, so what kinds of plant materials or feedstocks can be converted to fuels? And, where will they come from? America is already using biomass that comes from agriculture and forest operations across the country. These are non-food plants grown specifically for energy. American farms all across the US can produce a wide variety of energy crops. These are plants that are grown because of their high energy content-- crops like switchgrass or fast-growing hybrid poplar trees.
And energy crops can also be grown on marginal, degraded, or underused agricultural land, helping farms expand and become more productive. Agricultural waste can even be converted into biofuels.
Look at this-- farmers can gather and sell corn stalks and wheat straw to be converted to biofuels, making their lands even more profitable. This is non-edible plant material left over from crop harvests that's been collected from farm land instead of going to waste.
So, how do you take plants and make them into fuels and other products? No matter what kind of plant you start with, the first steps are to break them down. The US Department of Energy, partnering with private industry, is making these steps a lot more efficient and affordable. Together, they're developing new machinery and processes specific to the various biomass crops.
This equipment is harvesting, baling, grinding, and condensing these raw plants into energy-ready materials-- materials like these energy dense pellets, ready for the biorefinery. From there, energy-ready biomass feedstocks are transported to one of many biorefineries sprouting up in communities across the country. Here, they can be further broken down, converted into biofuels, and made ready for use.
Homegrown biomass feedstocks-- creating jobs in rural America, generating clean renewable fuels, and reducing our dependence on foreign oil.
Conversion
The figure at the top of this page shows four categories of biomass processing: thermal, thermochemical, biochemical, and chemical. This is a very helpful starting place for understanding the different inputs and outputs associated with biomass.
To Read Now
Visit the the Wisconsin Grasslands Bioenergy Network and read closely, Bioenergy Conversion Technologies [372].
Biomass and Sustainability
Benefits of Energy from Biomass Resources
The Natural Resources Defense Council [373] lists (below) the "Advantages of Biomass Energy":
- Farmers and foresters already produce a great deal of residue. While much of it is needed to protect habitat, soil, and nutrient cycles, tens of millions of tons and more could be safely collected with the right management practices. Every year in the United States, roughly 39 million tons of crop residues go unused.
- Unlike coal, biomass produces no harmful sulfur or mercury emissions and has significantly less nitrogen -- which means less acid rain, smog, and other toxic air pollutants.
- Over time, if dedicated biomass is sustainably managed, converting it to energy can result in low or no net carbon emissions, provided that the carbon released is rapidly absorbed back from the atmosphere by biomass re-growth.
- Using biofuels in our cars and airplanes can potentially produce less global warming pollution than petroleum-based fuels, and allows us to invest our energy dollars at home rather than in foreign oil.
- Switchgrass, a promising source of biofuels, is a native, perennial prairie grass that is easier to grow responsibly than most row crops. If planted in such a way that it does not replace native habitat or take land out of food production, switchgrass and other sustainably managed energy crops have the potential to reduce erosion and nitrogen runoff, and increase soil carbon faster when mowed than when standing.
- Many ethanol refineries are owned by farmer-cooperatives, which help preserve the economic vitality of rural communities.
Bioenergy Sustainability
In 2005, the United Nations adopted the World Summit Outcome, including a commitment "to promote the integration of the three components of sustainable development – economic development, social development and environmental protection – as interdependent and mutually reinforcing pillars." (Resolution Adopted by General Assembly [374], page 11)
In 2013, the Food and Agriculture Organization of the United Nations issued "Biofuels and the sustainability challenge: A global assessment of sustainability issues, trends, and policies for biofuels and related feedstocks." This report examines the assessment of bioenergy different factors governing the sustainability of biomass production for biofuels, and is the most comprehensive assessment of the sustainability implications of biofuels that I have seen with a global perspective. The authors identify “tests” relevant to these pillars:
- Economic sustainability. This test assesses when production makes sense from an economic point of view; which stable competitive conditions would induce producers to opt for biofuels production; what impacts increased production may have on competing uses for the feedstock (primarily food and feed); and to what extent biofuels can be a reliable substitute for fossil fuels.
- Environmental sustainability. This test addresses criteria “such as GHG emissions, soil stress and its ability to maintain productive capacity, available water resources, air, and water pollution and biodiversity.”
- Social sustainability. This test includes considerations of rural development, gender mainstreaming [375], community involvement, inclusiveness of small farmers in the production processes, labor, and land rights.
These pillars are essentially the same as what is often referred to in the literature as the "3 E's" of sustainability: economics, environment, and (social) equity.
To Read Now
Download and open "Biofuels and the sustainability challenge: A global assessment of sustainability issues, trends and policies for biofuels and related feedstocks [376]" from the Food and Agriculture Organization of the United Nations.
Read Section 2.1 Definition of sustainable development (starting on page 67).
Take a few minutes to become familiar with the overall document (review table of contents). You will be using all of Chapter 2 to answer questions in this lesson's assignment.
Not required, but if you have time and are interested, review case studies in Boxes 2.3, 2.4, and 2.5. Very interesting, just a little too "in the weeds" for this lesson. (Okay, I thought that was funny.)
Renewable Energy for Electricity
About Renewable Energy Sources
Biomass, the subject of the first part of this lesson, is a widely used renewable energy source. As you learned earlier in the lesson, it constitutes nearly 10% of global TPES according to the IEA's 2019 Key World Energy Statistics [354] and a little under 5% of U.S. TPES, according to Lawrence Livermore National Laboratory. As we have learned, it is processed in many different ways to produce a wide range of outputs for many kinds of applications, including heat for cooking, space heating and warming water; heat for industrial purposes; heat for electricity production; syngas; ethanol and biodiesel for transportation, and even methane for natural gas applications.
Other widely used renewable energy sources--hydro, wind and solar--are used almost exclusively for electricity generation. Energy from the sun is also used in solar hot water applications and other solar heating applications, including passive solar. But, its most common application is for electricity generation.
For the remainder of this lesson, and the following lesson, we will be considering renewable energy sources used to generate electricity: hydropower, then wind and solar (in the next lesson).
Renewable Energy for Electricity Generation
In their most recent International Energy Outlook (2021) [377] with global electricity projections, the EIA reports that renewable energy is the fastest-growing source of electricity generation (not just capacity!) in the IEO2021 Reference case through 2050 (see Figure 8.6). They report that:
Globally, incremental electricity generation comes largely from renewable resources, beginning in 2025. As renewables—particularly solar and wind—become cost-competitive, the IEO2021 Reference case projects that all post-2020 electricity generation growth in OECD regions will come from those sources and that they will displace an increasing share of existing non-renewable, mostly fossil fuel-based, sources. In non-OECD regions, we project that electricity generation from renewable sources account for about 90% of generation increases from 2020 to 2050. Because electricity generation grows at almost twice the rate in non-OECD regions than in OECD regions in the Reference case, the non-OECD regions add over two times the generation from renewable sources compared with the OECD regions.This projected growth in renewables is uncertain and may largely depend on changes to regulatory policies and market rules, large and cost-effective supply chains to support renewable installations, and a sufficient amount of conventional generation technologies or storage to back intermittent renewable capacity.
Renewable electricity generation grew in 2020 despite the Covid-based economic downturn. In their Global Energy Review 2021 [378], the IEA noted the following:
Renewable energy use increased 3% in 2020 as demand for all other fuels declined. The primary driver was an almost 7% growth in electricity generation from renewable sources. Long-term contracts, priority access to the grid, and continuous installation of new plants underpinned renewables growth despite lower electricity demand, supply chain challenges, and construction delays in many parts of the world. Accordingly, the share of renewables in global electricity generation jumped to 29% in 2020, up from 27% in 2019. Bioenergy use in industry grew 3%, but was largely offset by a decline in biofuels as lower oil demand also reduced the use of blended biofuels.
Renewable electricity generation in 2021 is set to expand by more than 8% to reach 8 300 TWh, the fastest year-on-year growth since the 1970s. Solar PV and wind are set to contribute two-thirds of renewables growth. China alone should account for almost half of the global increase in renewable electricity in 2021, followed by the United States, the European Union and India.

Click link to expand for a text description of Figure 8.6
| Fuel Type | 2020 | 2025 | 2030 | 2035 | 2040 | 2050 |
|---|---|---|---|---|---|---|
| other | 1.1 | 1.1 | 1 | 1 | 1 | 1.1 |
| Nuclear | 2.5 | 2.6 | 3 | 3.1 | 3.2 | 3.1 |
| Natural Gas | 6.5 | 7 | 7.2 | 72 | 7.1 | 7.2 |
| Coal | 8.1 | 7.7 | 7 | 7.8 | 7.9 | 8 |
| wind | 1.9 | 3 | 3.2 | 4.2 | 5.1 | 6.8 |
| solar | 0.9 | 1.95 | 3.2 | 5.1 | 6 | 10.1 |
To Read Now
- Read "Renewable Energy Market Update 2021 [380]" from the IEA.
- Read from the beginning through "Forecast additions for 2021 and 2022 have been revised upwards by over 25% from last year" in "Renewable Energy Market Update 2021: Renewable electricity [381]" from IEA.
- (OPTIONAL) the Electricity [382]section of the IEA's Global Energy & CO2 Status Report [383].
Optional Reading
- The Electricity [382]section of the IEA's Global Energy & CO2 Status Report [383].
Hydropower Technology
In 2020, about 28% of the world's electricity was generated from renewable energy sources. Of that, about 57% came from hydropower (down from 77% in 2012). Between 2020 and 2050, the Energy Information Administration (in the IEO2021 Reference case [384]) projects that hydropower generation will increase 1.1% per year, while renewable electricity is expected to grow by over 4% per year. Because of this, the EIA projects that hydropower will drop to just over 29% of the total renewable energy generation in 2040 and 23% of the total renewable energy generation in 2050. (Just a few years ago, they projected over 50% in 2040. They did not expect solar and wind to grow as rapidly as they have.) This drop in total percentage is very apparent in the chart below. (Note that the chart below uses the same data as the chart on the previous page, but is expressed as a percentage instead of total generation.)
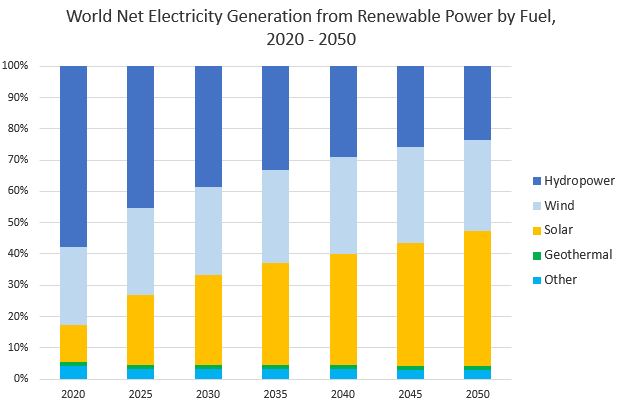
Click link to expand for a text description of Figure 8.8
| Fuel Type | 2020 | 2025 | 2030 | 2035 | 2040 | 2050 |
|---|---|---|---|---|---|---|
| Other | 291.3 | 332.8 | 399.7 | 488.7 | 556.7 | 689.5 |
| Geothermal | 09.1 | 129.3 | 188.4 | 214.0 | 238.6 | 253.9 |
| solar | 831.9 | 2274.8 | 3655.6 | 4948.8 | 6391.4 | 10152 |
| Wind | 1741.4 | 2814.2 | 3583.5 | 4532.7 | 5525.6 | 6833.5 |
| Hydropower | 4034.3 | 4619.6 | 4921.4 | 5065.2 | 5337.0 | 5548 |
In their "2020 Hydropower Status Report [385]" (an outstanding resource for international hydropower trends!) the International Hydropower Association (IHA) reports that 15.6 GW of new hydropower capacity was installed in 2019 (down from 21.9 GW in 2017 and 33.7 in 2015). At the end of 2019, worldwide hydropower capacity was about 1,308 GW (up from 1,036 GW in 2014). Total generation was a record 4,306 TWh, which was "the single greatest contribution from a renewable energy source in history", which IHA states avoided "an estimated 80 - 100 million metric tonnes of carbon emissions." Brazil led all other countries in increased capacity, with over 4.91 GW of growth in 2019, followed closely by China at 4.17 GW of additional capacity.
Types of Hydropower Plants
There are three general types of hydropower stations:
Run of River (or Diversion), electricity is generated through the flow of a river.
Reservoir (or Impoundment), flowing water is stored in a reservoir where the release of the water to generate electricity can be controlled.
Pumped Storage, where water is pumped from a lower reservoir to a higher reservoir, so that it can be released to generate electricity when needed.
To Read Now
- Visit the Office of Energy Efficiency and Renewable Energy (EERE) and read "Types of Hydropower Plants [386]"
Also read the following to get a sense of how hydropower works, particularly in impoundment systems:
- From the U.S. Geological Survey, read "The flow of water produces hydroelectricity [387]" and "Hydroelectric Power: How it Works [388]"
- From the Tennessee Valley Authority, read "How Hydroelectric Power Works [389]" and watch the embedded video.
After reading through the information on the link above, please watch the following (3:50) video from the U.S. Department of Energy.
To Read Now
Visit the Foundation for Water & Energy Education.
Take the Walk Through a Hydro Project [391] tour, click through all 10 steps.
Optional
Take the Fish Passage [392] tour, click through all 5 features (Spillways, Turbines, Juvenile Fish Transportation, Bypass Systems, Fish Ladders).
To Read Now
Read an article from Yale 360 [393] that illustrates how pumped storage can be integrated with other renewable energy sources.
A fourth emerging type of hydropower is marine and hydrokinetic, where electricity is generated from the energy of waves, tides, ocean, and river currents. Data are hard to come by, but in their 2013 Hydropower Report [394] the International Hydropower Association estimates global installed tidal and ocean capacity was about 515 MW at the of 2012, with roughly an additional 3,000 MW of "pipeline capacity" (planned).
Global Hydropower and Sustainability
Global Trends
In the 2019 International Energy Outlook [274], the Energy Information Administration projects that most new hydroelectric development will take place in non-OECD countries. In their 2016 Hydropower Report [396], the International Hydropower Association identified the following key trends and developments driving this growth:
- New international policy and agreements
- Advanced hydropower control technologies enabling renewable hybrids
- Climate aspects
- The value of pumped storage being recognized worldwide
- New financial instruments
- Climate bonds attracting strong interest
- Mergers and acquisitions pointing to a larger role for the private sector
- The China sector going global
- Transformative projects in Africa
- Hydropower driving regional connection
To Read Now
The International Hydropower Association is an excellent resource for hydropower information. Keep in mind that they are an industry organization, so they promote the interests of the industry and tend to shall we say "look at the bright side" of hydropower. That stated, they are a good source of data, especially on the status of hydropower across the world.
- Read pp. 7 - 9 of their "2021 Hydropower Status Report [397]." (Feel free to browse the rest.)
Hydropower and Sustainability
The World Bank supports the "responsible development of hydropower projects of all sizes and types—run of the river, pumped storage, and reservoir—including off-grid projects meeting decentralized rural needs." In a world where more than a billion people lack access to electricity, and the quality of life it provides, hydropower has great promise, if done responsibly. However, as the World Bank points out in their Overview [398]of hydropower: "While hydropower development offers great opportunities, it also comes with complex challenges and risks that vary significantly by the type, place, and scale of projects. Factors such as resettlement of communities, flooding of large areas of land, and significant changes to river ecosystems must be carefully considered and mitigated." All of these problems have arisen to varying degrees in projects across the world, so hydropwer should be deployed carefully if sustainability is one of the goals of the project.
In 2010, an international Hydropower Sustainability Assessment Protocol was launched. According to the Hydropower Sustainability Assessment Protocol [400]: "The Protocol was developed through 30 months (2008–10) of cross-sector engagement, including a review of the World Commission on Dams Recommendations, the World Bank Safe Guard Policies and the IFC Performance Standards. During this period, a multi-stakeholder forum jointly reviewed, enhanced, and built consensus on what a sustainable project should look like." This protocol involved "representatives of environmental NGOs (WWF, The Nature Conservancy), social NGOs (Oxfam, Transparency International), development banks, governments (China, Zambia, Iceland, Norway), and the hydropower sector."
The Hydropower Sustainability Assessment Protocol addresses the three pillars of sustainability for hydropower: environmental, social, and economic. Environmental issues include those arising from hydropower construction and operation related to broad areas of water quality, sedimentation, and habitat. While hydropower has the potential to reduce poverty and improve quality of life, it can also be the cause of population displacement and other negative social impacts on local and indigenous communities. Hydropower can be a tool of economic development with many benefits for local communities, if (big IF), economic benefits are distributed equitably between "the government, the project proponents, and stakeholders who receive the electricity services and the local communities who bear the impacts of a development."
To Read Now
- Visit the Hydropower Sustainability Assessment Protocol, [401] and browse the Home page and the overview page [402]. You'll use info in the ESG Gap Analysis Tool [403] page as part of this lesson's assignment.
For an excellent discussion of river-related environmental factors, review the following.
- From the Foundation for Water & Energy Education, read "Changes to the Ecosystem [404]"
Optional Reading
- "Changing Habitat Conditions for Fish and Wildlife [405]" from the same document.
Lesson 8 Assignment
Weekly Activity 8
Deliverables
Complete "Weekly Activity 8," located in the "Weekly Activities" folder under the Modules tab. The activity may include a variety of question types, such as multiple choice, multiple select, ordering, matching, true/false, and "essay" (in some cases these require independent research and may be quantitative). Be sure to read each question carefully.
Unless specifically instructed otherwise, the answers to all questions come from the material presented in the course lesson. Do NOT go "googling around" to find an answer. To complete the Activity successfully, you will need to read the lesson, and all assigned readings, fully and carefully.
Each week, a few questions may involve research beyond the material presented in the course lesson. This "research" requirement will be made clear in the question instructions. Be sure to allow yourself time for this! You will be graded on the correctness and quality of your answers. Make your answers as orderly and clear as possible. Help me understand what you are thinking and include data where relevant. Remember, numbers should ALWAYS be accompanied by units of measure (not "300" but "300 kW"). You must provide ALL calculations/equations to receive full credit - try to "talk me through" how you did the analysis.
This Activity is to be done individually and is to represent YOUR OWN WORK. (See Academic Integrity and Research Ethics [52] for a full description of the College's policy related to Academic Integrity and penalties for violation.)
The Activity is not timed, but does close at 11:59 pm EST on the due date.
If you have questions about the assignment, please post them to the "Questions about EME 444?" Discussion Forum. I am happy to provide clarification and guidance to help you understand the material and questions (really!). Of course, it is best to ask early.
Summary and Final Tasks
With this lesson, we continued our survey of energy industries based on energy sources. In this lesson, you learned about the natural gas industry--from exploration and extraction, transportation, resource estimates, demand, usage, and externalities.
You learned:
- about sources of renewable energy, in the USA and worldwide;
- to quantify biomass and hydropower energy sources, in the USA and worldwide;
- to explain biomass conversion processes, including feedstocks and products of each;
- about biomass logistics and identify major operations;
- details about major factors related to bioenergy economic, social, and environmental sustainability;
- appropriate and correct units of measure to use with electricity data;
- about worldwide trends and projections for electricity generation from renewable sources;
- the major types and components of hydropower plants;
- to apply major factors related to hydropower economic, social, and environmental sustainability.
Have you completed everything?
You have reached the end of Lesson 8! Double-check the list of requirements on the first page of this lesson to make sure you have completed all the activities listed there.
9 Wind and Solar
Introduction
Overview of Lesson 9
With this lesson, we continue our survey of energy industries based on energy sources. In this lesson, we will review two renewable energy sources, wind and solar.
What will we learn?
By the end of this lesson, you should be able to...
- quantify current and projected worldwide use of renewable energy;
- use units of measure for power and energy correctly and consistently;
- understand distributed generation and associated concepts, including on- and off-grid and net metering;
- explain commonly used incentive structures for renewable energy, including tax credits, rebates, and performance-based incentives (Renewable Portfolio Standards and Feed-In Tariffs);
- describe wind-energy technology, resources, and issues affecting growth of the industry;
- explain three categories of solar-energy systems: passive, thermal, and electric-generating;
- list components of photovoltaic systems and describe the purpose of each;
- explain features of four types of concentrating solar power systems;
- discuss status of and advances in the use of solar for electricity generation.
What is due for Lesson 9?
The table below provides an overview of the requirements for Lesson 9. For details, please see individual assignments.
Please refer to the Calendar in Canvas for specific time frames and due dates.
|
REQUIREMENT |
SUBMITTING YOUR WORK |
|---|---|
| Read Lesson 9 content and any additional assigned material | Not submitted. |
| Weekly Activity 9 | Yes—Complete Activity located in the Modules Tab . |
Policy Basics
The technology and economics of wind and solar make it practical to install and use them over a wide range of scales--from single-household residential installations a kW or less in size to multi-MW power plants. In particular, the ability for electricity consumers to generate some or all of their own electricity invites new circumstances, needs, and opportunities for policy.
On- and Off-Grid
Both solar and wind can be used in situations with or without access to electricity from a utility company. When solar or wind is used to generate electricity at a site that is not connected to a local electricity transmission and distribution system, the installation is off-grid (also often referred to as a standalone system). An installation may be off-grid because it is in an area where there is no electricity infrastructure - typically remote areas - or because the wind or solar system is generating enough electricity to support the site, and electricity from the grid is not necessary. More often than not, it is due to the lack of local electricity infrastructure. Because wind and solar are intermittent energy sources - the wind doesn’t always blow and the sun doesn’t always shine - off-grid systems are almost always designed with on-site electricity storage, usually batteries and called "battery backup." Off-grid systems constitute a very small portion of total installed capacity worldwide (remember that capacity refers to the rated output of an energy-generating system, as opposed to generation, which refers to the energy output). In the U.S. the most frequent use of off-grid systems is for small-scale solar applications such as road signs and weather stations.
Solar and wind systems are most often installed at sites that do have access to electricity from the grid. These sites have a meter and are connected to local power lines from the utility company. These installations are on-grid and often called grid tied. (These systems may also have battery-backup, to provide power during times of grid outages.)
When a grid-tied electricity consumer generates some or all of its own electricity that it uses on site, it is called a behind-the-meter (BTM) installation. If you were to put a photovoltaic system on the roof of your home or small business, for example, and used some of it on-site you would have a BTM installation. And when you both buy electricity from others (through the grid) and generate some of your own electricity, you are sometimes referred to as a customer generator.
When wind or solar is used on the scale of a power plant where the electricity being generated is sold to other electricity consumers, the installation is a commercial generator (a power plant), in the same way that other power plants are, like the coal, nuclear, and gas generators we considered earlier.
Net Metering
In BTM generation, the site will use electricity it generates (from the wind or solar) and, when more is needed, draw additional electricity from the grid. If the site is generating more electricity than it is using, the excess electricity is sent out to the grid. This can vary from hour-to-hour and minute-to-minute as electricity demand from the customer and supply from the solar array fluctuates. Customers pay for the electricity they get from the grid and may get credit for the electricity they send to the grid. This credit may then be used to offset future electricity use. For example, a customer generator may generate more electricity than they use in the summer time which gives them “money in the bank” (kWh in the bank, really) with the utility company. In the winter, when the customer generator needs more electricity than it can generate, electricity is pulled from the grid and the credit is used. When the credit is used up, the customer once again buys electricity from the grid. This may also happen on a daily basis if a customer generates excess energy during some daytime hours and needs to purchase energy at other times. When the utility gives the customer credit for all energy the customer sends to the grid, it is called net metering. Net metering exists in most, but not all, states in the USA, but the details vary widely.
Net metering gives the customer generator the opportunity to avoid electricity costs beyond what they have without it. The customer only pays for the “net” amount of electricity that is purchased, which means that the utility in effect pays customers for the electricity they generate and feed into the grid. Many states require utilities to pay "retail" rate for this electricity, which means they pay the same rate the customer pays to the utility. See the image below for an indication of which states have net metering policies. This map was taken from the Database of State Incentives for Renewables & Efficiency (DSIRE [33]), which is unequivocally the best source to consult if you want to find which energy incentives are available nationally or in any U.S. state. Click on the map for a larger, resizable image.
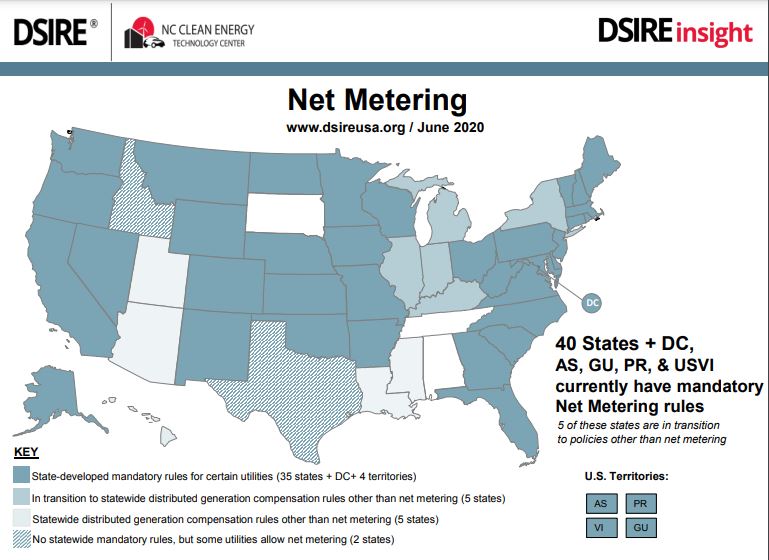 [406]
[406]To Read Now
Net metering policies have become quite controversial in the past few years. For a good summary of this and some other issues related to subsidies, read "The Solar Net Metering Controversy: Who Pays for Energy Subsidies? [409]" by Forbes Magazine. Note that this is from a few years ago, but the same issues are being debated today.Incentives
Both wind and solar require substantial initial capital outlay relative to the long run operating cost. These systems have no fuel costs. Once built, the operating costs are generally low. Solar photovoltaics (PV, aka solar panels), in particular, have a low operating cost. In addition to components having long rated lives (solar panels are usually warrantied for at least 25 years), there are no moving parts (except in cases where mechanical trackers are used). Under normal conditions, wind turbines will last at least 25 - 30 years, though they require more maintenance than solar PV.
States and countries have implemented a variety of policies meant to incentivize or encourage private investment in clean, renewable energies. The most common of these policies are tax credits, grants/rebates, and performance-based incentives (PBI), including feed-in tariffs (FIT) and renewable portfolio standards (RPS).
A tax credit is just that, a credit. When an individual or business investor earns a tax credit, it means that the amount of the credit will be subtracted from a future tax bill. For example, in the United States, we have a Federal Residential Renewable Energy Tax Credit [410] available to the residential (not commercial or industrial) sector which provides a tax credit covering 26% of the cost of an installation (for 2020 and 2021). It will go to 30% for installations in 2022 through 2032. You can read more about that here [411]. For example, in the past, if you put a photovoltaic system in your yard at a cost of $30,000, you would earn a $7,800 tax credit. The government doesn’t mail you a check for this amount. It means you get to deduct that amount from your next tax payment. To realize this money, you will need to have paid at least $7,800 in taxes, but excess credits can "generally" be carried over to future tax years. Note that even if you were owed a refund, this tax credit can be used to increase your refund, as long as you paid at least $7,800 in federal income tax throughout the year.
A rebate means that a government agency or other group (sometimes utility companies) will refund some of the investment. Pennsylvania used to provide a solar rebate program that provided rebates to investors based on the power rating of the system, $1.75/Watt, for example. The rebate was a check mailed directly to the investor (or their designate). Many states still have such programs such this solar PV rebate program in Oregon [412] (description from DSIRE of course!). Different states often have different program specifics. See DSIRE for more examples of programs. Specifics vary within states as well. The program in Oregon, for example, has different rebate levels for different utilities and for different sectors (residential, agricultural, industrial, non-profit, government).
Performance-based incentives (PBIs), also known as production incentives, provide cash payments based on the actual output of the system. For wind and solar electric, this is the number of kilowatt-hours (kWh) generated.
The case study for this course illustrates in detail how a renewable portfolio standard (RPS) policy works. To summarize, an RPS requires utilities to use renewable energy or renewable energy credits (RECs) to account for a certain percentage of their retail electricity sales. A REC is earned by a qualified grid-tied facility for every 1,000 kWh (i.e., 1 MWh) of electricity that is generated using a renewable energy resource. The RECs are then bought and sold through a market. The settlement price varies depending on REC supply and demand at any point in time, though special auctions with guaranteed pricing and incentives are sometimes used.
Another type of production-based incentive, a feed-in-tariff (FIT) pays grid-tied renewable energy generators a specified price for the electricity they generate and guarantees them this price for a specified amount of time. This type of policy is widely used in Europe, most notably in Germany, but less so in the USA. This may be changing.
Balance Please
Renewables are not the only energy source receiving government subsidies to keep costs down and encourage consumption. The International Energy Agency (IEA) provides this global assessment in this December 2017 commentary [413]: [414]
"Getting energy prices right is critical for sound policymaking. But because of government energy subsidies prices that consumers pay in many countries are often well below their real market value, let alone the price that would reflect energy’s full environmental and social cost.
The estimated value of global fossil-fuel consumption subsidies decreased by 15% to $260 billion in 2016, the lowest level since the International Energy Agency started tracking these subsidies in the World Energy Outlook (WEO) ten years ago. Analysis in the new WEO-2017 showed that for the first time the largest share of global subsidies that benefit fossil fuel consumption went to keep electricity prices artificially low (41% of the global total), ahead of oil (40%) and natural gas.
But while the figure for fossil-fuel consumption subsidies may be coming down, it remains much higher than estimated government support to renewable energy: subsidies for renewables in power generation amounted to $140 billion in 2016.
There can be good reasons for governments to make energy more affordable, particularly for the poorest and most vulnerable groups. But many subsidies are poorly targeted, disproportionally benefiting wealthier segments of the population that use much more of the subsidised fuel. In practice, the effect of most subsidies is to encourage consumers to waste energy, putting added pressure on energy systems and the environment, and often straining government budgets.
Such subsidies are a roadblock on the way to a cleaner and more efficient energy future; that is why the IEA continues to be a strong supporter of international efforts to get them removed and why the WEO has consistently been shining a spotlight on this issue."
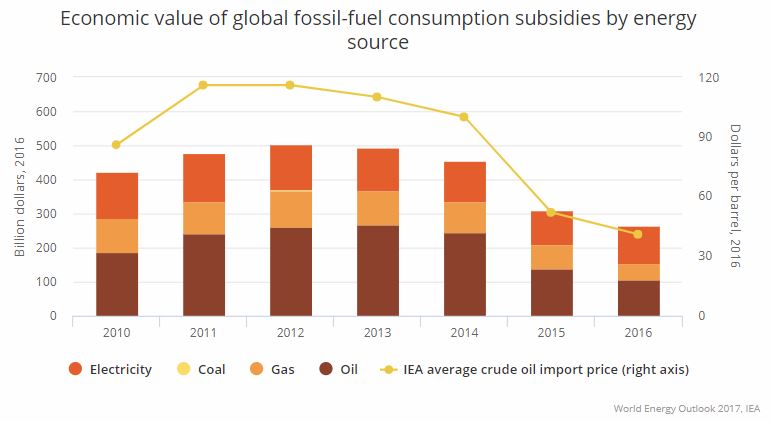
Text version of the fossil fuel subsidies chart
The chart illustrates the total global fossil fuel subsidies each year from 2010 through 2016, broken down by energy source.
| year | electricity subsidy | coal subsidy | gas subsidy | oil subsidy | crude oil price |
| 2010 | $134b | $2b | $99b | $187b | $86/bbl |
| 2011 | $139b | $3b | $92b | $242b | $116/bbl |
| 2012 | $134b | $3b | $107b | $260b | $116/bbl |
| 2013 | $125b | <$1b | $100b | $267b | $110/bbl |
| 2014 | $118b | $1b | $91b | $245b | $100/bbl |
| 2015 | $99b | <$1b | $70b | $139b | $52/bbl |
| 2016 | $107b | $2b | $49b | $105b | $41/bbl |
In their 2016 World Energy Outlook report the IEA addresses market distortion and their projection of the continued need for subsidies. (The New Policies Scenario is the IEA's baseline scenario, and assumes that countries will comply with policy commitments and plans. There is also a description of other IEA scenarios) [415]
"In the case of subsidies to renewables (examined in detail in Chapter 11), these continue to be necessary to incentivize investment in renewables over fossil-fuel alternatives, for as long as markets fail to reflect the environmental and health costs associated with the emissions of CO2 and other pollutants. But as technology costs come down and electricity and CO2 prices increase in several markets, more and more new renewable energy projects become economically competitive without any state support: in India, solar PV is competitive without subsidies well before 2030; for the world as a whole, most new renewables-based generation in 2040 does not require subsidies. The value of the subsidies paid to all forms of renewable energy peaks at $240 billion in 2030 in the New Policies Scenario and then falls back to $200 billion by 2040, remaining well below the today’s value for fossil-fuel consumption subsidies. The subsidy per unit of renewables-based electricity generation falls dramatically: subsidies to renewable-based generation rise by some 30% over the period to 2040, yet the electricity generated by non-hydro renewables increases by a factor of five over the same period."
International Energy Agency, World Energy Outlook 2016, p. 100.
It is difficult to put an objective number on the amount and distribution of energy subsidies in the United States, due to the complexity of the inner workings of our tax code. As one Forbes article [416] put it, "Just how taxpayer money gets doled out is mired in so much intricacy that is difficult to follow." (And that's from Forbes, "among the most trusted resources for the world's business and investment leaders!")
One can easily find news from credible sources saying that both in the United States and globally, fossil-fuels are subsidized more than renewables, and vice versa, depending on how you scope which subsidies and tax breaks to include and how you measure the amount (total $ or total $/BTU produced, for example). Regardless of the relative subsidy, a strong case can be made for reducing fossil-fuel subsidies, especially with regard to climate change. For example, in 2015, a coalition of eight governments (Costa Rica, Denmark, Ethiopia, Finland, New Zealand, Norway, Sweden, and Switzerland) calling themselves the Friends of Fossil Fuel Subsidy Reform submitted a communiqué "encouraging governments to prioritize the reform of fossil fuel subsidies," mostly in an effort to influence the recent Paris Climate Talks.
To Read Now
Via the International Institute for Sustainable Development [417], read "Fossil Fuel Subsidy Reform Communiqué [418]".
As technology and economies of scale improves, the cost of renewables has gone down significantly, to the point that some properly sited renewables are cost competitive with fossil fuel and other "conventional" sources.
- Browse through "Lazard's Levelized Cost of Energy Analysis [419]" from Lazard, in particular pp. 1 - 3 and p. 7. Lazard's annual levellized cost of energy (LCOE) reports are well-regarded in the industry.
Wind & Solar: Variable Renewables
Focus on power generation from variable renewables
Most information in this section comes directly from World Energy Outlook 2013 [420], pp 208 - 211.
Unlike dispatchable power generation technologies, which may be ramped up or down to match demand, the output from solar PV and wind power is tied to the availability of the resource. (Electricity generation from (non-dispatchable) variable renewables, such as wind and solar, is weather dependent and can only be adjusted to demand within the limits of the resource availability.) Since their availability varies over time, they are often referred to as variable renewables, to distinguish them from the dispatchable power plants (fossil fuel-fired, hydropower with reservoir storage, geothermal and bioenergy). Wind and solar PV power are not the only variable renewables – others include run-of-river hydropower (without reservoir storage) and concentrating solar power (without storage) – but PV and wind power are the focus of this section as they have experienced particularly strong growth in recent years and this is expected to continue. The output of wind and solar can be adjusted, but only if there is sufficient wind or sun available at a given point in time.
The characteristics of variable renewables have direct implications for their integration into power systems (IEA). The relevant properties include:
Variability: Power generation from wind and solar is bound to the variations of the wind speed and levels of solar irradiance.
Resource location: Good wind and solar resources may be located far from load centers. This is particularly true for wind power, both onshore and offshore, but less so for solar PV, as the resource is more evenly distributed.
Modularity: Wind turbines and solar PV systems have capacities that are typically on the order of tens of kilowatts (kW) to megawatts (MW), much smaller than conventional power plants that have capacities on the order of hundreds of MW. This is changing as the industry matures and large utility-scale projects come are constructed.
Uncertainty: The accuracy of forecasting wind speeds and solar irradiance levels diminishes the earlier the prediction is made for a particular period, though forecasting capabilities for the relevant time-frames for power system operation (i.e., next hours today-ahead) are improving.
Low operating costs: Once installed, wind and solar power systems generate electricity at very low operating costs, as no fuel costs are incurred.
Non-synchronous generation: Power systems are run at one synchronous frequency: most generators turn at exactly the same rate (commonly 50 Hz or 60 Hz), synchronized through the power grid. Wind and solar generators are mostly non-synchronous, that is, not operating at the frequency of the system. To correct this, wind and solar electricity are usually run through an inverter, which converts the direct current (DC) to alternating current (AC) and converts the electricity to the proper frequency.
The extent to which these properties of variable renewables pose challenges for system integration largely depends on site-specific factors, such as the correlation between the availability of wind and solar generation with power demand, the flexibility of the other units in the system, available storage and interconnection capacity, and the share of variable renewables in the overall generation mix. The speed at which renewables capacity is introduced is also important, as this influences the ability of the system to adapt through the normal investment cycle. Elective policy and regulatory design for variable renewables needs to co-ordinate the rollout of their capacity with the availability of flexible dispatchable capacity, grid maintenance and upgrades, storage infrastructure, efficient market operation design, as well as public and political acceptance.
Wind power
Generating power from wind turbines varies with the wind speed. Although there are seasonal patterns in some regions, the hourly and daily variations in wind speed have a less predictable, stochastic pattern. Geographically, good wind sites are typically located close to the sea, in flat open spaces and/or on hills or ridgelines, but the suitability of a site also depends on the distance to load centers and site accessibility. (See the Wind Power [421] page in this lesson for an illustration of wind power availability across the U.S.)
For onshore wind turbines, capacity factors – the ratio of the average output over a given time period to maximum output – typically range from 20% to 35% on an annual basis, excellent sites can reach 45% or above. The power output from new installations is increasing, as turbines with larger rotor diameters and higher hub heights (the distance between the ground and the center of the rotor) can take advantage of the increased wind speeds at higher altitudes. Moreover, wind projects are increasingly being tailored to the characteristics of the site by varying the height, rotor diameter, and blade type. Wind turbines that are able to operate at low wind speeds offer the advantage of a steadier generation profile, reducing the variability imposed upon the power system, but likely reducing annual generation. All of this adds up to less expensive electricity; as you may have noted in the Lazard LCOE reading, onshore wind power is one of the least expensive electricity sources available (though this is only in ideal locations, it should be noted).
Wind turbines located offshore can take advantage of stronger and more consistent sea breezes. Wind speeds tend to increase with increasing distance from the shore, but so too does the seafloor depth, requiring more complex foundation structures. Capacity factors are generally higher ranging from 30% to 45% or more, as distance from the shore or hub height increases. However, offshore wind turbines are more expensive to install because of the high costs associated with the foundations and offshore grid connections. Bottlenecks can also occur due to a shortage of specialized installation vessels.
Solar photovoltaics
Power generation from solar PV installations varies with the level of solar irradiation (irradiation is the amount of solar energy hitting a surface over a period of time) they receive. Irradiation is usually measured in kWh/m2/day or kWh/m2/yr. Geographically, solar irradiation over the course of a year increases with proximity to tropical regions and is more uniformly distributed than wind. Seasonal and daily patterns in output from solar PV systems can be fairly well forecast – on a clear day, solar will follow a consistent pattern, based on the path of the sun through the sky. The power received from the sun is called irradiance, generally measured in W/m2. The irradiance from the sun can be predicted with reasonable accuracy for a given location at a given time of year. Of course, local conditions (particularly shading) can significantly impact irradiance levels. A heavily-shaded area can result in near-zero irradiance levels. (See the solar power [422] page in this lesson for an illustration of irradiation levels across the U.S.)
Wind Power
A picture is worth a thousand words! Below are three examples of wind turbine of varying scales. The world's largest installed turbine is the 12 MW Haliade-X from GE, which has 107 meter (!) blades and a hub height of 150 meters. See this [423]page for some videos and details, if you are so inclined. (Side note: The size of this machine is - to put it in scientific terms - insane.) Bigger turbines are always being developed; read here for more info [424].
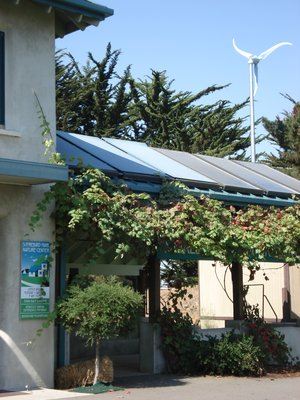
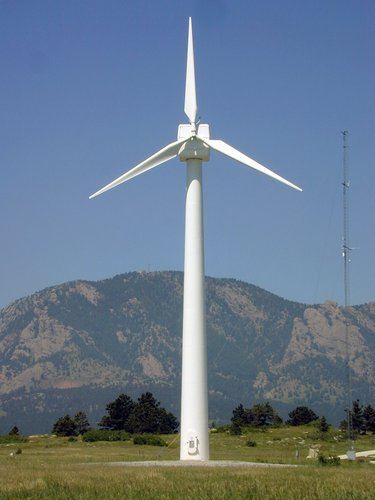
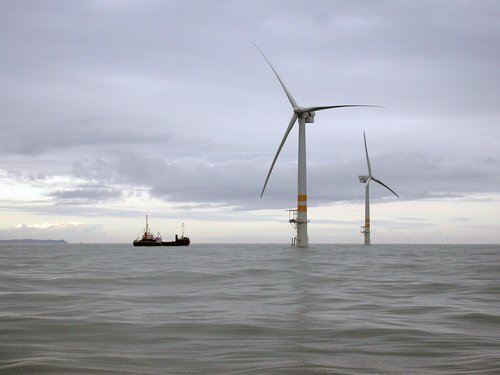
To Read and View Now
- Read "Wind 101: The Basics of Wind Energy [431]" and watch the (3:16) embedded video from the Department of Energy titled "Energy 101: Wind Turbines." If the video does not work, try it here.
- Read through How a Wind Turbine Works [432]and click through the animation from U.S. DOE.
To View Now
Please watch the following (4:18) video from First Wind, Where does Wind Power come from? Climbing Inside a Wind Turbine.
LIZ WEIR: Hey, I'm Liz from First Wind. Today, we're going to be doing something that anyone who's ever seen a wind farm is dying to do-- climb one of these bad boys. Let's go.
RYAN FONBUENA: Just hand over hand, and easy as she goes.
LIZ WEIR: All right, sounds good. See you guys up there.
RYAN FONBUENA: Right now, we are at the base unit section. This is at the top of the base section-- the midsection of the tower's bolted up. We're about 85 feet up in the air right now, and only 180 to go.
LIZ WEIR: Sounds good. Now, you're so much faster than the rest of us. About how often do you climb this thing?
RYAN FONBUENA: I try and climb a couple times a week. Not as much as I used to, but with practice, about a six-minute climb is average, for average technicians.
LIZ WEIR: Six minutes, all the way up?
RYAN FONBUENA: All the way up.
LIZ WEIR: Oh, my gosh.
All right, so Ryan, tell us where we are now.
RYAN FONBUENA: Well, where we are now, we're at the yaw deck of the turbine. This is just below the nacelle at the very top of the top tower section. What we have here, these are all the cables that allow the turbine to not only operate, but to communicate with the master control system in the bottom of the tower.
What we also have here are the power cables that delivers energy from the generator back to the grid.
LIZ WEIR: These guys are pretty smart.
RYAN FONBUENA: Yes, they are very intelligent machines. They're constantly tracking wind speed, wind direction, temperatures. They are very intelligent machines.
LIZ WEIR: All right, now we're heading up to the last leg of the trip, up to the nacelle.
RYAN FONBUENA: Yeah, I'll grab the ladder to get us up there, and we'll get the full tour.
LIZ WEIR: Sounds good. I’m smacking my head-- OK. Here we go. All right. Where to?
RYAN FONBUENA: So here we are at the nacelle.
LIZ WEIR: Now, exactly how many feet are we up in the air right now?
RYAN FONBUENA: We're proximately 270 feet in the air right now. So the wind is obviously going to be a lot stronger up here than it is on the ground.
LIZ WEIR: Can you tell us what we're looking at, in front of us?
RYAN FONBUENA: Yes, what's in front of us now is the main shaft. And this is what the rotor, or the hub, and all three blades are bolted to. The main shaft is running to our gear box here. And what the gear box does is take that low speed rotation, transmits it into a high speed rotation into the generator.
LIZ WEIR: So all the power that's coming from here goes right down through the cables we just saw, on a level before us?
RYAN FONBUENA: Yes, that's correct.
LIZ WEIR: All right, well I think what we're all looking forward to doing is heading up top. Think we can go?
RYAN FONBUENA: Yeah, we'll get up on top.
LIZ WEIR: All right, sounds good.
Oh, my god!
All right, so it's pretty cloudy up here today. But in actuality, how high up are we?
RYAN FONBUENA: We're about 275 feet off the ground now, being on top of the nacelle.
LIZ WEIR: Straight up in the air.
RYAN FONBUENA: Yes.
LIZ WEIR: And behind us, you see a weather station. Can you tell us a bit about what that measures?
RYAN FONBUENA: Yes, the met stations that's behind us measures not only the wind speed, but also the wind direction. So the turbine constantly knows where to point itself into the wind. And with the wind speed, to know when to pitch the blades to start capturing the wind, and when to pitch them out when the wind speeds either get too high, or too low.
LIZ WEIR: To learn more about wind power, please come and visit us at firstwind.com. I'm Liz, I'll see you next time.
To View Now
Please watch the following (2:38) video from Puget Sound Energy.
PRESENTER: We're going to go ahead and climb a C3 wind turbine today. We're going up over 200 feet wind turbine mace wave because of the wind outside. You will be in the close proximity of high voltage cables. 34,500 volts.
PRESENTER 2: So we're set to go ahead and climb up the turbines. So there's a base section, a mid section, and a top section to each turbine. Right now we're in the yaw deck.
This is where the cell’s going to pivot. The gearbox weighs around 20 tons. The generator and air cooler are just less than 10 tons.
Wind Turbine Output
As described in the videos above, wind turbines convert the kinetic energy of the wind into mechanical energy that rotates a rotor, which then spins a generator, which generates electricity. This process (from wind to electricity) has a theoretical maximum efficiency of 59.3% (this is called the Betz Limit [433]), but in practice, turbines operate a significantly lower efficiency.
So where does the energy in the wind come from, and how much is there? Wind is caused by differences in pressure - air from high-pressure areas will naturally move toward areas of lower pressure. Pressure differences are caused by differential heating of the surface of the earth. All else being equal, cold air has a higher pressure than warmer air. There are many localized wind sources, but global wind circulation is caused by cold air from polar regions (relatively high pressure) moving toward warm air (relatively low pressure) toward the equator.
The power in the wind is given by the following equation:
Power (W) = 1/2 x ρ x A x v3
- Power = Watts
- ρ (rho, a Greek letter) = density of the air in kg/m3
- A = cross-sectional area of the wind in m2
- v = velocity of the wind in m/s
Thus, the power available to a wind turbine is based on the density of the air (usually about 1.2 kg/m3), the swept area of the turbine blades (picture a big circle being made by the spinning blades), and the velocity of the wind. Of these, clearly the most variable input is wind speed. However, wind speed is also the most impactful variable because it is cubed, whereas the other inputs are not.
Turbines are rated in terms of capacity, usually in kW or MW. As with other energy sources, this is not the amount of power that a turbine generates at all times - it is the peak output. At peak output, a 100 kW wind turbine will generate 100 kWh of energy over 1 hour (100 kW x 1 h = 100 kWh). To determine the output at different speeds, you need to look at the power curve. The power curve for the 95 kW Northern Power turbine (similar to the turbine in the picture above) is below. As you can see, the turbine will only generate its rated 95 kW with a very limited range of wind speeds. Note also that the turbine has a startup speed of 2 m/s.
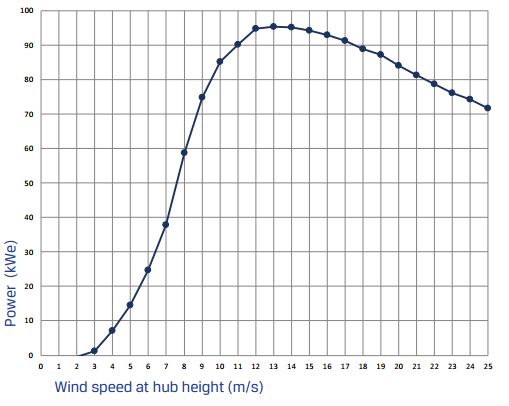
Distributed Wind Generation
Energy.gov's Wind Program gives this description of distributed wind generation:
The Wind Program defines distributed wind in terms of technology application, based on a wind plant's location relative to end-use and power distribution infrastructure, rather than size. The following wind system attributes are used by the Wind Program to characterize them as distributed:
- Proximity to End-Use: Wind turbines that are installed at or near the point of end-use for the purposes of meeting onsite energy demand or supporting the operation of the existing distribution grid.
- Point of Interconnection: Wind turbines that are connected on the customer side of the meter, directly to the distribution grid, or are off-grid in a remote location.
Distributed wind energy systems are commonly installed on, but are not limited to, residential, agricultural, commercial, industrial, and community sites, and can range in size from a 5 kilowatt turbine at a home to a multi-megawatt turbine at a manufacturing facility. Small wind turbine technology, which includes turbines that have a rated capacity of less than or equal to 100 kilowatts, is the primary technology type used in distributed wind energy applications and is the focus of the Wind Program's technology R&D efforts for distributed applications.
Not required, but for more information on distributed wind generation see Distributed wind energy systems [435].
IEA Wind is the International Energy Agency's (IEA) Implementing Agreement for Co-operation in the Research, Development, and Deployment of Wind Energy Systems. "Founded in 1974, the IEA Wind Agreement sponsors cooperative research tasks and provides a forum for international discussion of research and development issues" (IEA Wind [436]).
Visit International Energy Agency (IEA) Wind and open the IEA Wind 2019 Annual Report. [437]
- Read pp. 4 - 13.
OPTIONAL: The most up to date version (2020) of this report can be found here. [438]
Wind Resources in the U.S.
Average wind speeds vary widely by geographical location. Take a few minutes to inspect the wind speed charts from the National Renewable Energy Laboratory below. Note the location of the greatest and smallest wind speeds, and think about the physical characteristics of those areas (e.g. flat, mountainous, on-shore, off-shore, etc.). Click here for a larger version of the 30m wind speed image [439] and click here for the 80 m image. [440] Note that the average wind speed is higher at 80m at the same location. Wind speed generally increases with height due to the decreasing influence of friction from the earth's surface and things on it.
In addition to variability being a barrier to wind deployment, the location of wind resources is as well. In general - and certainly, in the U.S. - the best onshore wind resources are not located near major population centers. Approximately 50% [441] of the U.S. population lives within 50 miles of the coast, but as you can see in the maps below, this is generally not where the greatest onshore wind is located. This is a problem because transporting electricity over power lines results in energy loss (as heat) due to electrical resistance in wires. The longer the electricity has to travel, the more energy is lost. To minimize this loss, large (and very expensive) power lines must be built. As you can imagine, this type of infrastructure is lacking in areas of the country that do not have large populations.
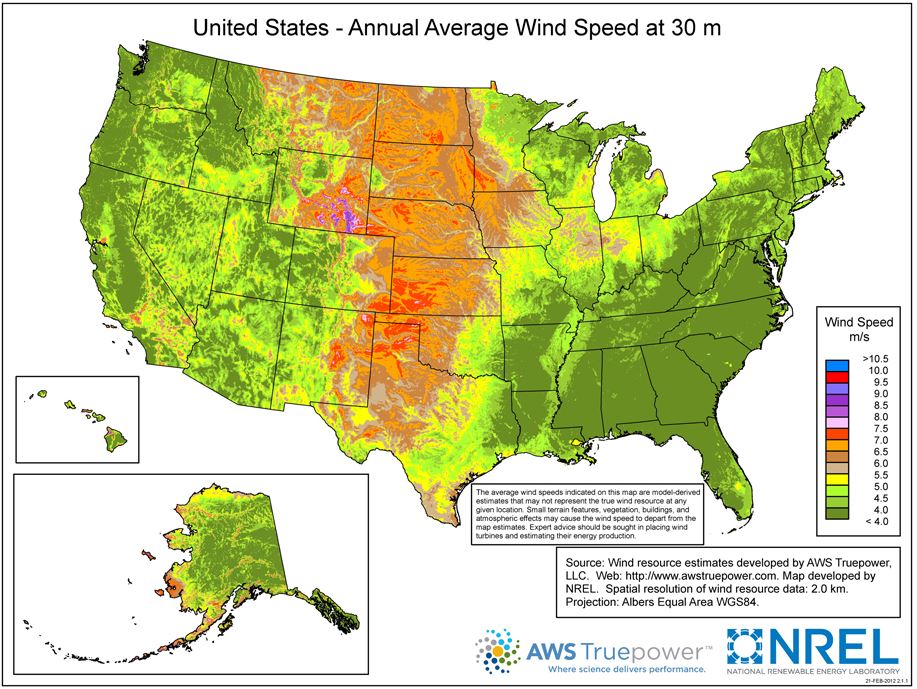
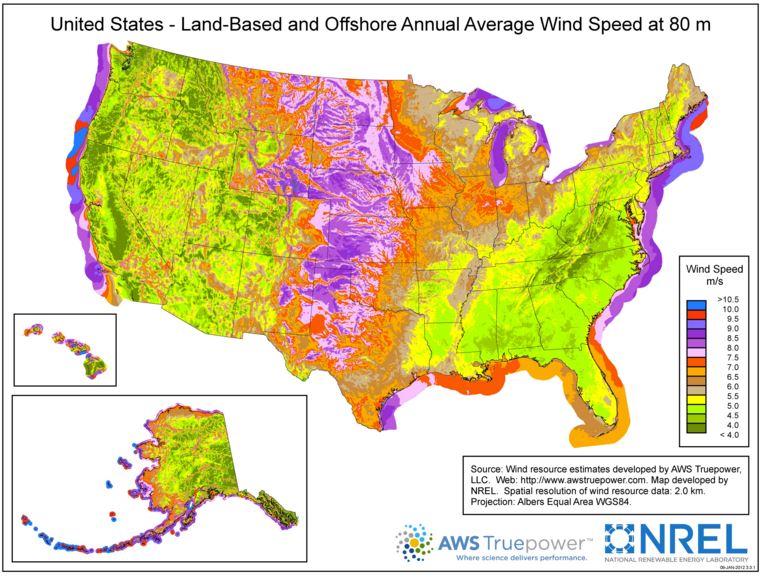
To Read Now
For an idea of how expensive building high voltage lines can be ($560 million to $720 million for 224 miles!) and to gain some insight on some interesting issues related to wind, hydro, and international energy issues, read the summary below.
- "Presidential Permit Paves Way for Minnesota Power's Great Northern Transmission Line to Deliver Canadian Hydropower to Customers [443]." Business Wire, November 16, 2016.
- Also read a brief update on this project. The lines are energized and the project started on time! "Minnesota Power energizes Great Northern Transmission Line to move company closer to 50 percent renewable energy by 2021 [444]," Minneota Power News, June 2020.
Solar Energy
Every single hour, the Earth’s surface receives more energy from the sun than the entire world's human population uses in a year. And, as far as fuel prices go, the price is right!
It is only natural that we have learned to work with the sun--to use it for our convenience and well-being. We use energy from the sun in all sorts of ways, to heat water, dry clothes, warm spaces and generate electricity. Be they simple or complex, these designs and technologies all use “solar energy” for useful purposes.
Uses of Solar Energy, Other than Electricity Generation
Passive Solar Energy
This is the art and science of designing systems (typically buildings) to work in cooperation with the sun, without any mechanization. There are no motors, no fans or blower or switches, for example. Instead, there are simple features, such as deep overhangs that provide shading in the summer, when the sun is high and temperatures are warm, but let the sunlight in the winter, when the sun is low and the warmth is welcomed. If you would like more information, a good starting place is the Department of Energy's Passive Solar Design [445] page. (Clothes lines are another example of passive solar, and wind. A "renewable dryer" investment has a terrific return, financially and environmentally!)
Solar Thermal Systems
This is a broad term for systems that use energy from the sun to heat water (or other material) for a variety of purposes.
- Sometimes the water is used for “domestic” purposes, such as drinking, cooking, bath and showers, laundry, and so forth. These are called solar domestic hot water (DHW) systems.
- Solar-heated water may also be used for other purposes, such as swimming pool heating, to warm or cool (really!) buildings, and industrial process heating.
- Solar concentrating systems are another form of solar thermal. (See below)
For clear understanding and communication, it is useful to keep in mind the broad meaning of “solar thermal” and to be specific regarding the technology of a given application.
Solar Energy for Electricity Generation
These are systems that use energy from the sun to generate electricity. There are two general categories: photovoltaics (PV) and concentrating solar power (CSP).
Photovoltaics (PV)
Certain materials have the natural property of converting energy from the sun into electricity. When the sun hits these materials, electrons start to flow, creating a direct current (DC). This is the photovoltaic effect. Photovoltaic materials (semiconductors) are packaged into solar cells, which are appropriately wired and connected together into modules (also called panels) to collect the flow of electrons into a current and make it available for our use. If you have a solar-powered calculator, the little window is a small solar cell. The solar arrays that you may see on a rooftop are an installed group of solar modules wired together. Systems that use photovoltaic components to generate electricity are photovoltaic (PV) systems.
To Watch and Read Now
- From Energy.gov, watch the (2:00) video Solar 101: Solar Photovoltaics [446] and read the material below the video.
- "Why China Is Dominating the Solar Industry [447]." Scientific American, December 19, 2016. This provides a good overview of the role of incentives in the development of the global solar PV industry, as well as an aggressive plan for a "global grid."
- For an update on China's solar industry, read "Solar Power Is Now as Inexpensive as Grid Electricity in China [448]" from IEEE Spectrum (August 20, 2019).
- Also read this caveat to the idea of "grid parity" from PV Magazine. "'True grid parity about more than electricity price,' [449]" PV Magazine, July 11, 2019.
Solar PV Output
The output of an array is primarily dictated by the amount of solar energy (insolation) hitting the panel over a given time period. Insolation is highest when the panel is directly facing the sun, when the sun is at its peak in the sky (at solar noon, which is usually not the same as local noon), and when it is unshaded. Insolation is synonymous with irradiation, noted earlier in this lesson. Irradiance, on the other hand, is the amount of solar power (not energy) hitting a surface at any given moment, or the average power over a given period of time. This is typically measured in W/m2.

Like wind, a solar array's capacity is rated in power (usually kW, but larger ones can be rated in MW). Also like wind, solar panels only generate full capacity under optimal conditions, mostly having to do with panel temperature and irradiance level. Further, the capacity is what is directly generated by the panels, and does not include other losses. After generated by a panel, the electricity must travel through wires and (usually) an inverter. There are other factors that impact output, such as panel imperfections, loss of efficiency over time, and mismatch of panels in an array. All of this adds up to losses, usually in the range of 10%. All of these losses together are called the derating factor (sometimes called a "derate factor"). A derating factor of 80% means that 20% of the energy generated by the panel is lost (to heat) before it leaves the PV system. Note that derating does not include losses associated with shading or imperfect panel placement! Finally, the hotter a panel gets, the less energy it generates, and the colder it gets, the more it generates (all else being equal). Because of this, it is not uncommon for a solar array to generate nearly as much electricity on a very cold, clear winter day as a hot summer day, despite the fact that irradiance is significantly higher in the summer.
When all is said and done, it is not unusual for an array to generate 20% - 30% less than its rated capacity, especially if the panels are not tilted at a perfect angle and facing an ideal direction (the compass direction a panel is faced is called its azimuth), and/or is partially shaded during certain times of the year/day.
A 1 kW array will generate 1 kWh of electricity over the course of one hour if it is operating at full capacity, but if it has a derating factor of 85%, it will only generate 0.85 kWh. If there is a 10% additional loss due to shading and other losses, the output would be 0.765 kWh (0.85 kWh x 0.9 = 0.765 kWh).
Concentrating Solar Power (CSP)
Systems that use mirrors (heliostats) to reflect (focus) the sun's energy onto a single point or area are called concentrating solar power or CSP systems. They use mirrors to focus energy from the sun to heat synthetic oil, molten salt, gasses, or other materials to high temperatures for purposes of generating electricity (by generating steam to turn a turbine or with a Sterling Engine.) The focused energy may be used to create very high temperatures for generating electricity (with a Sterling Engine or by creating steam to drive a turbine).
To Read and Watch Now
- From Energy.gov, watch the (2:16) video Solar 101: Concentrating Solar Power [451].
- From the World Economic Forum (May 2018), read "Morocco is building a giant thermosolar farm in the Sahara Desert [452]."
Concentrating Photovoltaic (CPV)
These systems use highly concentrated (focused) sunlight to generate electricity directly from photovoltaics. According to a December 2013 report (Concentrated PV (CPV) Report [453], from IHS), "After years of slow progress, the global market for concentrated photovoltaic (CPV) systems is entering a phase of explosive growth, with worldwide installations set to boom by 750 percent from 2013 to the end of 2020. CPV installations are projected to rise to 1,362 megawatts in 2020, up from 160 megawatts in 2013." For better or worse (despite promising research like this [454]at Penn State), the market for concentrated solar PV has yet to materialize, due in large part to the rapid drop in PV module prices.
Lesson 9 Assignment
Weekly Activity 9
Please review Canvas calendar for all due dates related to your Nonmarket Analysis Case Study.
Deliverables
Complete "Weekly Activity 9," located in the "Weekly Activities" folder under the Modules tab. The activity may include a variety of question types, such as multiple choice, multiple select, ordering, matching, true/false, and "essay" (in some cases these require independent research and may be quantitative). Be sure to read each question carefully.
Unless specifically instructed otherwise, the answers to all questions come from the material presented in the course lesson. Do NOT go "googling around" to find an answer. To complete the Activity successfully, you will need to read the lesson, and all assigned readings, fully and carefully.
Each week, a few questions may involve research beyond the material presented in the course lesson. This "research" requirement will be made clear in the question instructions. Be sure to allow yourself time for this! You will be graded on the correctness and quality of your answers. Make your answers as orderly and clear as possible. Help me understand what you are thinking and include data where relevant. Remember, numbers should ALWAYS be accompanied by units of measure (not "300" but "300 kW"). You must provide ALL calculations/equations to receive full credit - try to "talk me through" how you did the analysis.
This Activity is to be done individually and is to represent YOUR OWN WORK. (See Academic Integrity and Research Ethics [52] for a full description of the College's policy related to Academic Integrity and penalties for violation.)
The Activity is not timed, but does close at 11:59 pm EST on the due date as shown on the Calendar.
If you have questions about the assignment, please post them to the "Questions about EME 444?" Discussion Forum. I am happy to provide clarification and guidance to help you understand the material and questions (really!). Of course, it is best to ask early.
Summary and Final Tasks
In this lesson, you learned about renewable energy, specifically the use of wind and solar technology for electricity generation. We reviewed important concepts related to distributed generation and policies that work to support and incentivize these technologies, including on- and off-grid applications, net metering, rebates, tax credits, and performance-based incentives.
You learned:
- to quantify current and projected worldwide use of renewable energy;
- about using units of measure for power and energy correctly and consistently;
- about distributed generation and associated concepts, including on- and off-grid and net metering;
- commonly used incentive structures for renewable energy including tax credits, rebates and performance-based incentives (Renewable Portfolio Standards and Feed-In Tariffs);
- to describe wind-energy technology and resources and issues affecting growth of the industry;
- three categories of solar-energy systems: passive, thermal, and electric-generating;
- the components of photovoltaic systems and the purpose of each;
- the features of four types of concentrating solar power systems;
- the status of and advances in the use of solar for electricity generation.
Have you completed everything?
You have reached the end of Lesson 9! Double-check the list of requirements on the first page of this lesson to make sure you have completed all the activities listed there.
10 Europe
Introduction
Overview of Lesson 10
With this lesson, we will explore the energy landscape of Europe, including policies and programs, energy sources and consumption, and the challenge to create an infrastructure supporting an internal EU energy market.
What will we learn?
By the end of this lesson, you should be able to...
- identify all countries in Europe and those that are and are not members of the European Union;
- describe the history of the European Union and explain its institutions;
- explain how the EU makes decisions;
- list and and describe the operation of key EU policies and programs related to energy and the environment, including the Treaty of Lisbon, EU ETS, "20-20-20" and the SET-Plan;
- quantify and describe energy supply and demand across Europe, including electricity generation and strategic priorities for future investment and development;
- describe opportunities and challenges of using infrastructure developments to enable a single internal EU energy market;
- research energy markets of individual European countries.
What is due for Lesson 10?
The table below provides an overview of the requirements for Lesson 10. For details, please see individual assignments.
Please refer to the Calendar in Canvas for specific time frames and due dates.
| REQUIREMENT | SUBMITTING YOUR WORK |
|---|---|
| Read Lesson 10 content and any additional assigned material | Not submitted. |
| Weekly Activity 10 | Yes—Complete Activity located in the Modules Tab in Canvas. |
Europa
Bonjour!, ¡Hola, Olá, Hallo!

Geography
Europe is the 2nd smallest continent after Australia. The mainland of Europe is a peninsula of the western part of the Eurasian supercontinent, with no clear geological boundary to the east. By convention, it is separated from Asia by the Ural Mountains, the Ural River, the Caucasus Mountains, and in the southeast by the Caspian Sea and the Black Sea.
In the south, Europe is separated from Africa by the Mediterranean Sea. In the west, Europe's borders are defined by the Atlantic Ocean and, to the north, by the Polar Sea.
The United Nations recognizes four subregions in Europe [456]: Eastern Europe, Northern Europe, Southern Europe, and Western Europe.
European Union or Euro Area?
Two political economy-related terms that are often bandied about and sometimes conflated are European Union (EU) and Euro area (though you will still sometimes see it referred to as the Eurozone). It is important to differentiate between the two, as they are not synonymous. According to the EU, the European Union "is a unique economic and political partnership between 27 European countries that together cover much of the continent" (European Union: The EU in brief [457]). As you will see, the EU is defined by a series of agreements (mostly treaties) that were for a long time focused on establishing economic relationships, but have more recently become more political in nature. See the countries in the EU in the map above, and feel free to visit the EU's website [458] for brief details on each country.
The Eurozone/Euro area is defined by Investopedia [459]as "a geographic and economic region that consists of all the European Union countries that have fully incorporated the euro as their national currency." The euro began as a "virtual currency" in 1999 (used for "cash-less payments and accounting purposes"). The first banknotes were distributed on January 1, 2002. There are currently 19 countries in the Euro area (out of 27 EU member states), with close to 340 million people using the euro on a daily basis (European Union: The euro [460]). For a full list of Eurozone countries, visit the European Union website [461].
To Read Now
Visit One-World [462].
Read/view the list of countries in Europe. Then take a little trip! Look at the map or visit the EUN member countries in brief page [463] to explore. Notice cities, languages, currency, and natural resources.
European Union
To Read Now
For a brief history lesson on the EU:
- Read The history of the European Union [464] from Europa.
- Watch the (4:17) video A brief history of the European Union. [465]
From the Delegation of the European Union to the United States, read How the EU Works [466]. (Sorry for the archived link - the link went dead not long after President Trump took office, but the information is still valid and is a good summary). Note the different roles and memberships of the European Council, the European Commission, the Council of the European Union, and the European Parliament. (OPTIONAL: If you are interested in digging deeper into legislation and legal powers of the various bodies, see these Fact Sheets [467] from the European Parliament.)
Visit Europa and read
- EU Institutions and Other Bodies [468] (you may need to browse overview of the European Commission, European Parliament, and Council of the European Commission for this week's assignment).
- EU law [469] and How EU decisions are made [470] and watch the videos and go through the Ordinary legislative procedure graphic near the bottom of the page. You may have to enable the content by checking a box.
As you are probably aware, Great Britain voted to exit the EU in 2016. This is the first time that a country has voted to leave the EU. Please read the following summary of the so-called "Brexit."
- Read "What Was Brexit, and How Did It Impact the UK, EU, and the US? [471]" from The Balance.
Energy Policy
The Treaty of Lisbon

Since 2004, the number of EU member countries has grown from 15 to 27 through two waves of "enlargement," as the process is called. To address needed reforms for the larger group and current times, The Lisbon Treaty was signed by all EU Member States on 13 December 2007.
This important treaty "modernizes" some of the ground rules for EU countries working together, because "The European Union (EU) of 27 members [had] been operating with rules designed for an EU of 15 Member States." At the time the treaty was signed, "there [was] increasing support for the EU to work together on issues that [affected all countries], such as climate change, energy security, and international terrorism." The Lisbon treaty is designed to "lead to greater efficiency in the decision-making process" when tackling problems that impact multiple EU countries. (All quotes are from "Explaining the Treaty of Lisbon [474]," which I might add provides an excellent overview of the treaty if you are interested in learning more). The Treaty went into effect on 1 December 2009.
The Treaty opened the door for many new opportunities for the EU to work together, including areas related to the environment and energy.
The Treaty of Lisbon states that one of the Union’s objectives is to work for the sustainable development of Europe based, in particular, on a high level of protection and improvement of the quality of the environment. Although the idea of sustainable development was included in the existing treaties, the Treaty of Lisbon reinforces and better defines this objective. Sustainable development is also affirmed as one of the fundamental objectives of the Union in its relations with the wider world.
The environment is one of the spheres of competence shared between the Union and the Member States...When the Union intervenes in this area, it must contribute to the pursuit of clear objectives: preserving, protecting, and improving the quality of the environment; protecting human health; promoting prudent and rational utilization of natural resources; promoting measures at the international level to deal with regional or worldwide environmental problems.
A reference to the need to combat climate change in measures at the international level has also been added. This is the first time that climate change is explicitly referred to in the treaties.
Energy is not an EU policy area in the treaties in its own right. The new energy policy aims to ensure the functioning of the energy market, security of supply, the promotion of energy efficiency and energy saving, the promotion of the development of new and renewable forms of energy, and the promotion of the interconnection of energy networks.
(Explaining the Treaty of Lisbon [474])
The Treaty also contains "a specific chapter on energy which defines the key competencies and the overall objectives of energy policy: the functioning of energy markets, security of supply, energy efficiency and savings, the development of new and renewable forms of energy and the interconnection of energy networks. For the first time there is a principle of solidarity, ensuring that if one country faces severe difficulties in the supply of energy, other Member States will help keep the country supplied." (Europa, Policies for a better life [475], retrieved October 2011)
To Read Now
Important EU policies and programs related to energy and the environment:- EU-ETS The EU Emissions Trading System operates by the allocation and trading of greenhouse gas emissions allowances throughout the EU - one allowance represents one tonne of carbon dioxide equivalent. From the European Commission Climate Change, read European Union Emissions Trading System [476] and watch the video.
- 20 climate & energy package From the European Commission Climate Action, read 2020 climate & energy package [477].
- 2030 climate & energy framework from the European Commission Climate Action, read the summary of the framework [478].
- 2050 long-term strategy from the European Commission Climate Action, read the summary of the 2050 long-term strategy [479].
- Progress made in cutting emissions from the European Commission Climate Action. Read the summary of progress [480] toward cutting emissions.
- The Paris Agreement (as explained earlier) is a landmark agreement from December 2016. Read a summary review of the Paris Agreement and EU's role in it from the European Commission on Climate Action [481].
- The EU's Corporate Sustainability Reporting Directive (CSRD) will require a number of businesses within the EU to submit formal reports outlining the climate impact of their activities. The U.S. Securities and Exchange Commission is preparing similar requirements for U.S. firms. Read the Brookings Institution Summary [482] of these rules. Optional reading is the text of the CSRD [483] itself.
Energy Supply and Demand
To Read Now
Visit the European Union's Publications Office [484]:
- View at the bottom of the page (or download your own .pdf) "EU Energy in Figures: Statistical Pocketbook 2021." Browse through Section 1.2 - Energy in the EU (Overview) and Section 1.3 (EU 2020-2030 Targets). (Note that this is a clickable .pdf, so you can navigate quickly to sections.)
It will help to know that an Mtoe is a megatonne of oil equivalent. It represents the amount of energy released from burning one million tonnes of crude oil. In OECD/IEA tabulations, 1 Mtoe is equal to 4.1868 x 10¹⁶ J and is used as the general unit to describe the energy content of all fuels. (APS Physics [485])
The International Energy Agency [261] (IEA)
was initially designed to help countries co-ordinate a collective response to major disruptions in the supply of oil, such as the crisis of 1973/4. While this remains a key aspect of its work, the IEA has evolved and expanded significantly.
The IEA examines the full spectrum of energy issues including oil, gas and coal supply and demand, renewable energy technologies, electricity markets, energy efficiency, access to energy, demand side management and much more. Through its work, the IEA advocates policies that will enhance the reliability, affordability and sustainability of energy in its 29 member countries and beyond.
Today, the IEA is at the heart of global dialogue on energy, providing authoritative analysis through a wide range of publications, including the flagship World Energy Outlook and the IEA Market Reports; data and statistics, such as Key World Energy Statistics and the Monthly Oil Data Service; and a series of training and capacity building workshops, presentations, and resources.
The four main areas of IEA focus are:
- Energy Security: Promoting diversity, efficiency, flexibility and reliability for all fuels and energy sources;
- Economic Development: Supporting free markets to foster economic growth and eliminate energy poverty;
- Environmental Awareness: Analysing policy options to offset the impact of energy production and use on the environment, especially for tackling climate change and air pollution; and
- Engagement Worldwide: Working closely with partner countries, especially major emerging economies, to find solutions to shared energy and environmental concerns. (IEA: Organisation and structure [486])
As noted in a prior lesson, the IEA is a subsidiary of the Organization for Economic Cooperation and Development (OECD). The IEA is careful to note [487] that they are "an autonomous intergovernmental organization within the OECD framework."

Launched in June 2006, Energy Technology Perspectives is the IEA's leading biennial publication. The series is a response to a request from the G8 in 2005 for guidance on how to achieve a clean, clever, and competitive energy future and how to achieve an 80% reduction in global CO2 emissions by 2050.
The 2020 Energy Technology Perspectives provides an analysis of how to achieve international "climate and sustainable energy goals," with a focus specifically on technology, including "electrification, hydrogen, bioenergy and carbon capture, utilization and storage" (IEA [490]Energy Technology Perspectives 2020 [490]). Scenario building lies at the core of their analysis, and they focus on two different emissions scenarios, as follows:
Stated Policy Scenario: This scenario serves as a benchmark for the projections of the Sustainable Development Scenario. It assesses the evolution of the global energy system on the assumption that government policies and commitments that have already been adopted or announced with respect to energy and the environment are implemented, including commitments made in the nationally determined contributions under the Paris Agreement. Where commitments are aspirational, such as the goal of reaching net-zero emissions, a judgement is made as to the likelihood of those commitments being fully met based on an assessment of the impact of measures that have been agreed to date. This scenario does not assume any future changes to existing and announced policies and measures, although it does consider their impact on long-term technology evolution as a means to guide scenario expectations beyond the time horizon of current policy plans .
Sustainable Development Scenario: This is the scenario which lies at the heart of ETP-2020 and that is used to illustrate the technology needs for reaching net-zero emissions from the energy sector. It describes the broad evolution of the energy sector that would be required to reach the United Nations Sustainable Development Goals (SDGs) most closely related to energy: achieving universal access to energy (SDG 7), reducing the impacts of air pollution (SDG 3.9) and tackling climate change (SDG 13). It is designed to assess what is needed to meet these goals, including the Paris Agreement, in a realistic and cost-effective way. The trajectory for energy- and industry-related CO2 emissions in the Sustainable Development Scenario is consistent with reaching global net-zero CO2 emissions from the energy sector in 2070
Source: IEA [490]Energy Technology Perspectives 2020 [491], pp. 68-70
To Read Now
In the International Energy Agency's Energy Technology Perspectives 2020, read the following:
- Go to Energy Technology Perspectives 2020 [490]. Download the full report (on the right-hand side, click "Full report" - there is also a copy in Canvas). Read the Executive Summary and "What we mean by clean energy technology" section on pp. 27 - 28
- (Optional) Browse the full report.
The IEA provides a number of publications [495], many of which are freely available. Among them are the "Market Report Series [496]" each year for a variety of fuels. They provide a lot of detail on various energy technology uses and projections.
EU Energy Infrastructure
The EU’s goals for a competitive, sustainable, and secure supply of energy for all member countries is best achieved when energy is available from a wide range of sources. And often, these energy sources are located far from the areas of highest demand, the major markets.
The requirements for infrastructure are addressed in the EU communication, Energy infrastructure priorities for 2020 and beyond - A Blueprint for an integrated European energy network [497].
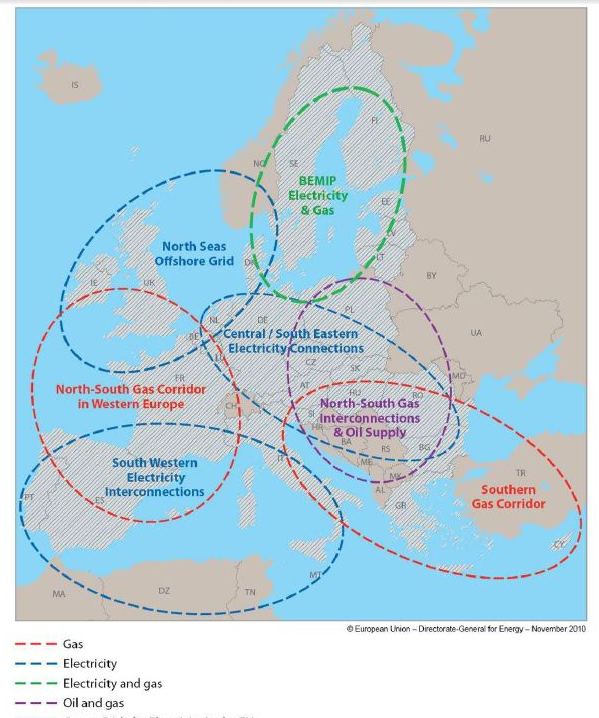
The excerpt below sets the stage for understanding the map above. More details are provided in the assigned reading. The excerpt is from the opening section of Energy infrastructure priorities for 2020 and beyond - A Blueprint for an integrated European energy network [498].
1. Introduction
Europe's energy infrastructure is the central nervous system of our economy. EU energy policy goals, as well as the Europe 2020 economic aims, will not be achievable without a major shift in the way European infrastructure is developed. Rebuilding our energy system for a low-carbon future is not just a task for the energy industry. Technological improvements, greater efficiencies, resilience to a changing climate, and new flexibility will be necessary.
This is not a task which a single Member State can achieve on its own. A European strategy, and funding, will be necessary.
The Energy Policy for Europe, agreed by the European Council in March 2007, establishes the Union’s core energy policy objectives of competitiveness, sustainability, and security of supply. The internal energy market has to be completed in the coming years and by 2020 renewable sources have to contribute 20% to our final energy consumption, greenhouse gas emissions have to fall by 20%, and energy efficiency gains have to deliver 20% savings in energy consumption. The EU has to assure security of supply to its 500 million citizens at competitive prices against a background of increasing international competition for the world's resources. The relative importance of energy sources will change. For fossil fuels, notably gas and oil, the EU will become even more dependent on imports. For electricity, demand is set to increase significantly.
The Energy 2020 Communication, adopted on 10 November 2010, called for a step change in the way we plan, construct, and operate our energy infrastructures and networks. Energy infrastructures are at the forefront of the flagship initiative "Resource efficient Europe."
Adequate, integrated, and reliable energy networks are a crucial prerequisite not only for EU energy policy goals, but also for the EU's economic strategy. Developing our energy infrastructure will not only enable the EU to deliver a properly functioning internal energy market, it will also enhance security of supply, enable the integration of renewable energy sources, increase energy efficiency, and enable consumers to benefit from new technologies and intelligent energy use.
The EU pays the price for its outdated and poorly interconnected energy infrastructure. In January 2009, solutions to the gas disruptions in Eastern Europe were hindered by a lack of reverse flow options and inadequate interconnection and storage infrastructures. Rapid development of offshore wind electricity generation in the North and Baltic Sea regions is hampered by insufficient grid connections, both off- and onshore. Developing the huge renewables potential in Southern Europe and North Africa will be impossible without additional interconnections within the EU and with neighboring countries. The risk and cost of disruptions and wastage will become much higher unless the EU invests as a matter of urgency in smart, effective, and competitive energy networks, and exploits its potential for energy efficiency improvements.
[...]
A new EU energy infrastructure policy is needed to coordinate and optimize network development on a continental scale. This will enable the EU to reap the full benefits of an integrated European grid, which goes well beyond the value of its single components. A European strategy for fully integrated energy infrastructures based on smart and low-carbon technologies will reduce the costs of making the low-carbon shift through economies of scale for individual Member States. A fully interconnected European market will also improve security of supply and help stabilize consumer prices by ensuring that electricity and gas goes to where it is needed. European networks including, as appropriate, with neighboring countries, will also facilitate competition in the EU’s single energy market and build up solidarity among Member States. Above all, integrated European infrastructure will ensure that European citizens and businesses have access to affordable energy sources. This in turn will positively contribute to Europe's 2020 policy objective of maintaining a strong, diversified and competitive industrial base in Europe.
To Read Now
Referring to the map above, "EU priority corridors for electricity, gas and oil," open and read the EU publication, Energizing Europe [499].
Summary Readings
To Read Now
Visit the European Files [500] website. There are a number of free online magazines that contain articles written by important business and policy leaders throughout Europe. This is a great resource for learning about a variety of current issues in Europe. Feel free to tool around - there is a LOT of information available! Then, please do the following:
- Go to the July 2020 Issue [501] of the European Files, which focuses on decarbonization of the European economy. Read "Batteries are closing the loop of Europe’s climate and industrial leadership" by Diego Pavia, CEO of EIT InnoEnergy. (You can click on them in the table of contents on the web page.)
- From the May 2018 Isue, read "Energy efficiency of buildings should help to structurally reduce fuel poverty [502]" by Simona Bonafe, MEP (S&D Group)
Lesson 10 Assignment
Weekly Activity 10
Please review Canvas calendar for all due dates related to your Nonmarket Analysis Case Study.
Deliverable
Complete "Weekly Activity 10," located in the "Weekly Activities" folder under the Modules tab. The activity may include a variety of question types, such as multiple choice, multiple select, ordering, matching, true/false, and "essay" (in some cases these require independent research and may be quantitative). Be sure to read each question carefully.
Unless specifically instructed otherwise, the answers to all questions come from the material presented in the course lesson. Do NOT go "googling around" to find an answer. To complete the Activity successfully, you will need to read the lesson, and all assigned readings, fully and carefully.
Each week, a few questions may involve research beyond the material presented in the course lesson. This "research" requirement will be made clear in the question instructions. Be sure to allow yourself time for this! You will be graded on the correctness and quality of your answers. Make your answers as orderly and clear as possible. Help me understand what you are thinking and include data where relevant. Remember, numbers should ALWAYS be accompanied by units of measure (not "300" but "300 kW"). You must provide ALL calculations/equations to receive full credit - try to "talk me through" how you did the analysis.
This Activity is to be done individually and is to represent YOUR OWN WORK. (See Academic Integrity and Research Ethics [52] for a full description of the College's policy related to Academic Integrity and penalties for violation.)
The Activity is not timed, but does close at 11:59pm EST on the due date, as shown in Canvas.
If you have questions about the assignment, please post them to the "Questions about EME 444?" Discussion Forum. I am happy to provide clarification and guidance to help you understand the material and questions (really!). Of course, it is best to ask early.
Summary and Final Tasks
In this lesson you learned...
- to identify all countries in Europe and which are members of the European Union;
- the history of the European Union and to identify its institutions;
- how the EU makes decisions;
- about key EU policies and programs related to energy and the environment, including the Treaty of Lisbon, EU ETS, "20-20-20," and the SET-Plan;
- to quantify and describe energy supply and demand across Europe, including electricity generation and strategic priorities for future investment and development;
- some opportunities and challenges of using infrastructure developments to enable a single internal EU energy market;
- to research energy markets of individual European countries.
Have you completed everything?
You have reached the end of Lesson 10! Double-check the list of requirements on the first page of this lesson to make sure you have completed all the activities listed there.
11 China
Introduction
Overview of Lesson 11
With this lesson, we will explore China, including the Chinese Communist Party and its role in society and business and the opportunities and challenges of doing business with and in China.
What will we learn?
By the end of this lesson, you should be able to...
- identify characteristics related to geography, population, and Chinese society;
- explain Chinese government and key institutions;
- describe business models for foreign investment in China;
- explain energy markets in China, in terms of supply and demand;
- discuss China's Five Year Plans and implications for the energy sector;
- explain the World Trade Organization and its role in international trade;
- describe what a Clean Development Mechanism is.
What is due for Lesson 11?
The table below provides an overview of the requirements for Lesson 10. For details, please see individual assignments.
Please refer to the Calendar for specific time frames and due dates.
| REQUIREMENT | SUBMITTING YOUR WORK |
|---|---|
| Read Lesson 11 content and any additional assigned material | Not submitted. |
| Weekly Activity 11 | Yes—Complete Activity located in the Modules Tab in Canvas. |
| Case Study--participate in Case Study Q & A as described in weekly announcement | Check Announcements for all Case Study Due Dates. |
People's Republic of China (PRC)
Ni Hao, ??

Geography & Population
Welcome to China! Located in Eastern Asia, China is the world's fourth largest country in terms of geographic area (following Russia, Canada, and the United States). With nearly 20% of the world's people (about four times the population of the United States), China is the most populated country in the world. And Mount Everest, the world's tallest peak, is on the border China shares with Nepal.
To Read Now
Visit United States Central Intelligence Agency publication, The World Fact Book [504]
- Click on "Learn more" under "Country Comparisons," near the bottom of the page. Acquaint yourself with the categories of information presented.
- Choose a topic, then in the menu on the left, choose "East and Southeast Asia" for China to appear. Click on "China" for info to appear. Familiarize yourself with the structure and nature of the information available.
To Read Now
At this point, please complete Lesson 11 Reading: China, from Chapter 16 "China: History, Culture, and Political Economy" of Business and Its Environment by David P. Baron (Prentice Hall, 2010). A PDF can be found in the Lesson 11 Modules tab [505].
Some tips you will find helpful with these readings: "structured pluralism" here refers to a system where multiple stakeholders may be involved on an issue and have different preferences for its outcome. These preferences are expressed to political and social institutions, which act in ways that shape business opportunities. Sound familiar? Hope so! It is the nonmarket system described earlier in this course, with the added reminder that the nonmarket exists in a context of culture and history.
Also, very important, please remember that Baron uses the word "interests" to represent what we (more clearly, I believe) call "stakeholders." And, SOE means State-Owned Enterprise. CCP means Chinese Communist Party. PRC is the People's Republic of China, the official name of China. Read the following:
- Discussion of guanxi, excerpt on pages 526 - 527 (as noted)
- The Nonmarket Environment and the Four I’s, pages 527 – 532
- Business: State-owned Enterprises, Foreign Direct Investment, and International Trade, pages 532 – 535
- Continuing Issues, pages 535 – 540
Reading Assignments are under the Modules Tab.
If you are interested, read this [506]recent, short article from Harvard Law that explains the continued role of guanxi in Chinese domestic and international business.
Economic Planning

Five-Year Plans
Every five years, China establishes a plan for economic development over the next five years that includes targets for growth and priorities for development. The first Five-Year Plan began in 1953, followed by new plans every five years, up to the 14th FYP, which was adopted in January 2022.
Role of Planning in the Chinese Economy
The Chinese economy is a mixed economy, as it combines important features of a market economy and a planned economy. To understand the role of economic planning in China, it is necessary to review its history briefly. During the period from 1953 when the first Five-Year Plan began to the end of the 1970s, China practiced central planning under the direction of the State Planning Commission (SPC). The main function of planning was to direct the production of major products by state-owned enterprises. The State Council had a large number of ministries, most of which were responsible for the production of the corresponding products. There were ministries for agriculture and fisheries, forestry, coal, petroleum, chemical products, metallurgy, consumer products, textile, machine building, electronics, nuclear energy, aircraft, ammunition, space, geology and mineral resources, water resources and electric power, railroads, transportation and communications, posts and telecommunications, urban and rural construction and environmental protection, finance, commerce, etc.
Beginning in 1978 the Chinese government changed the economic system gradually towards a market economy, allowing non-state enterprises to produce and compete with state enterprises. The Commission for Restructuring the Economic System was established in 1982 to direct economic reform. This Commission was under the chairmanship of the Prime Minister himself while the Planning Commission was chaired by a Vice Premier. In 1998, the SPC was renamed the State 2 Development Planning Commission (SDPC), which then merged with the Commission for Restructuring the Economic System and the State Economic and Trade Commission (SETC). In 2006, it was renamed the National Commission for Development and Reform (NCDR), with the term planning omitted, perhaps to convey to the world that China was no longer a centrally planned economy. The NCDR continues to prepare Five-Year Plans based on a draft from the Central Committee of the Communist Party. Each Plan has to be approved by the National People’s Congress.
(Economic Planning in China [508], Chow, Gregory C., Princeton University, CEPS Working Paper No. 219, June 2011)
To Read Now
From China Dialogue, read China’s Five Year Plan for energy: One eye on security today, one on a low-carbon future [509]. If you are interested in details of the what the newest plan means for energy and climate (not required) see "Q&A: What does China’s 14th ‘five year plan’ mean for climate change? [510]" from Carbon Brief.
- In 2020, China made an unexpected announcement to reach carbon neutrality by 2060. Read "China pledges to become carbon neutral before 2060 [511]" from the Guardian for details.
There are some very practical reasons for China's new focus on cleaner energy, the health of its citizens among them. For example, in 2016 the World Health Organization determined [512] (you don't need to read this article) that 1,000,000 people died from dirty air in China in 2012.
- Read a summary of air pollution issues and how they are related to energy use in this article [513] from ABC News Australia, and for some insight into the impact that Covid has had on pollution, read "China’s air pollution has overshot pre-pandemic levels as life begins to return to normal [514]" from the World Economic Forum.
- For a perspective of how members of the new Chinese middle class has been reacting to pollution issues, read "For Some in China's Middle Class, Pollution Is Spurring Action [515]" from NPR.
Energy Policy, Supply and Demand
Three Gorges Dam

Because it is the world's largest hydroelectric installation and the subject of significant controversy, China's Three Gorges Dam warrants specific mention in this lesson. Construction started in 1994. The 600-foot high dam across the Yangtze River was completed in 2006. The reservoir reached full height in 2010, after submerging 13 cities, 140 towns, and 1,350 villages, all in all displacing 1.3 million people. (BBC News, May 2011, China acknowledges Three Gorges dam 'problems' [517])
In 2011, China took the unusual step of admitting there were problems with the project. The New York Times reports, "China’s State Council [518], a coordinating body often likened to the United States president’s cabinet, said in a vague statement that the project suffered from a wide range of serious problems. 'Although the Three Gorges project provides huge comprehensive benefits, urgent problems must be resolved regarding the smooth relocation of residents, ecological protection, and geological disaster prevention,' the statement said." For full story, see New York Times, China Admits Problems with Three Gorges Dam [519], May 2011.
In February of 2014, the US Energy Information Administration reported, "The world's largest hydropower project, the Three Gorges Dam along the Yangtze River, was completed in July 2012 and includes 32 generators with a total maximum capacity of 22.5 GW. The dam's annual average power generation is anticipated to be 84.7 TWh. The Chinese government plans to increase hydro capacity to 325 GW by the end of 2015. However, China has faced some delays on projects resulting from environmental concerns and complications of population displacement" (EIA China Analysis).
However, it appears that the Chinese government is becoming more hesitant to ignore environmental sustainability issues at the expense of hydroelectric infrastructure. In April of 2015 news has slowly leaked out that the government has canceled plans to add hydroelectric dams to the upper reaches of the Yangtze River, as evidenced by the scrapping of the plan to build a large dam in the city of Chongqing. (New York Times, China Blocks Yangtze Dam Project, Activists Say [520]). It is difficult to say for sure, but according to reports from environmentalists in China, the project in Chongqing was canceled due to environmental concerns, including habitat destruction of endangered fish species. This may be an indicator that the government has grown concerned about the environmental impact of their energy infrastructure.
Energy Policy, Supply and Demand
One intention of this course has been to expose you to information resources that may serve you well in future courses and your professional work. Earlier in this lesson, we introduced the United States Central Intelligence Agency publication, The World Fact Book. In this section, we use the international resources from the U.S. Energy Information Administration.
To Read Now
Read the Country Analysis [521] for China from the U.S. Energy Information Administration. (Make sure you are reading the version dated August 2022.)
Read (or scan closely) the following sections (more if you have time, it's very interesting).
-
Overview
-
Petroleum - Trade.
-
Natural Gas - Entire Section
-
Coal - Entire Section
-
Electricity - Entire Section
International Agreements
China was a key player in the COP21 (the "21st Conference of Parties") negotiations in December 2015 which resulted in the Paris Climate Agreement (sometimes called the "Paris Accord"). Both China and the U.S. [522] signed (on Earth Day 2016) and ratified the Paris Climate Agreement. Combined, they emit nearly 40% of the world's carbon emissions. In a role reversal, it is now the Chinese government that is urging the United States [523] to uphold its commitment, as President Donald Trump has withdrawn the U.S. from the agreement (though notably, cities, states, and businesses in the U.S. have stepped up and filled the emissions reductions gap [524] admirably). This is another chapter in the history of China's varying role in global climate agreements.
China is well known as the major global supplier of solar panels. This article from the IEA [525] demonstrates the extent of China's dominance in the global solar supply chain. Not only is China the major solar panel supplier globally, but the solar industry contributes quite a bit to China's overall global trade balance. The U.S. government has recently imposed tariffs [526] on Chinese solar panels and components, in order to support domestic manufacturers. The solar trade war is not going away - the recent Bipartisan Infrastructure Law passed by the U.S. Congress designates "domestic content requirements [527]" for solar panels to be eligible for subsidies and incentives.
Optional Reading
Please read "Changing Climate: What The Paris Accord Means For China [528]" from Law360 to get some context for their role in this, and previous agreements.
Before reading the article, here are some terms that might be helpful to know:
-
Conference of Parties (COP): From the United Nations [529]: "The COP is the supreme decision-making body of the (UNFCCC). All States that are Parties to the Convention are represented at the COP, at which they review the implementation of the Convention and any other legal instruments that the COP adopts and makes decisions necessary to promote the effective implementation of the (UNFCCC)..." The COP has a meeting each year. The Paris Climate Agreement was made at the 21st COP, aka COP21.
-
UNFCCC: United Nations Framework Convention on Climate Change. This is the UN treaty that was signed in 1992 establishing the Conference of Parties (COP) system, thus establishing the organizational foundation for international climate agreements.
-
Non Annex I Party: This is how the Kyoto Protocol referred to "developing" countries that were not bound to emissions targets in the Protocol. Annex I parties, on the other hand, were required to reduce emissions. (There are other differences between the two, but this is the primary one.) China is a non Annex I country.
-
Clean Development Mechanism (CDM): CDMs are international development mechanisms created by the UN to allow Annex I countries to offset their carbon emissions by funding clean energy projects (e.g., wind farms, reforestation, etc.) in non Annex I countries. These have the dual benefit (in theory, anyway) of providing financial and technological assistance for establishing a more sustainable and lower emission energy infrastructure in low-income countries.
In addition, for a perspective on the dynamic interplay between China, the EU, and the U.S. with regards to the solar industry, tariffs, and subsidies (Oh my!) read "China's solar subsidy cuts erode the impact of Trum tariffs [530]" from Nichola Groom of Reuters and "Commission scraps tariffs on Chinese solar panels [531]" by Jorge Valero of Euractiv.
Lesson 11 Assignment
Weekly Activity 11
Please review Canvas calendar for all due dates related to your Nonmarket Analysis Case Study.
Deliverable
Complete "Weekly Activity 11," located in the "Weekly Activities" folder under the Modules tab. The activity may include a variety of question types, such as multiple choice, multiple select, ordering, matching, true/false, and "essay" (in some cases these require independent research and may be quantitative). Be sure to read each question carefully.
Unless specifically instructed otherwise, the answers to all questions come from the material presented in the course lesson. Do NOT go "googling around" to find an answer. To complete the Activity successfully, you will need to read the lesson, and all assigned readings, fully and carefully.
Each week a few questions may involve research beyond the material presented in the course lesson. This "research" requirement will be made clear in the question instructions. Be sure to allow yourself time for this! You will be graded on the correctness and quality of your answers. Make your answers as orderly and clear as possible. Help me understand what you are thinking and include data where relevant. Remember, numbers should ALWAYS be accompanied by units of measure (not "300" but "300 kW"). You must provide ALL calculations/equations to receive full credit - try to "talk me through" how you did the analysis.
This Activity is to be done individually and is to represent YOUR OWN WORK. (See Academic Integrity and Research Ethics [52] for a full description of the College's policy related to Academic Integrity and penalties for violation.)
The Activity is not timed, but does close at 11:59 pm EST on the due date as shown on the Calendar.
If you have questions about the assignment, please post them to the "Questions about EME 444?" Discussion Forum. I am happy to provide clarification and guidance to help you understand the material and questions (really!). Of course, it is best to ask early.
Summary and Final Tasks
In this lesson, you learned...
- key characteristics related to geography, population, and Chinese society;
- about Chinese government and key institutions;
- to describe business models for foreign investment in China;
- about energy markets in China, in terms of supply and demand;
- of China's 12th and 13th Five Year Plan and implications for the energy sector;
- to explain the World Trade Organization and its role in international trade;
- describe what a Clean Development Mechanism is.
Have you completed everything?
You have reached the end of Lesson 11! Double-check the list of requirements on the first page of this lesson to make sure you have completed all of the activities listed there.
12 India
Introduction
Overview of Lesson 12
With this lesson, we will explore India, including the daunting energy challenges facing this rapidly growing economy and the opportunity they present.
What will we learn?
By the end of this lesson, you should be able to...
- identify characteristics related to geography, population, and Indian society;
- explain India economy as it relates to energy;
- quantify extent and impact of energy infrastructure challenges in India;
- describe energy-sector governance in India and opportunity for foreign investment;
- explain energy markets in India, in terms of supply and demand;
- discuss opportunities and plans for addressing energy challenges in India;
- explain microgrids and off-grid advances in India.
What is due for Lesson 12?
The table below provides an overview of the requirements for Lesson 12. For details, please see individual assignments.
Please refer to the Calendar for specific time frames and due dates.
| REQUIREMENT | SUBMITTING YOUR WORK |
|---|---|
| Read Lesson 12 content and any additional assigned material | Not submitted. |
| Weekly Activity 12 | Yes—Complete Activity located in the Modules Tab. |
Republic of India | Bharat Ganarajya
Namaskar, Namaste, Hello
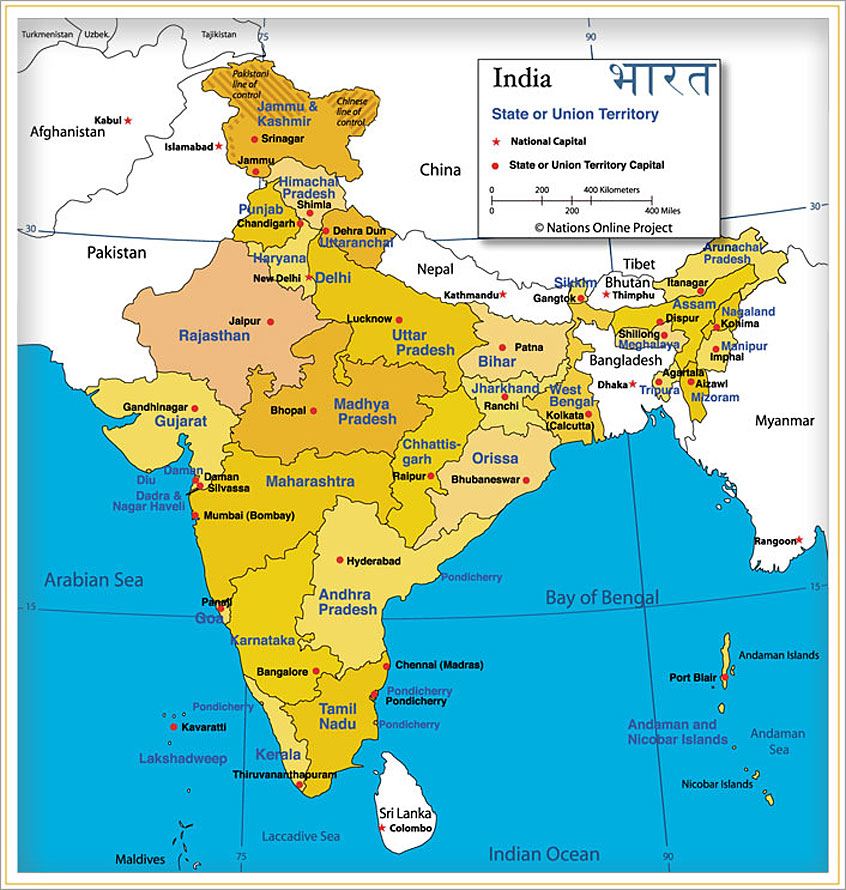
Geography & Population
In area, India is about 1/3 the size of the U.S.A., yet it has almost four times as many people! In terms of population, it is second only to China. Located in southern Asia between the Arabian Sea and the Bay of Bengal, India shares boundaries with Pakistan, China, Nepal, Bhutan, Myanmar, and Bangladesh.
The map above refers to Myanmar, but you will see this country referred to as "Burma" in other readings, including the CIA site used below. The US Department of State [533] explains, "The military government changed the country name to 'Myanmar' in 1989," yet the U.S. government still refers to the country as Burma. This policy is the result of the U.S.'s opposition to the authoritarian rule of the military government, and support for Burmese citizens that have advocated for a more democratic government. (The slow move toward democracy has been a recent development in Burma, but that goes beyond the scope of this lesson. Feel free to consult the Department of State page for more information.) Also, for those of you who may recognize the name "Ceylon," this was the former name of the island country just off the southern tip of India, renamed Sri Lanka in 1972. And importantly, not made clear in the reading below, the official currency [534] of India is the Indian Rupee (INR).
To Read Now
Visit United States Central Intelligence Agency publication, The World Fact Book [504].
- Click "countries" on the top right of the page, t "India." Acquaint yourself with the categories of information presented.
- Read (or scan through) each of the sections to become familiar with the structure and nature of the information available.
Energy Policy, Supply and Demand

The U.S. Energy Information Administration recently updated the profile of India's energy sectors. Please read the sections below.
To Read Now
Visit the U.S. Energy Information Administration [287], under "Geography" select "International," then select India by clicking on it on the map. Find your way to the full analysis of India's Energy Sector Highlights. (Make sure you click on "Read Full Analysis.")
Read (or scan closely) the following sections.
-
Overview
-
Petroleum and other liquids: all sections.
-
Natural Gas: all sections (you can skip Pipeline infrastructure)
-
Coal: all sections
-
Electricity: all sections
In addition, please read through the most up-to-date energy-based CO2 emissions data from the IEA, via the Union of Concerned Scientists.
- "Each Country's Share of CO2 Emissions [536]" by the Union of Concerned Scientists (August 2022)
Domestic Energy Issues
India's Current and Future Challenges in meeting Electricity Demand
The reading below presents an interview produced by the National Bureau of Asian Research for the U.S. Senate India Caucus.
The National Bureau of Asian Research (NBR) is a nonprofit, nonpartisan institution founded more than 20 years ago by a private endowment. NBR's mission is to [537]"conduct advanced independent research on strategic, political, economic, globalization, health, and energy issues affecting U.S. relations with Asia. Drawing upon an extensive network of the world’s leading specialists and leveraging the latest technology, NBR bridges the academic, business, and policy arenas."
NBR disseminates its research through briefings, publications, conferences, Congressional testimony, and email forums, and by collaborating with leading institutions worldwide. NBR also provides exceptional internship opportunities to graduate and undergraduate students for the purposes of attracting and training the next generation of Asia specialists." You'll also find NBR on Facebook [538] and LinkedIn [539].
The U.S Senate defines caucus [540] thus: "From the Algonquian Indian language, a caucus meant 'to meet together.' An informal organization of Members of the House or the Senate, or both, that exists to discuss issues of mutual concern and possibly to perform legislative research and policy planning for its members. There are regional, political or ideological, ethnic, and economic-based caucuses." The Senate India Caucus is a 38-member bipartisan group created in 2004, which serves as a forum to discuss bilateral issues, strengthen US-India commercial ties, and advocate on behalf of the Indian-American community.
To Read Now
Visit the National Bureau of Asian Research and read an article written by Tom Cutler (with Clara Gillespie) entitled "Risi [541]ng to the Challenge of Energy Security."
Cookstoves and International Development
According to the World Health Organization, "an estimated 700 million people in India still rely on solid fuels and traditional cook stoves for domestic cooking." Almost all of them use the traditional cook stove called a "chulha." There are different styles of chulhas in use in India, but the traditional models all share the characteristic of using an open fire without a chimney indoors. As you can imagine, having an open fire inside of a home can (and does) present problems for occupant health! Please watch the first 3:30 of the video below for an idea of how chulhas are used. You are of course welcome to watch the whole (12:49) video, but that is optional.
PRESENTER: Much talk of air pollution focuses on what's happening in cities and around them. Even in villages far away where the known pollutants like vehicles, like the construction, like the big factories, are not seen around. There is a source of pollution, and it is coming out of homes like these. So in this episode we focus on what's cooking inside, what it's doing to our atmosphere, and even impacting climate change.
Blending old world charm with new age technology, Hyderabad has something for everyone.
[MUSIC PLAYING]
[CAR HORN HONKS]
[TRAFFIC NOISE]
Over the past decade, the City of Pearls has marketed itself aggressively as an IT city, attracting people from across the country and IT companies the world over.
But some 50 kilometers away, a burning reality makes 21-year-old Somlata choke and cry every morning and evening. Somlata struggles with the daily ritual as she settles down on the floor in a tiny soot-covered kitchen to light the chulha.
[CONVERSATION IN BACKGROUND]
WOMAN: [NON-ENGLISH SPEECH]
PRESENTER: What happens when you use it?
WOMAN:
PRESENTER: Despite visits to the doctor and medication, the cough and chest pain wrack her. Somlata's mother faced the same problem before her. The family of 10 depends on agriculture to make a living. The men till government land to grow chilis, cotton, and rice. On their way home, they pick up wood from a forest. Somlata stacks the sticks in the kitchen and uses them as firewood. The activity costs her her health, not to mention, it jeopardizes the safety of her whole family.
DR. SANDHYA: [? Belia ?] and [? Konta ?] are about 10% of the population, like quarter of the census we have [INAUDIBLE]. We be suffering from one or the other signs of respiratory infection. They'll start from a mild sign, just an uneasiness. In some of us actually, such an accidents mostly there, because everything that was really dry.
We are from a developing country. We can't just go like everybody will have a [INAUDIBLE] house. So the [INAUDIBLE] and all, they'll be getting fired. They'll be catching fire and major accident [INAUDIBLE].
PRESENTER: We have found the co-relation to be how much [INAUDIBLE].
The family is part of a study of 29 villages in Telangana, focusing on chronic diseases and the causes within homes. The study is being conducted by the London School of Hygiene and Tropical Medicine.
SANTHI BHOGADI: Mostly like for the last seven years, we have been exclusively looking at child development and their problems leading to cardiovascular diseases. Now we have moved on to looking at the air pollution impacts on their health. So we are looking at the post-natal exposure.
PRESENTER: So what is the level of awareness among people here?
SANTHI BHOGADI: People I guess in the rural villages is only like the 40% of people who might be having the LPG. And like 20% are aware that they know [INAUDIBLE] is available and could not afford for that. And that is 20% of the people that don't even know that some facility, kind of a better fuel system, is available for cooking.
PRESENTER: Using biomass as fuel impacts not just health, it's the single biggest source of air pollution in rural India. Biomass refers to any organic matter, such as wood, agriculture, waste, or even animal dung. While it's cheap, it releases large quantities of smoke and particulate matter that impact both human health and the environment.
According to the government of India's 2011 census, an estimated $142 million rural homes-- that's almost 85% of total rural households-- depend on traditional biomass fuel for cooking. 45% of total rural households do not have electricity. They use wood and kerosene to light up homes.
This makes India the largest consumer of firewood and biomass. Greenhouse gases emitted by such fuel, along with other sources of pollutants, add up to gigantic proportions, making India the third largest carbon emitter in the world after the United States and China. According to the World Health Organization, 4.3 million deaths occur globally from indoor air pollution each year.
China accounts for nearly 1.5 million deaths and India close to 1.3 million deaths every year, due to smoke from cooking, heating, and lighting activities.
BRIAN SMITH: There's a lot of attention on HIV/AIDS, malaria, family planning, and very little on this issue. In fact, globally there are-- the WHO estimates that there are over 4 million deaths annually attributable to household air pollution. So that's actually more than HIV and malaria combined.
PRESENTER: But LPG connections don't come easy in villages like Tamapur. Few houses approved by the [INAUDIBLE] have one. Others like Sumalata's family are still awaiting a connection.
[HORN]
But in neighboring Rachalut village, a woman, Sapunch, has made all the difference. Of the 1,000 homes here, 90% have an LPG connection. She approached a local [INAUDIBLE] after she suffered health issues due to continued use of the chulla.
SAPUNCH: [NON-ENGLISH SPEECH]
PRESENTER: As for the 2011 census, LPG penetration in rural India is only around 13%. While 50% households in the country own televisions, only 28% in both rural and urban India have LPG access. But where there's availability, affordability plays a key role in rural India. Wood is often free and a gas cylinder comes at a price.
Though Bala has had an LPG connection for 22 years now, she still prefers using the chulla despite the fumes, the smoke, and the heat.
BALA: [NON-ENGLISH SPEECH]
PRESENTER: [NON-ENGLISH SPEECH]
BALA: [NON-ENGLISH SPEECH]
PRESENTER: [NON-ENGLISH SPEECH]
BALA: [NON-ENGLISH SPEECH]
PRESENTER: [NON-ENGLISH SPEECH]
BALA: [NON-ENGLISH SPEECH]
PRESENTER: It's this mindset that field workers like Krishna find hard to change, whether it's in Telangana or Hariana. Bala, who does not know how old she is, has little knowledge of what the smoke can do to her and her children's health, apart from the cough and burning of eyes, let alone the impact of the air she breaths.
NOULEHARIKRISHNA: [INAUDIBLE], many, many people are dying. And we don't know what is the reason behind that. So first we thought there is a lack of supplementation, lack of food, water. So we succeeded in that manner. Even though the people are dying, here the pollution is a major role in their life.
So in this 28, 29 years, most of the people like, we see the ratios lagging. So some 32, 72/38 ratio. The most of the people are cooking on the wood itself. Even if we are trying, don't opt for this cook. They are saying it is our tradition, so how can we change like that?
We are saying that it is harmful for you. And they are saying that, oh, no, no. We are traditionally following the things.
PRESENTER: The doctor at a tiny private clinic near the village says 40% of the villagers come to him with respiratory problems. [NON-ENGLISH SPEECH]
MOHAN SINGH: [NON-ENGLISH SPEECH].
PRESENTER: Breathing problems aside, studies also link air pollution to stillbirths. A WHO report based on a study found that consistent exposure to solid fuel smoke can cause low birth weight and stillbirths. The study concludes saying that although the body of evidence is still relatively small, the findings are consistent with studies on exposure to outdoor pollution.
To View Now
Indoor air pollution is a major problem in India, particularly in rural househoulds that use traditional cooking methods as indicated above. However, the solutions are not always so simple. Read the following article about some of the problems that have arisen, even with the best of intentions in international efforts:
- "The fruitless quest to save Indian women from slowly choking to death [542]", Quartz, December 2018 (If you are locked out, you can access a .pdf here [543].)
Air pollution is not limited to rural areas. In fact, India has some of the most air-polluted cities in the world. Read the following article to get a sense of the level of pollution endured by many Indians:
- "A silent killer is choking India's capital. For millions, there's no choice but to breathe it in [544]" from CNN, November 2021.
Advances in Off-Grid Development
As indicated by the IEA and Tom Cutler above, lack of access to electricity is a major issue in India, particularly in rural areas. But as you'll see in the video below, energy security requires more than simply having electric service is not always enough. Please watch the (6:00) video below for an eye-opening look at what many Indian residents must deal with. This is a video by The Council on Energy, Environment, and Water [545], a non-profit in Southeast Asia. In 2015 they released a report called Access to Clean Cooking Energy and Electricity: Survey of States [546], which is based on a recent survey of six Indian States with the intent of determining the (lack of) access to - you guessed it - clean cooking energy and electricity. You are welcome to read the report, but it is not required.
NARRATOR: Energy access has many facets. It goes beyond having an electricity or an LPG connection. Households care about hours of supply, reliability, quality, affordability, and even the legal status of their electricity connection. Similarly, households make choices for cooking energy based on the mix of fuels available, their cost, and the convenience of use.
To understand the true picture of energy access in rural India and issues with diverse attributes, the Council on Energy, Environment, and Water, and the Department of Political Science Columbia University conducted the largest survey of its kind in India. The study spanned six states, covering 51 districts, 714 villages, and almost 8,600 households, spending a year's worth of time on the ground, and collecting more than 2.5 million data points.
Having energy access is not a simple yes or no answer. Variations in availability, quality, convenience, or affordability mean that each household could progress or regress along several stages of electricity or cooking energy access. We call these stages tiers.
The results from our survey indicate that a majority of households remain in the bottom-most tier for electricity access, and the picture when he works when we look at cooking energy access.
Of all the electrified households in Bihar, 64% still use kerosene as the primary lighting source. Only 11% of the households who use the [INAUDIBLE] suggest they find it convenient and easy to use. CEW's research helps to identify the nuances and bottlenecks which hinder access to modern energy. This is the first step. We hope to continue such service, and help prioritize actions for improved energy access and fulfill millions of aspirations.
SPEAKER 1: [SPEAKING HINDI]
SPEAKER 2: Actor.
SPEAKER 3: Cricketer.
SPEAKER 4: Doctor.
SPEAKER 5: Army.
SPEAKER 6: Dancer.
SPEAKER 7: [SPEAKING HINDI]
To Read Now
Please read the following for some additional perspective on India's domestic electricity policies and issues.
- From The Economic Times, read "How Indian solar tariffs delay Modi's renewable goals [549]."
- From Forbes, read the "U.S.-India Energy Partnership, With $1 Trillion At Stake, Expected To Grow After Modi Win [550]" for India.
- From the IEEE Spectrum, read "Innovative Direct-Current Microgrids to Solve India's Power Woes [551]."
Lesson 12 Assignment
Weekly Activity 12
Please review Canvas calendar for all due dates related to your Nonmarket Analysis Case Study.
Deliverable
Complete "Weekly Activity 12," located in the "Weekly Activities" folder under the Modules tab in Canvas. The activity may include a variety of question types, such as multiple choice, multiple select, ordering, matching, true/false, and "essay" (in some cases these require independent research and may be quantitative). Be sure to read each question carefully.
Unless specifically instructed otherwise, the answers to all questions come from the material presented in the course lesson. Do NOT go "googling around" to find an answer. To complete the Activity successfully, you will need to read the lesson, and all assigned readings, fully and carefully.
Each week, a few questions may involve research beyond the material presented in the course lesson. This "research" requirement will be made clear in the question instructions. Be sure to allow yourself time for this! You will be graded on the correctness and quality of your answers. Make your answers as orderly and clear as possible. Help me understand what you are thinking and include data where relevant. Remember, numbers should ALWAYS be accompanied by units of measure (not "300" but "300 kW"). You must provide ALL calculations/equations to receive full credit - try to "talk me through" how you did the analysis.
This Activity is to be done individually and is to represent YOUR OWN WORK. (See Academic Integrity and Research Ethics [52] for a full description of the College's policy related to Academic Integrity and penalties for violation.)
The Activity is not timed, but does close at 11:59 pm EST on the due date, as shown in Canvas.
If you have questions about the assignment, please post them to the "Questions about EME 444?" Discussion Forum. I am happy to provide clarification and guidance to help you understand the material and questions (really!). Of course, it is best to ask early.
Summary and Final Tasks
In this lesson, you learned...
- key characteristics related to geography, population, and Indian society;
- about the Indian economy as it relates to energy;
- the extent and impact of energy infrastructure challenges in India;
- about energy-sector governance in India and opportunity for foreign investment;
- to explain energy markets in India, in terms of supply and demand;
- about opportunities and plans for addressing energy challenges in India;
- about off-grid applications India, including microgrids and solar lanterns/charging stations.
Have you completed everything?
You have reached the end of Lesson 12! Double-check the list of requirements on the first page of this lesson to make sure you have completed all the activities listed there.
Case Study
Introduction
Case Study Overview
This is a Nonmarket Analysis Case Study completed as a Team Project, with a few assignments that are to be done individually. All due dates will be posted in the Canvas calendar.
Case Study Issues for Current Semester
On the following page, you will find a list of Case Study Issues for the current semester. Each topic is phrased as an issue appropriate for nonmarket analysis and is accompanied by several general references to help you become acquainted with the issue.
Case Study Team Project
The Case Study is a TEAM project with three parts. Each part is submitted via drop boxes or discussion forums in Canvas.
Detailed guidelines for each part of your Nonmarket Analysis Case Study will be provided. Your Team will receive one grade for each part of the Case Study. These grades will not be posted to the grade book.
After all parts of the Case Study are complete, each member of the team will complete a team assessment survey of individual contributions by each team member (see below).
Your Team will be given one total Case Study score. Individual scores for the Case Study will be calculated as:
- Team Score x Team Assessment of Contribution.
Depending on your level of contribution to the Case Study, your individual score may be the same as the Team Score, or it may be lower or higher (not to exceed 100 points).
Team Assessment of Contribution
This is a survey, completed INDIVIDUALLY.
In this survey, you will provide feedback on the contributions of other members of your team to this project. This is to encourage all team members to work together and contribute fully to this project. Each student's final score on this team project is calculated as:
- Team Score x Team Assessment of Contribution
Depending on the Team's assessment of your level of contribution to the Case Study, your individual score may be the same as the Team Score, or it may be lower, or it may be higher (not to exceed 100 points).
You will find the “Team Assessment of Contribution” survey under the Modules tab. You'll be asked to assess the contributions of other Team members to this group project. When considering the contributions of each team member, please include these factors: level of engagement, timeliness of work, quality of work, and integrity of work (correct and complete source citations). For each Team member, your options are:
- this is me
- did not contribute (0%)
- did very little to contribute (50%)
- did far less than fair share (80%)
- did less than fair share (90%)
- did around fair share (100%)
- did more than fair share (110%)
- did MUCH more than fair share (120%)
Case Study Q & A (Discussion Forum)
These are Discussion Forums, graded INDIVIDUALLY.
Near the end of the semester, each Case Study will be presented in a Q&A Discussion Forum. Each student is required to participate by commenting on the uploaded presentations. Comments will be graded on an individual basis.
Case Study Options
Please note that the list of resources provided here is not meant to be comprehensive. You are encouraged to research these issues on your own as well.
1. Do you support or oppose allowing state-subsidized power plants to participate in regional electricity markets without price controls?
(Note: This topic concerns a policy in electricity markets known as the "minimum offer price rule" or MOPR. The idea behind MOPR is that if renewable energy plants are highly subsidized by governments, but compete with conventional power plants in electricity markets, the government subsidy gives renewable power plants an unfair competitive advantage in the electricity market because the subsidy makes the renewable power plants look cheaper than they actually are. MOPR is a rule that forces a price floor on subsidized power plants in competitive electricity markets.)
- The MOPR Merry Go Round [552]
(Power Magazine, March 2022) - Understanding FERC's 'Minimum Offer Price Rule' [553]
(Advanced Energy Economy, 2019) - What the Minimum Offer Price Rule Means for Clean Energy Resources [554]
(Resources Magazine, 2020) - FERC Orders PJM to Restrict State-Backed Renewables [555]
(Greentech Media, December 2019)
2. Is the Biden Administration correct to increase the Social Cost of Carbon to $51/ton or should it have been kept at a lower level set by the Trump Administration?
- The Biden Administration Weighs the Social Cost of Carbon [556]
(Wired, March 2021) - Here's the Deal: Could the Social Cost of Carbon Become a Key Component of Biden's Climate Strategy? [557]
(Davis Wright Tremaine, LLP, April 2021) - The Supreme Court Okayed Biden's Social Cost of Carbon [558]
(Vox, March 2022) - A Carbon Calculation: How Many Deaths Do Emissions Cause? [559]
(New York Times, July 2021)
3. Do you support or oppose California's initiative to ban the sales of new gasoline-fueled cars by 2035?
- California Moves to Accelerate 100% New Zero Emission Vehicle Sales [560]
(California Air Resources Board, August 2022) - Sapping California's Energy Future [561]
(Pacific Resources Institute, June 2023) - Truckers are Caught on the Front Line of California's EV Push [562]
(Wired, May 2023) - California E.V. Mandate Finds a Receptive Auto Industry [563]
(New York Times, August 2022)
4. Do you support or Oppose H.R. 1019 (the E-BIKE Act)?
- 2021 H.R.1019 - E-BIKE Act [564]
(U.S. House of Representatives, February 2021) - 2023 H.R.1019 - E-BIKE Act [565]
(U.S. House of Representatives, March 2023) - The E-BIKE Act is Back and Better Than Ever [566]
(The Verge, March 2023)
5. Would you support or oppose legislation that requires legislative approval for Pennsylvania to enter into a cap-and-trade program (such as the Regional Greenhouse Gas Initiative, or RGGI), as HB 2025 of 2020 does?
- BOARD APPROVES RGGI RULE, MOVING PA. A STEP CLOSER TO JOINING CARBON EMISSIONS PROGRAM [567]
(The Allegheny Front, July 2021) - BILL TO KEEP PA. OUT OF REGIONAL CAP-AND-TRADE PROGRAM PASSES, FACES GOVERNOR’S VETO [568]
(The Allegheny Front, September 2020) - So Pennsylvania Might Join RGGI. What Comes Next? [569]
(PennFuture, October 2019) - The Regional Greenhouse Gas Initiative [570]
(RGGI, 2020) - Gov. Wolf Signs Executive Order on Greenhouse Gas, But Legal and Policy Questions Still Exist [571]
(Juris Magazine, November 2019)
6. Do you support or oppose permitting of the Thacker Pass lithium mine in Nevada?
- Thacker Pass Mine Project [572]
(Nevada Department of Environmental Protection, 2022) - Plans To Dig the Biggest Lithium Mine in the US Face Mounting Opposition [573]
(Inside Climate News, 2021) - How We Survive: White Gold [574]
(Marketplace, 2021 - this is the first episode of an eight-episode podcast series on lithium mining with a focus on the Thacker Pass mine; the entire series is very well done and worth listening to)
7. Do you support or oppose the domestic content requirements for renewable energy projects (wind and solar) to earn large tax credits under the Inflation Reduction Act?
- Energy Tax Credits, Meant to Boost US Suppliers, May Be Hard to Get [575]
(New York Times, January 2023) - Inflation Reduction Act: New Guidance on Domestic Content Bonus Credits [576]
(Shearman and Sterling, May 2023)
Case Study Team Project Assignment Descriptions
The Case Study Nonmarket Analysis Team Project consists of three parts submitted individually. Parts I and II are written documents, which may include figures, tables, and graphics. Part III is a slide presentation. Please see Canvas calendar for due dates.
Guidelines for individual Parts of the Case Study are provided below. The following important guidelines apply to all Parts--
Please remember that all parts of this Case Study project must be formatted using APA style, with the exception that you do NOT need an abstract. APA requires in-text citation, which means you have to place a citation in the text of the document next to any information that you gathered from an outside source. Think of it this way: If you did not know the information before you put it in the document, you should cite it. Penn State has an APA guide here [577], but Purdue University as a more comprehensive one here [578].
- Audience
Parts I and II of the Case Study are prepared for a general audience. Assume the reader has no prior background on the topic. As you will see, Part III is a presentation that is designed to be delivered to a stakeholder. When creating Part III keep that in mind. - Organization
Use subheads, paragraphs, bulleted lists, and other defining features to organize each Part of your case study clearly and orderly. This will help your team be sure that all bases are covered and will help the audience understand the points you are making. Format all structural features (e.g., subheads, lists) consistently. Be sure that all figures, graphs, and tables are clearly labeled and referenced. - Attribution
For each part of this assignment, you must clearly indicate which team member(s) worked on which section(s). This is very important, and must be done! You can use "comments" (tool available in Word and PowerPoint) or some other method, as long as it is clear. - Overall Presentation
Write in a professional tone (not in the first person). Format Parts I and II consistently. Use page numbers. Give your Case Study a short title and include it on all pages and slides (in footer or header). For all Parts (I, II, and III) include a title page/slide with your Case Study title, course name, date, and names of all Team members. Carefully spell check, grammar check, and proofread each Part before submitting. - References
All sources MUST be cited. Please review the Academic Integrity Guide [579] (link also in Resources menu) for guidelines and formatting methods. Include a properly formatted and organized list of References with each Part of your Case Study. Use APA formatting. - Submitting the Assignments
Please note that there are two due dates for each submission (Parts I, II, and III). The first due date is for individual team members to submit to a team leader. All individual contributions must be submitted at this time to the team leader. As you will see, they will also be submitted on Canvas. A team leader (or leaders) must be selected for each Part. I suggest rotating among group members, but the same person can act as leader for multiple Parts. If you do not submit on time, you will not receive credit for that portion of the assignment. This must be done in order to provide the team leader time to integrate the individual submissions together, check spelling and grammar, and so forth. The second due date is when the full assignment is due. For each Part, you will submit a single document as a group by this second due date. Revisions may be made after the individual submissions are given but before the final group submission is made.
All Parts of all Team Case Studies will be shared with others in this course and will be the subject of Case Study Q & A Discussion Forums. This will happen near the end of the term after all Case Studies are complete.
Part I. Background and Status
(For example, see RPS Case Study, Lesson 1, “Background and Status”)
Research and collect background on your Case Study Issue. Document key terms and concepts, historical context, current status, and the overall timeline of relevant past events and upcoming ones (if known). Clearly explain what the issue is about! Use data, graphs, pictures, and tables as needed to describe the issue. You are NOT taking a side on the issue (yet)! Provide an objective analysis of the issue.
Format Part I as a Word (.doc or .docx) file and upload to Canvas using the link to "Case Study Part I. Background and Status." This is under the Case Study Assignments subheading in the Modules tab. Don't forget to submit your individual contribution on the first due date!
You must identify who worked on each section. You can just insert comment boxes or indicate who wrote the section by putting the student's name next to the section title/header (as long as it is clear who did each section).
Note that all sources must be cited, and direct quotes must be indicated. I use a software that will clearly indicate any material that is plagiarized. I will be very strict about this, and take academic dishonesty very seriously.
Part II. Stakeholders and Nonmarket Analysis Summary Framework
(For example, see RPS Case Study, Lesson 2, “Stakeholder and Nonmarket Analysis Summary Framework”)
Identify stakeholders (firms, associations, groups, or individuals) that have an interest in the outcome of your team’s Issue. Each team member must analyze one stakeholder. Your stakeholder list MUST represents a balance of different positions on the Issue. You need to have at least two that support and two that oppose the issue.
Use the RPS Case Study Part II as a model. For each stakeholder, provide name, type of organization, and its mission. Establish stakeholder’s initial position on the issue and explain the basis for this position.
For each stakeholder, continue the analysis with an orderly presentation of all variables related to demand and supply of nonmarket action.
To evaluate demand for nonmarket action, assess available substitutes, aggregate benefits, and per capita benefits. To evaluate supply of nonmarket activities, assess effectiveness (numbers, coverage, and resources) and cost of organizing. Provide specific justifications for the supply/demand scale item that you use.
To make these assessments, you’ll need to establish a scale for each variable. You can use the one in the RPS case study (for example, benefits are “small”, “moderate”, “considerable”, “large” or “substantial”) or design your own. Either way, include the scale you are using in your case study.
In all cases, be sure to give some reasoning that supports the value you have assigned. E.g. if you indicate that “coverage” is “extensive,” explain why you believe this to be true.
Now you are ready to predict the likelihood of the stakeholder taking nonmarket action. To do this, review the information you have collected to this point. For each stakeholder, weigh the demand for taking action against the supply of action. The greater the demand, the more likelihood of taking action. The greater the cost (considering available resources), the less likelihood of taking action. You’ll need to establish a scale for this too. You can use the one from the RPS case study or establish your own. Either way, be sure to include it.
Finally, summarize all of your findings into a Nonmarket Analysis Summary Framework. You’ll find an Excel template for the Nonmarket Analysis Summary Framework in the “Team Project/Case Study Info” folder under the Modules tab. Be sure to group stakeholders based on their position on the issue. Integrate the Excel Summary Framework into your Part II document.
You must identify who worked on each section. You can just insert comment boxes or provide a list of who worked on what.
Again, you are not taking sides on this issue. You must include two stakeholders that support and two stakeholders that oppose the issue.
Format Part II as a Word (.doc or .docx) file and upload to Canvas ("Case Study Part II. Stakeholders and Framework"). Don't forget to submit your individual submission by the first due date!
Part III. Strategy and Recommendations
Parts I and II of the Case Study didn't "pick sides." Part I framed the issue (Background and Status). Part II identified key stakeholders on all sides of the issue and gave a basis for their positions.
In Part III, your Team WILL take sides. As a Team, select one of your stakeholders and assume you are making nonmarket strategic recommendations to that stakeholder. Clearly identify the stakeholder to whom your presentation is submitted.
Imagine that your Team has been invited to make recommendations to this stakeholder. You've been asked to prepare and submit a presentation of no more than 20 slides. The presentation needs to stand on its own (you can include limited notes in the Notes section of PowerPoint if desired). It will be submitted electronically and shared with others, without your being there.
Present your Team's nonmarket strategy recommendations with as much detail as possible. If your issue will be handled in a government arena, consider appropriate public politics strategies. If your issue is not being addressed in a government arena, consider appropriate private politics strategies. Or some of both. Include specifics; be imaginative!
You must identify who worked on each section. You can just insert comment boxes or provide a list or put names in the notes section of the PowerPoint.
Organize your strategy and recommendations carefully. Be sure that what you are suggesting and why will be clear to your stakeholder. But, do not pack your slides with words and data. Be creative and succinct. Feel free to write limited narrative in the slide notes at the bottom of the page, but please keep the slides themselves relatively uncluttered.
The RPS Case Study “Strategy and Recommendations" in Lesson 3 gives an example of a nonmarket strategy that you may find to be a helpful reference. It is not, however, in a presentation (slide) format as required for Part III of your Team's Case Study.
Format Part III as a PowerPoint Presentation (.ppt or .pptx) file and upload to Canvas ("Case Study Part III. Strategy and Recommendations"). Individual submissions must be made by the due date.
Case Study Assignment Components and Grading
INDIVIDUAL Case Study Assignments
Case Study Issue Interest Survey
You will find the “Case Study Issue Interest Survey" under the Case Study Assignments sub heading in the Modules tab. All students should complete the survey.
Case Study Individual Submissions for Part I, II, and III
As noted in the Case Study description, you must submit your individual contribution to each Case Study assignment prior to when the full group assignment is due. This is required in order to provide the team leader time to integrate the assignments together. All due dates are on the Course Calendars.
Team Assessment of Contribution
You will find the “Team Assessment of Contribution” survey under the Modules tab. Not graded, but all students are required to complete the survey. (The individual case study final grade will be penalized 1 point for late, incomplete or missing survey results.)
Case Study Q & A
Case Studies will be presented in the Q&A Discussion Forum. Each student will participate in the Discussion forum by leaving comments. Participation will be graded on an individual basis.
TEAM Case Study Assignments
The Team will receive one grade for Parts I and III of the Case Study. Part II will be graded individually. These grades will not be posted to the grade book.
After all parts of the Case Study are submitted, the Team will be given one total Case Study score. Each Part is weighted equally.
Scoring for each Part of the Case Study is based on:
- Content
- Visuals
- Mechanics (including on-time submission of individual assignments)
- Sources
All sources and references MUST be identified and properly referenced. Failure to do so can result in a failing grade and other possible sanctions. See College of Earth, Mineral and Sciences Academic Integrity and Research Ethics [52].
After all parts of the Case Study are submitted, each member of the team will complete a team assessment survey of individual contributions by each team member, including themselves. At the discretion of the instructor, the team assessments may result in an adjustment of your case study grade up or down from the grade that is calculated for the team. Any student whose grade is adjusted because of the team assessment will receive a written explanation from the instructor.
The Team Case Study is worth 30% of your course grade.
If you have questions, please post to the "Questions about EME 444?" Discussion Forum. I'll be happy to help you!