Lesson 11 - Regulation and Deregulation in the Electric Industry
Lesson 11 Overview
Overview
The regulated electric utility model served the industry and U.S. consumers well for nearly a century. Costs and prices fell nearly continuously, and service expanded to nearly every corner of the U.S. While other countries experimented with their own regulatory systems, for the most part, these involved national electric utilities, not the regulated private enterprises found in the United States.
Beginning in the 1970s, the trend of falling prices suddenly reversed, and the decades of technological progress in power generation slowed. The rapid pace of technological advance had masked some fundamental problems with the way in which electric utilities were regulated. Dissatisfaction among electricity consumers grew, paving the way for the grand experiments in electricity deregulation and restructuring that continue to this day. This lesson and the following lesson will provide an in-depth discussion of how these new markets are structured and will describe some fundamental changes in how the price of electricity is determined. The basic market concepts will be discussed in this lesson, while the next lesson will examine how these markets are changing in response to the emergence of large-scale renewable power generation.
Learning Outcomes
By the end of this lesson, you should be able to:
- Discuss topics related to regulation and deregulation in the electricity industry
- Explain which segments of the electricity industry have been “deregulated” and which have been “restructured”
- Explain what a Regional Transmission Organization is, and how it is different from an electric utility
- Calculate the “system marginal price” for a pool-type electricity market
- Calculate “locational marginal prices” in a simple two-node electricity system with congested transmission lines
Reading Materials
- The National Energy Technology Laboratory has created a nice series of primers on each of the regional electricity markets in the United States. You can download the ZIP file here: NETL series of primers [1].
- Lessons Learned from Electricity Market Liberalization [2], by Paul Joskow (2008) in the Energy Journal. This paper has some descriptions of electricity deregulation efforts throughout the world.
- Measuring the Benefits and Costs of Regional Electric Grid Integration [3], by Seth Blumsack (2007) in the Energy Law Journal. The first couple of sections of the paper contain an overview of electricity restructuring in the U.S.
-
Interview with Trevor Lauer
Please watch the following video interview (32:44). If this video is slow to load here on this page, you can always access it and all course videos in the Media Gallery in Canvas.
Video interview with Trevor Lauer (32:44).Click here for transcript of Trevor Lauer interviewMARK KLEINGINNA: Hi everybody. This is Mark Kleinginna, your professor for EME 801. And today I have the honor to talk with an old colleague and friend of mine and a Penn State graduate by the name of Trevor Lauer. I'm going to not try to mess up what you're doing right now, Trevor, and allow you to talk a little bit about your background and just first of all, really express my appreciation for your time today because because I know it's valuable. Tell us a little bit about yourself and from an educational perspective and your professional experience and that kind of thing.
TREVOR LAUER: Yeah, thanks Mark. And it is great to see you again. Undergraduate degree at Penn State, loved my time at the College of Earth and Mineral Sciences. I'm a mineral economics undergrad, a very proud mineral economics undergrad. And then once I got my graduate degree, I did at the University of Maryland. And I got an MBA at the University of Maryland a couple of years after I worked and then got my MBA while I was working. My wife and I now live in Michigan. We live in Bloomfield Hills, Michigan, just north of the city of Detroit. I've got two boys, they both happen to be at Penn State right now. It makes me even a more proud stat. I've got one son in the computer engineering program and another one in the chemical engineering program. I'm a very proud Penn Stater. Currently, my job right now is I'm President and Chief Operating Officer of DTE Energy and my specific job is leading the electric utility, which includes everything from our nuclear generation to our renewable generation, renewable development, energy efficiency, safety, environmental regulatory affairs, a whole host of different activities here at the utility. And I've been with DTE now since 2005. Maybe one last thing, Mark, and you know some of this but for your students, I started my career with Honeywell in the Washington DC. Area. I was in Honeywell and then I was fortunate enough when I got my MBA to be part of three start-up energy businesses. Mark you and I met at the last one of those, which was one of the true joys of my absolute life at Strategic Energy. And I've now been here for 18 years, so been a great run.
MARK KLEINGINNA: Great. How did you end up in the energy business Trevor?
TREVOR LAUER: That's a great question. When I graduated from college Mark, you didn't choose where you wanted to live. When you got a job offer, you were so honored that somebody who was willing to actually pay you that you took the job. And it seems silly when I say that, but Honeywell was the first person that offered me a job when I was graduating from Penn State. And I was honored and I wanted to be in the DC area because there was a big group of Penn Staters. But the real attraction to energy was the more I got involved in the energy efficiency side of the business with Honeywell, the more I recognize the absolute importance of energy and the energy markets. Not only to residential customers, but to all businesses across the United States. This is a macro and micro economic issue. When you think about the way energy affects consumers and businesses, I was very attracted to that as a business platform. And then when we got into the individual proprietor, owning businesses, I realized pretty quickly that you didn't have to be super successful in the energy markets to have a pretty big business. You only need to be really incrementally successful because there's so many transactions in the energy markets are so large and fluid. It's just been a fascination of mine ever since I was at Penn State.
MARK KLEINGINNA: Excellent. So what do you currently do at DTE?
TREVOR LAUER: Yeah, sometimes I ask myself that same question, but I lead the biggest business unit here, we have about 6,000 employees that fall underneath my business unit, and it varies from our energy generation. We own a 1,200 Megawatt nuclear power plant. Our fermi nuclear power plant. We own 10,000 Megawatts of coal and natural gas fired generation. We just built the newest combined natural gas plant that was constructed and brought up in the United States. And then currently we own about 3 Gw, or 3,000 Mw of renewable generation, wind and solar. I also oversee our distribution system. We've got one of the largest electric distribution systems. And we're undergoing a rapid transformation of our electric distribution system. Not only for reliability sake, but also because of the penetration of electrification, electric electric vehicles. We have another group that works on electrification. I've got a renewable development team that's got 109 renewable development projects in some phase of development. We've got an energy efficiency team here that saves our customers about 250, $300,000,000, a year helping them be more efficient in their businesses. I'd say everything that surrounds the electric utility and then a lot of the regulatory and legislative issues that go with it. Yeah, we'll come back to some of that as we walk through this, but I know the students will be particularly interested in the renewable piece and talking about what maybe your portfolio is there and how that gets developed, as well as the integration issues that you've got. On the distribution side, obviously there were loads coming along with electrification of Transportation. But then at the same time, how to handle even solar that comes into the distribution system off people's roofs and commercials and things like that. We'll come back to that a little bit. We can go there. This is always very important. And I worked for utility a long, long time ago. But the thing, it was always, always stressed, first and foremost, was safety and reliability.
MARK KLEINGINNA: Can you talk a little bit about that with respect to how that works at a utility? It's quite different from what we might have done, a strategic energy or what we might have do as a consultant and how important that is, the distribution utility itself.
TREVOR LAUER: Yeah, thank you, Mark, for that. I can't begin to stress how important safety is and how much we talk about it at the utility. We start every day with safety briefs. We have pre-job briefs at every single construction site you're working on. And then you end your day talking about how you did with safety. And why do you do it? Well, the voltages that we operate, the distribution in the sub-transmission system are not ones that you can make a mistake with. If you make a mistake in our business, the chances are that you will die or you will cause somebody else to lose their life. It's really sad. We lost one of our employees in March of this year. In the electric utility, my substation, electrical, mechanical journeyman. There was a human performance error and he lost his life. Those are the worst days you could possibly have when you have to meet with somebody's family and spouse. And this was a gentleman that had worked for us for 28 years, was experienced, knew what he was doing. But the Swiss cheese, as we talk about with human performance all lined up one day and a mistake happened. We talk about safety a lot. We look at OSHA recordable injuries. We want to understand precursors to work to make sure that people are doing the right work. They're stretching. People laugh, But we encourage our people to stretch. In the morning, we ask our supervisors to get all the people in the field to stretch with them so that you can avoid injuries. We're really proud of our safety record here at DTE. We're in top decile safety, but there's a very little correlation between fatalities and top decile regular injuries. We're digging in really hard on the things -- we call it our sticky campaign, or the stuff that can kill you, and we're trying really hard to get our employees to pay attention when you're in a job with high energy enclosed spaces, lifting heavy loads and rigging. These are the times when you're in a sticky area or stuff that can kill you. We need to bring their attention focused on it.
MARK KLEINGINNA: All right. Great. Now, thank you for that. It's so important that folks understand that we do pay a very lot of attention to safety, not just from a workers standpoint, but from the folks in the field as, as the customers as well. Talk a little bit as - I went to over safety - but talk a little bit about reliability as an electric utility and exactly what that means and how safety and reliability are different. And when you and I talk about reliability, we mean something by that so our students can understand what that means.
TREVOR LAUER: Yes, reliability, we measure it really two different ways. But I tend to think of distribution reliability or making sure the lights stay on. Reliability is measured two ways. We measure safety or the frequency of outages. And then we talk about Kd, and that's the duration of outages. Here at DTE, we're pretty good at safety. We don't have a lot of outages. We're in the second quartile. We can obviously get better. We need to continue to get better, right? But we need to dramatically improve what I call Kd, or our duration. So we're in the process right now of adding automated devices, or these devices, we call them reclosers, all over our system so that from our systems operation center, if there's a fault on the distribution circuit, you can reroute power using these intelligent devices, and you can get 50 to 60% of your customers back into power without ever having a truck rolled out into the field. It also helps you identify exactly where the outage could be. A tree branch came down and came across two phases, you had a breaker open... . We can identify that a lot better with all these automated devices. So here's the other thing. I'd say mark reliability is probably the thing that customers notice the most about their distribution utility, right? Nobody wants to pay our bill. I get it. Nobody wants to pay any bill. But when your power goes out, now you're just flat-out mad. You don't think about your distribution utility. You expect perfect power, and our power is Six Sigma. We offer Six Sigma service. But when you lose it, even if it's for only 2 hours, you're really mad. And now it's a pandemic when people are working from home. Momentary outages? Momentary outages are classified as an outage less than 5 min. It may not mean a lot to the electric utility if you're sitting in my seat. But if I'm at home and I'm working on an important research paper and I don't have it saved, and all of a sudden I lose power and I lose everything for that 1 min outage, again, I'm pretty upset with my electric utilities. So again, reliability of the distribution system is a really big deal and we spend a lot of time talking about it. We spend Invest a lot of money right now. We're investing 1.5 billion dollar a year in our distribution reliability systems.
MARK KLEINGINNA: Wow. That's great stuff. Great stuff. Just to take it a little bit beyond that. And I could talk to you about reliability all day long because it's so near and dear to my heart as an old gas supply guy. But we'll just segue into that. What are current fuel markets doing with respect to the short-term and then long-term decisions you guys are making at DTE?
TREVOR LAUER: Yeah, it's interesting, the current fuel markets have been a little bit of a wild ride in 2022, at least for us. Nobody saw the blow up in the natural gas markets, right? So if you take a portfolio like ours where we burn natural gas as a fuel, we collect dollars from our customers. And it's called a fuel clause, well we under collected on our fuel clause, meaning we spent more than we got from our customers $450,000,000 because of the blow up of natural gas. Well, we were one of the best in the country. There were utilities in Florida that were undercollected by 1.2 billion. Right. That's a lot of cash not to be bringing into your business. So one of the things we've done was we started a hedging program for natural gas where we implemented a 36-month hedging program. We're layering in a 3% hedge every month. Take that volatility out. We're not trying to buy at the bottom right, what we can do is remove a lot of the volatility for our customers so that they don't see that blow up in price. Right? I think the other interesting one we're seeing in the current fuel markets - this may have more to do with the tax markets than it does the fuel markets, but we're accelerating our renewable build and our energy storage build based on the Inflation Reduction Act. And the tax credits that were given in the inflation, it's causing us to flip over our generation fleet faster than we were planning. We're de-hedging our way back out of coal. Right? We're shutting down, we own, we own one of the largest coal shipping terminals on the Great Lakes. We're shutting it down in 2025 as we move further and further into our renewables business.
MARK KLEINGINNA: Right. All right. So that'll take the renewables will take some of the volatility out because you don't you don't have a variable costs associated with the sun and the wind, so to speak, right?
TREVOR LAUER: That's right.
MARK KLEINGINNA: That's great. So talk a little bit about how power transmission is affecting what you guys do. And you guys have a sort unique, want to say unique situation. But it's somewhat different situation than we might face in different markets around the country. Because you guys are a peninsula, Florida is a peninsula. Things are a little different in Michigan than they might be in Pennsylvania or Illinois, or even California.
TREVOR LAUER: Yeah, so I'll start by saying I'm a big fan of transmission build out, but I also recognize how hard it is to build out transmission. The NIMBI issues are stronger in transmission than I think they are anywhere else. You mentioned us being a peninsula. 90% of the generation to have grid stability has to be in the state of Michigan. So transmission is a big issue for us, but I'll also say DTE, we spun out our transmission company as an independently owned transmission company back in 2003. So we're one of three transmission dependent utilities in the United States. So we depend on a third party to provide our transmission. So what's that practically mean? Well, there's three issues that I think we probably struggle with the most. One is renewable integration and interconnection. I like being able to build out the system the way I need to build it. And I can do that on the distribution side. If I announce a 300 Megawatt solar array, well, I now have to go to a third party and say, hey, when can you build that transmission for me. And transmission is an absolute monopoly, so I don't have the right to build it for them or have a third party. So transmission integration is number one. Number two, we have large customer loads as the electrification of transportation is happening. So if somebody comes and says in Michigan, we'd like to build a battery plant. We have this giant load. We want to sit down here. Well, if it's my distribution system, I tell every distribution engineer and all of our supply chain guys need to make that happen in here. It doesn't happen that way with transmission. Transmission, they called me and say, well maybe we can have it done in 36 months. And what you find is it's affecting our economic development and the competitiveness of our state on how quickly we can build that. Then the third is affordability. While I am a huge supporter of transmission build out, we also have to do it at very competitive rates. So we work with our local transmission company just to make sure that there... if there are other alternatives. Because an alternative to transmission could be generation, right? It could be energy efficiency. So, how do we think about understanding those alternatives so that we have the most affordable solution for our customers, right?
MARK KLEINGINNA: All right. So when you say transmission, is that the transmission company ITC? That was with consumers that you guys are consumers? Is there someone else in that group as well or is it just you two?
TREVOR LAUER: Well, us, consumers, and elite. The three that spun out. And ITC bought all three of those transmission companies last year. Two or three years ago, ITC sold themselves to Fortis, which is a Newfoundland, Canada-based company that now ITC and a couple of other utilities in the United States.
MARK KLEINGINNA: Right. Right. So for folks who are interested in the regulatory side of this, you find yourself... you find yourself intervening in their rate cases at FERC from time to time.
TREVOR LAUER: Yeah. Yeah, We're constantly they're intervening at our rate cases at the state level, and we're intervening theirs at the federal level. Right. I will also tell you I have dinner with the CEO. Her and I are very good friends, right? We have dinner 3, 2-3 times a year just to make sure the companies are ... we need each other and it's important that we communicate, right? But without being vertically vertically integrated like most utilities are, it adds a level of complexity to our business that other utilities don't see.
MARK KLEINGINNA: It's really interesting because vertical integration usually goes, you know, distribution, transmission back to the generation. But you guys kinda pulled the middle out where you're still owning generation and you still got distribution. But the link in the middle at a little bit different which makes your problem somewhat different from others, although they all tend to be somewhat the same. Great. Are there any other markets or conditions that are affecting your company that you might not have anticipated a couple of years ago?
TREVOR LAUER: Yeah, you know, there's a handful of things that came out of the pandemic that I'll say we're still struggling with. One is supply chain issues. If you would have told me that transformers could take me 18 months to get my hand on a transformer...we used to be able to much any size transformer we needed for our customers. Somewhere in the four to eight week time frame. Now we're buying transformers. I have teams that are scouring the world, finding other transformer suppliers, because transformers have become one of the most critical issues. I have a couple of customers where I haven't been able to interconnect them to the distribution grid because they don't have the right size transformers and I've never thought that we would have to tell a customer, I'm sorry, you have to wait four weeks to connect to our system so you can start to use our electricity. You can't buy transformers in the United States right now. The other interesting thing with supply chain is the quality of the work that third parties do for utilities like ours is really declined quite dramatically. We're having a new state built for our nuclear power plant right now, and we had it manufactured over at Belford, France. And the number of manufacturing defects that we've found ... so now, any highly engineered, highly manufactured part, I have 24/7 people at those factories watching the manufacturing and signing off on any deviation, due to the number of defects we've found in the supply chain. All of that is new since Covid hit. Something happened in the supply chain and we lost a little bit of quality. I think the other thing that's happened that's really impacted us and our customers is as interest rates have risen, the cost of debt was something we never really talked about at utilities, right? Because utilities borrow more money than they take in every year. A lot of people don't realize with our capital plans and dividends, but we're the largest, single user of the capital markets in the United States. Now, when interest rates have gone from 2.5% up to 6% right? You know, just at the electric utility, at DTE, it means my borrowing costs have gone up by almost $70 million annually. Well, that's a big deal when you're trying to hit your profitability numbers. You're trying to keep affordability low customers. That's also just a practical consideration that if you're buying a mortgage, you're buying a new car, you might think about it. But when you're operating at the scale we do, that number gets really big, really fast.
MARK KLEINGINNA: Yeah, absolutely. What do you think are the biggest challenges facing you guys in today's energy markets?
TREVOR LAUER: Biggest challenges...I like to talk in three, so I'll give you my example. Yeah, I think number one is affordability of our product for our customers. As we redo our distribution grid to handle distributed generation, electrification of transportation, it's putting a lot of pressure on rebuilding your distribution grids. So we're putting massive amounts of capital into our distribution grid. At the same time, we've declared that we want to be net zero by 2050. So we're changing out our generation fleet at the same time, where we're also investing 1 billion plus a year of capital. That's all in an environment where you have little to no growth at the utility, meaning, for your students, there's no more money coming in than there was the year before because of these great energy efficiency programs we have for our customers, right? So how do you balance getting through this transition where we all see this future, where all this additional electrification is going to show up? Somebody's got to pay the bills. How do you manage between now -- and I keep saying 2032, or 2033, when we see a meaningful ramp of this electrification of load, right? Affordability, I think is the single largest challenge that we have. The second really large challenge I believe we have is with our employees. How do you make sure that our employees stay highly engaged as we go through this energy transition? Look, Mark, you and I've been kicking around these markets for a long time. The pace of change inside of our industry right now is unlike anything I've ever seen. I've never worked at a utility before I came to work here. It's stunning to me how fast things are changing. And our employee base says, well, at a utility, it's kind of interesting, but maybe I go to work for the solar developer. IBM runs these great commercials about the smart grid. And what I have to help them understand is, yeah, they're doing a piece of it, but 80% of all of that's happening at your electric utilities, right? We're building 80% of everything. We're the ones integrating the smart grid. How do you help them see the broad view that they can have a great career at a company like this? They can grow, prosper, and continue to advance their careers. Attracting and retaining that right level of talent is hugely important. Then I think the third challenge that we see is reliability, right? The city of Detroit was one of the first electrified cities, not only in the US but in the entire world, right? We have pieces of our distribution grid that have been operating since the 1920s. We pull cables out of the ground that are over 100 years old. We are racing against time to improve reliability and to invest in a scale and manner that is unheard of across the country. We need to do it better than everybody else because we're short on time and I need to do it more efficiently than everybody else. So this concept you asked me about earlier, distribution reliability, is the third one that really, those are the three that keep me up at night, right?
MARK KLEINGINNA: Right. All right. So let's switch gears a little bit here and talk a little bit about your plans for transition to renewables. You said you had a 2050 net zero goal is that right?
TREVOR LAUER: Yeah, net zero.
MARK KLEINGINNA: Obviously, that's going to enable or and ensure some pretty significant commitment to renewables. So talk a little bit about that.
TREVOR LAUER: Yeah, At DTE we're really proud. We were the second utility in the United States to come out with a stated carbon reduction goal, and we did it very deliberately because we're the very environmentally friendly state, and we see renewables is just another great business. Back in 2008, we passed our first renewable portfolio standard here in the state of Michigan that required us to get to 15% renewables. We achieved that goal back in 2015, and we have been on a march since then. We now have the single largest voluntary renewable program where our customers can pay a small premium -- we have 85,000 residential customers and almost 20% of our overall load of buying on a voluntary renewable program, which is a really cool thing to do, right? But we got big goals ahead of us, Mark. So as we retire, it just so happens that we own the fourth-largest coal-fired power plant in the world. When we built it, it was the largest coal fired power plant, right? I've announced retiring, I have retired six coal-fired power plants in the last six years. We've announced the retirement of our Bell River coal-fired power plant in 2025 and we're going to convert that to natural gas so it serves as a peaker and allows us to do additional renewable integration. And our long-term plan requires us to build out 15 Gw of solar and wind in addition to the 3 Gw we have today. So it's a huge undertaking. The last thing I'll just add to it is this nuclear power plant we have... I can do what's called an extended power uprate, where I can add about 16% capacity to the nuclear power plant. So we're working through how to do the extended power upgrade because that's 100% clean energy that operates 100% at the time.
MARK KLEINGINNA: Right. All right. So when does, when does, how long is the license go on Furmi? Do you have another... another extension coming soon?
TREVOR LAUER: We extended until 2045. We intend to try to extend it to 2065. We're starting that process. We'll start that process probably in the next five years. Just given how long it takes to work with the Nuclear Regulatory Commission.
MARK KLEINGINNA: Absolutely, absolutely. So are there any roadblocks you see in the transition to renewable sources?
TREVOR LAUER: Yeah. Yeah. Single largest roadblock to renewables is land use. We talked about nimbiism with transmission, renewables straight. Everybody loves it until I show up in your backyard and say, I want to build a 2000-acre solar farm that you're going to see every day driving, or until I'm building a 2000-acre wind farm. The land use issues are the most overwhelming issues. We used to talk about project mortality, and about 50% of our projects would have project mortality. That's now edged up to almost 70%.
MARK KLEINGINNA: Wow.
TREVOR LAUER: It has to do -- Michigan's a state that has local control. Local municipal and township control. We don't have statewide zoning for each individual township -- we may span four or five townships with a project -- each of those have to have their own zoning and have to vote projects through. It's difficult, not unworkable. Is that is probably the most difficult thing that we're dealing with. And then the other transition I think is regulatory alignment. And how would I say this? I believe we need a little bit of everything, right? You can't be so pure and just saying I want 100% solar, I want you to have 100% solar and wind and nothing else. There's a transition that has to happen. So legislatively. There's a group of people that think they know exactly how to get there. At the regulators, there's a group of people at the regulators that are absolutely certain they know how to get there. And then there's us that actually run the business day to day, right, that think, okay, well, we're actually doing the work, we know how to get there also, So getting all those parties to align, right, may seem easy, but boy oh boy, is that hard on days.
MARK KLEINGINNA: Right. And then you get folks like consumer advocates and, and environmental advocates and maybe an industrial advocate or two. And they all have, they all have different, different ways to look at things too. I see you smile because you know exactly what I'm talking about.
TREVOR LAUER: Well, we're doing our integrated resource plan right now, and I don't know if you've talked to your students, but it's how you design your assets for the next 15 years, right? We have 27 different advocates in our current integrated resource plan. I have to get to a negotiated settlement with 27 different parties. Everybody cares usually about one, maybe two things, but we have to care about everything. It's cobbling together all of these pieces, of these opinions and different studies. And by the way, a lot of these stakeholders are really smart. I appreciate what they bring to us. Yeah. But you've got to turn it into a workable plan, and that can feel very difficult at times.
MARK KLEINGINNA: Absolutely, absolutely. Let's ... putting it all together, what do you think the most important takeaways for our students are from this discussion?
TREVOR LAUER: If I was a student and I was listed in discussion, what I would advise the students is to think about a couple of things. One is be curious. I meet a lot of people that are very principled in my business day in and day out. And when I say principled, they absolutely believe that you must move as fast as you can, and today you need to get there, and this is the crisis of the world. By the way, I believe that climate change is the single largest issue that our generation will face. And businesses like ours have to be in the middle of it. We have to. There's no way you solve climate change if we're not in the middle of it, right? But it doesn't mean I don't have to remain curious, and I have to listen to others. And I have to listen to their viewpoints. And I can't be so principled that I close myself off and I'm not hearing all the other really smart people that are in the middle of this debate remain curious is number one. The second thing I'd say to students is understand that there's people that pay the bills at the other end. All these decisions we make result in cost for customers, could decreased cost, or it could be increased costs. Right here for DTE, for my electric utility, we serve 6 million of the 10 million customers in the state of Michigan. I have a huge responsibility to the industrial customers and the residentials to make sure that we're doing this in a way that keeps bills and rates as low as we possibly can. While that means I may not move as fast as everybody would like me to, affordability really matters. I say that all the time. And then lastly, Mark, I'd say to students, all sources matter. It's a little bit of everything. I'd encourage them never to become so principled that they say it can only be solar, or it can only be nuclear. Because the great portfolios are going to come together and they're going to look like nuclear, they're going to look like carbon sequestration on gas, they're going to look like large solar, they're going to look energy storage with lithium-ion batteries. We happen to own the largest pump storage facility also in the United States. So it's a little bit of all these are the ways we're going to get there. That's how you become sustainable, that's how you become carbon neutral.
MARK KLEINGINNA: Right, Right. Great stuff. Anything else you'd want to add, Trevor?
TREVOR LAUER: Well, look, I love Penn State. I'll add that I am so fortunate to say that I have a degree from the College of Earth and Mineral Sciences. It's set me up for an opportunity to be really successful. Mark, you and I've had the opportunity to work together. Everybody I know from Penn State is successful. So I just encourage your students, put your head down, you can do anything you want in this world ... it is just a great school and I'm so proud to be a Penn Stater.
MARK KLEINGINNA: Well, thank you, Trevor. Really appreciate it.
Interview with T. Lauer by M. Kleinginna © Penn State is licensed under CC BY-NC-SA 4.0 [4]
What is due for Lesson 11?
This lesson will take us one week to complete. Please refer to the Course Calendar in Canvas for specific due dates. Specific directions and grading rubrics for assignment submissions can be found in the Lesson 11 module in Canvas.
- Complete all of the Lesson 11 readings and viewings, including the lesson content
- Complete Quiz 8
- Project work - No deliverables this week
Questions?
If you have any questions, please post them to our Questions? discussion forum (not email). I will not be reviewing these. I encourage you to work as a cohort in that space. If you do require assistance, please reach out to me directly after you have worked with your cohort --- I am always happy to get on a one-on-one call, or even better, with a group of you.
What Went Wrong with Rate of Return Regulation?
What went wrong with rate of return regulation?
Technology improvements and economies of scale caused electric rates to fall until 1970, which made industry and residential customers happy. In 2002 dollars, prices fell from about $5.15 per kWh in 1892 to about 9.7 cents per kWh in 1970. The highly regulated structure of the electric utility business created a stable environment for expansion of access to electric power. Beginning in 1970, however, prices for electric power began to rise sharply: 320% in current dollars from 1970 to 1985 (28% in inflation-adjusted prices), as shown in Figure 11.1.
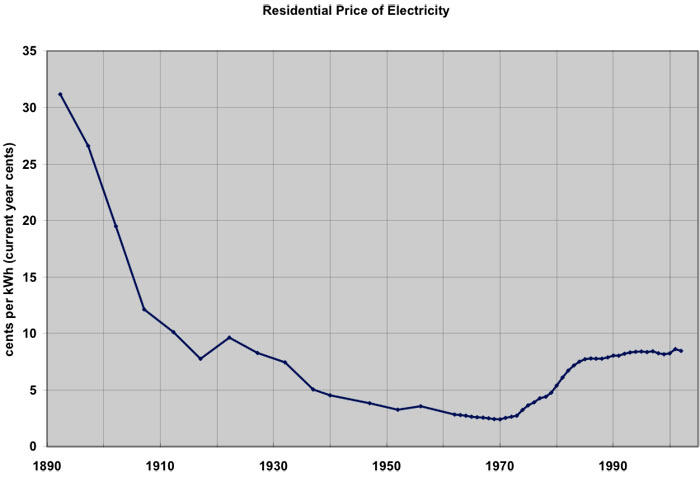
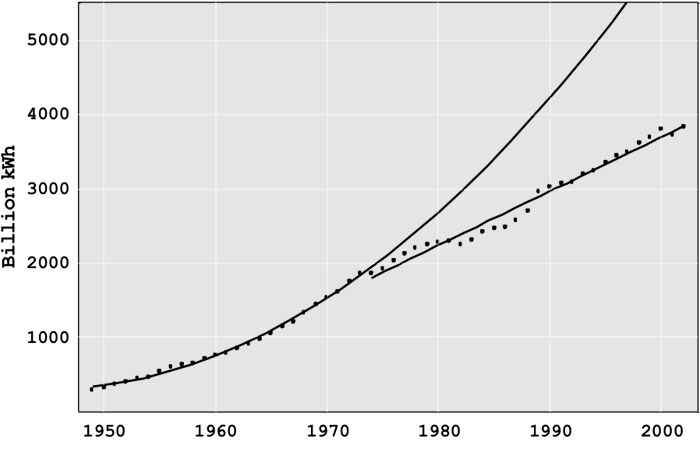
The oil embargo of 1973-74 affected both the production and consumption of electricity. Petroleum fueled 17% of US electricity generation at that time, and so the curtailment in supply reduced the ability to generate needed electricity (Today, petroleum supplies only 2%). The uncertain supply and much higher prices (which jumped from $3 in September 1973 to $12 a barrel in January 1974) had a devastating effect on the economy directly and the demand for electricity indirectly. Electric power generation in the United States in the period 1949 through 1973 increased exponentially (at the compounded rate of 7 ¾ % per year), and linearly since 1973 (with annual increases of 70 billion kilowatt-hours per year, the equivalent of roughly 15 new large generation plants per year), as shown in Figure 11.2. The transition from exponential to linear growth was unanticipated and led to the decade-long over-capacity of generation discussed above. The industry went through a difficult time after 1973, adjusting to the slower rate of growth utilities had in startup, construction, or planning a doubling of generation capacity. No one knew how long the decreased demand would last and, given the penalties of delaying or canceling construction, much of this capacity was built. If the industry had continued to grow exponentially, it would be almost twice as large today as it actually is.
Price increases were driven by higher petroleum, coal, and natural gas prices, rate increases to cover the cost of over-capacity, particularly in generation, reduced rates of technology improvement, and by investments in coal and nuclear generation plants of a size that stretched available technology beyond cost effectiveness. In the 1970s, nuclear power plants promised low-cost, environmentally benign power. Many utilities started the construction of new nuclear plants. Unfortunately, the utilities learned that building and operating nuclear plants was much more difficult than operating dams and fossil fuel plants. As a result, there were vast cost overruns in construction, e.g., Diablo Canyon and the Washington Public Power System, and poor plant operation, e.g., the fuel rod meltdown at Three Mile Island.
Building excess capacity, eliminating some plants that were in planning or early stages of construction, and having nuclear plants that turned out to be much more expensive than estimated and which didn’t operate well generated tremendously high costs. Public Utility Commissions and consumers resisted putting these costs into the rate base since they raised costs (and prices) markedly. However, since the PUCs had generally approved the investments, there was little alternative to reimbursing the utilities for the majority of these costs.
The electricity price increases came at a time when the deregulation of the airlines (1978), railroads, and the trucking industry (1980) were reducing prices substantially. The price increases upset consumers and generated intense political pressure to hold down electricity rates. One proposed answer was deregulating electricity, fostering competition and lower prices
As a reaction to the 1973 energy crisis, Congress passed the 1978 Public Utilities Regulatory Policies Act (PURPA), eliminating, at least in principle, protected monopolies for electric generation. The success of early non-utility generation facilities and of deregulation in other industries led to provisions in the 1992 Energy Policy Act encouraging wholesale and retail choice in electricity. Over the next decade, nineteen states and the District of Columbia enacted some form of electric restructuring legislation.
As shown in Figure 11.1, the price of electricity rose 50% from 1970 to 1975. The “minor” issues in the Rate of Return Regulation (RORR) structure that had been ignored now became major problems. The defects had been hidden by rapidly evolving generation technology that continually lowered generation costs.
- Growing Technical Complexity: As the grid grew in size and complexity, technical difficulties arose. While ever-larger generators had lowered costs for 70 years, the new 1,000 megawatt (MW) generators had unexpected problems. Starting in 1962, many utilities tied their systems together for mutual support. Although this may have reduced the number of small failures, the interconnections among utilities produced blackouts that affected millions of people beginning in 1965.
- Over-Investment: The profit that a utility could earn is directly tied to book value of its assets; the more assets, the greater the potential profit. The desire to build more generation and T&D was compounded by the fact that, in most years, a utility could borrow money (through loans or by setting bonds) at less than the allowed rate of return. Thus, investing in more assets with borrowed money allowed shareholders to earn much more than the allowed rate of return on their equity. For example, if the utility were allowed to earn 10% on assets and could borrow the money at 8%, a $100 million investment would return an additional $2 million per year to stockholders. This “Averch-Johnson” effect motivated utilities to find more investment opportunities, even if they were not really needed to provide reliable service. Since regulators demand high reliability, it was easy to justify increased investment as needed to prevent electricity shortages and blackouts.
- Bureaucratic Complexity of the State Regulatory Process: The state Public Utility Commissions (PUC) operated in a political-legal environment, often taking years to make decisions. The utilities benefited before 1970 when a new generator with low costs came online, since average generation costs fell. The utility was in no hurry to have the PUC act to adjust the price downward since they were earning profits above their target level.
- Technical-Business Knowledge of the Commissioners: Knowledge of the technology or business of the industry was rarely a criterion for selection to the PUC. Rather, the governor appointed political allies, usually lawyers, with limited technical or business knowledge to the PUC positions. The technical and business issues are sufficiently complicated, which means that even bright individuals, within a four-year term of office, are unlikely to understand the implications of the decisions they must make. Many utilities learned to manage the PUC, usually getting their desired outcomes. If, for myriad reasons, a utility doesn’t desire to be completely candid in describing its operations and costs, it could present data that would deter all but the most skilled auditors from learning what is going on. A commissioner with no technical or business background has little or no chance to figure out what the utility doesn’t want them to learn. Commission decisions see-sawed between compliance, giving the utility whatever it asked for, and being extremely critical, denying even fair requests.
- Political Decisions: The RORR process focused on the issues of greatest concern to the governor and commissioners, sometimes to the detriment of the average customer. Many commissions focused on subsidizing favored groups or large employers, resolving even unreasonable consumer complaints, and helping the political allies of the governor, rather than delivering low-cost electricity.
- Revolving Door: Some commissioners went to work for the industry when their terms of office ended, either as company executives or as lawyers. The key to having a good job at the end of the term was pleasing companies while in office.
- Punishing Risk Taking: Before an asset can go into the rate base, the PUC must find that it is a prudent investment. Since prudency review generally takes place after the asset is constructed, RORR gave utilities a strong incentive not to take chances on new technologies. Since operating costs were automatically passed through, utility management had little incentive to keep employment low and boost productivity. One indication of the effect of passing through operating costs is the massive reductions in the utility workforce in the mid-1990s stemming from the threat of deregulation and other changes.
- Low R&D Investment: Much of the R&D was done by equipment suppliers rather than the regulated utilities. The utilities in fact spent so little on R&D that, in the early 1970s, Congress seemed poised to order utilities to pay into a fund for the Department of Energy’s R&D. The threat was headed off by the formation of the Electric Power Research Institute, a nonprofit organization that would manage industry R&D. However, utility contributions to EPRI declined for two decades, and total R&D spending is extremely low, about 0.2% of revenue. This low level of spending is at variance with the technical problems in the industry and the promising opportunities for new technology.
Clearly, there were problems with RORR. One alternative would have been to reform the regulatory process, as was originally tried in the United Kingdom. The other alternative, which was embraced first within Chile and the United Kingdom before spreading to the United States, was a package of reforms that would change the way that some parts of the industry were regulated, and loosen regulations in other parts of the industry.
Deregulation or Restructuring?
Deregulation or restructuring?
The terms “deregulation” and “restructuring” are sometimes used interchangeably to describe the changes in the electric power industry starting in the 1990s. While the terms are not interchangeable, both in fact are correct. The generation segment of the electricity supply chain has been progressively deregulated, with power plants competing with one another in many areas of the world to provide service to a regional grid operator. Electric transmission has largely been restructured, not deregulated, with transmission regulation shifting from a local to a regional scale. In the U.S., this has meant that the regulation of electric transmission has shifted from state to federal authorities. Electric distribution has, with few exceptions, retained the same regulated structure that it has always had. This “last mile” of wires service is provided by a public utility that is granted a local monopoly in exchange for rate of return regulation by the state. In states that have undertaken deregulation and/or restructuring, the “electric utility” is in many cases just a distribution company.
Please read the first two sections from Blumsack, Measuring the Benefits and Costs of Regional Electric Grid Integration [3], which describes in more detail the process of deregulation/restructuring and some of the important U.S. federal policy initiatives that have pushed the industry towards its new state. It is important to realize that some aspects of restructuring have essentially arisen from federal initiatives and some from state initiatives. The most important aspects of electricity restructuring are:
- The vertical disintegration of the electric utility into separate generation, transmission and distribution companies. In some jurisdictions, this has been accompanied by the divestiture of generation plants by the former utility company.
- The establishment of “open-access” transmission regulations at the federal level, requiring all transmission-owning companies to offer non-discriminatory access to their transmission grids. This measure is aimed at promoting regional competition between generators.
- The creation of competitive wholesale markets for electric energy through the creation of “Regional Transmission Organizations.” These entities will be discussed further later in this lesson.
- Some states have opened up retail generation service to competitive forces. In these states, consumers purchase transmission and distribution service from the utility but have the option to purchase generation service from a company other than the utility. If this model sounds confusing, it is actually very similar to how telecommunications was deregulated in the 1980s, where you got to choose your long-distance phone company, but local calls were handled by your telephone utility.
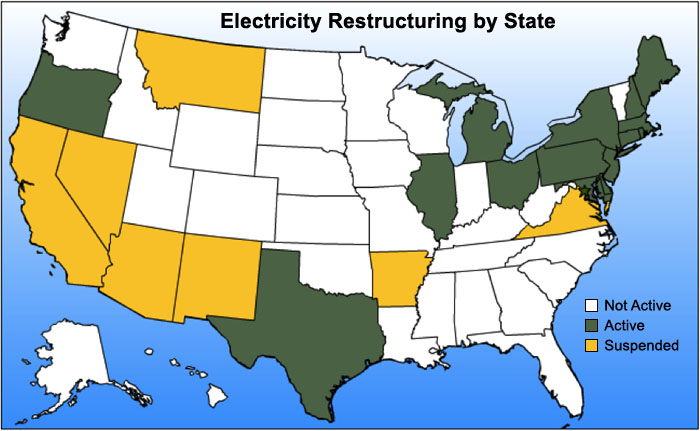
Not all areas of the U.S. have adopted deregulation or restructuring. Figures 11.3 and 11.4 show the areas of the U.S. that have adopted competitive wholesale markets for electric energy generation and those individual states that have taken on power-sector reforms at the retail level.
- California ISO, which includes CA and part of SW Nevada.
- Electric Relability Council of Texas (ERCOT), which includes most of TX.
- Southwest Power Pool (SPP), which includes a portion of N. TX, all of OK, KS, most of Nebraska, and western pieces of MO, AK, and the NW tip of LA.
- Midcontinent ISO (MISO), which contains portions of the following states: LA, AK, MS, MO, IL, IN, IA, MI, WI, MN, ND, SD, MT.
- PJM ISO, which includes portions of KY, VA, WV, WI, IL, IN, MI, and all of OH, PA, NJ, MD, and DE.
- New York ISO (NYISO), which includes all of NY.
- New England ISO (SO-NE), which contains all of CT, MA, RI, NH, VT, and most of ME.
- Electricity System Operator (IESO), which contains portions or all of Ontario, Canada.
- Alberta Electric System Operator, which contains portions or all of Alberta, Canada.
Regional Transmission Organizations
Regional Transmission Organizations
Regional Transmission Organizations (RTOs) are non-profit, public-benefit corporations that were created as a part of electricity restructuring in the United States, beginning in the 1990s. Some RTOs, such as PJM in the Mid-Atlantic states, were created from existing “power pools” dating back many decades (PJM was first organized in the 1920s). The history of the RTO dates back to FERC Orders 888 and 889, which suggested the concept of the “Independent System Operator” (ISO) to ensure non-discriminatory access to transmission systems. FERC Order 2000 encouraged, but did not quite require, all transmission-owning entities to form or join a Regional Transmission Organization to promote the regional administration of high-voltage transmission systems. The difference between RTO and ISO is, at this point, largely semantic. Order 2000 contains a set of technical requirements for any system operator to be considered a FERC-approved RTO.
RTOs are regulated by FERC, not by the states (i.e., RTO rules are determined by a FERC-approved tariff and not by state Public Utility Commissions) and membership in a RTO by any entity is voluntary. Including Texas (which is technically outside of FERC’s jurisdiction), there are seven RTOs in the U.S., covering about half of the states and roughly two-thirds of total U.S. annual electricity demand. Each RTO establishes its own rules and market structures, but there are many commonalities. Broadly, the RTO performs the following functions:
- management of the bulk power transmission system within its footprint;
- ensuring non-discriminatory access to the transmission grid by customers and suppliers;
- dispatch of generation assets within its footprint to keep supply and demand in balance;
- regional planning for generation and transmission (though see below for limitations to this function);
- with the exception of the Southwest Power Pool (SPP), RTOs also run a number of markets for electric generation service.
In many ways, RTOs perform the same functions as the vertically-integrated utilities that were supplanted by electricity restructuring. There are, however, a number of important distinctions between RTOs and utilities.
- RTOs do not sell electricity to retail customers. RTOs purchase power from generators, resell it to electric distribution utilities, who then resell it again to end-use customers.
- RTOs may not earn profits.
- RTOs do not own any physical assets – they do not own generators, power lines or any other equipment. RTOs generally cannot force generation or transmission companies to make investments.
- RTO decision-making is governed by a “stakeholder board” consisting of various electric sector constituencies. In some cases, the RTO can implement policy unilaterally without approval by the stakeholder board, but this is generally rare. All policies must, however, be approved by FERC.
- RTOs do not take any financial or physical position in the markets they operate. They must remain neutral market-makers, although they do monitor activity in their markets to avoid manipulation by individual generators or groups of generators.
The set of NETL power market primers zipped file [7] contains more information on specific differences between the various RTO markets.
The separation of ownership from control in RTO markets raises some interesting complications for planning. RTOs have responsibility for ensuring reliability and adequacy of the power grid. They must perform regional planning, meaning that they determine where additional power lines and generators are required in order to maintain system reliability. But RTOs generally cannot require that member companies make any investments. They generally rely on a variety of market mechanisms to create financial incentives for member firms to invest in generation. Many transmission investments needed for reliability are eligible for fixed rates of return set by FERC.
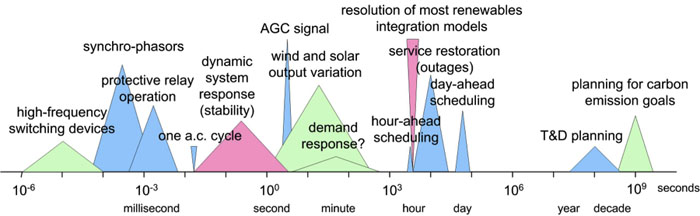
Operating a power system requires making decisions on time scales covering fifteen orders of magnitude prior to real-time dispatch, as shown in Figure 11.5.
Since the RTO does not own any physical assets, it must effectively sign contracts with generation suppliers to provide needed services. The market mechanisms run by the RTO are used to procure generation supplies needed to maintain reliability. Once generation supplies are procured by the RTO, it can dispatch generation as needed to meet demand.
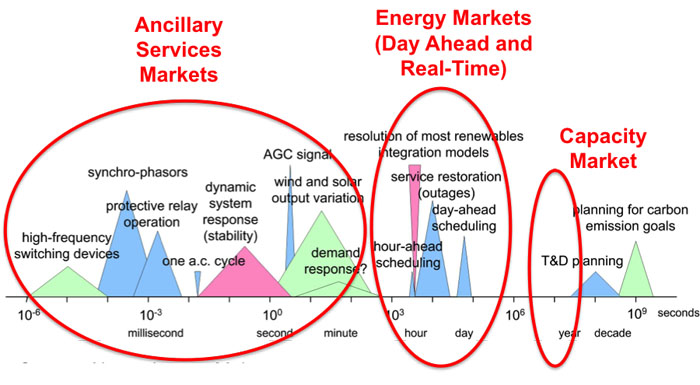
RTOs run three types of markets that enable them to manage the power grid over time scales ranging from cycles (one cycle = 1/60th of one second) to several years in advance of real-time dispatch, as shown in Figure 11.6.
Capacity Markets are meant to provide financial incentives for suppliers to keep generation assets online and to induce new investment in generation. Capacity markets are generally forward markets to have generation capacity online and ready to produce electricity at least one year ahead of time. PJM’s capacity market is run three years ahead of time. For example, a generator that participates in the PJM capacity market in 2023 is effectively making a promise to have generation capacity online and ready to produce in 2026. Capacity markets are thought to be necessary because prices in other RTO markets are not always sufficiently high to keep existing generation from shutting down or to entice new generators to enter the market. Not all RTOs have forward capacity markets. Texas, for example, does not operate a capacity market. We will discuss capacity markets in more detail in Lesson 12.
Energy Markets are perhaps the most well-known of all market constructs run by RTOs. Like capacity markets, energy markets are forward markets but are used by the RTO to ensure that enough generation capacity is online and able to produce energy on a day-ahead (24-hour ahead) to one-hour-ahead basis. RTOs run two types of energy markets. The first, the “day-ahead market” is used to determine which generators are scheduled to operate during each hour of the following day (and at what level of output), based on a projection of electricity demand the following day. The second, the “real-time market” is somewhat poorly named; this market is used by the RTO to adjust which generators are scheduled to run on an hour-ahead basis. A better term for the real-time market (which is used in some cases) would be “adjustment market” or “balancing market” since supplies for this so-called real-time market are actually procured one day in advance (but after supplies are procured through the day-ahead market). The prices prevailing in the day-ahead and real-time markets are the most commonly referenced and quoted of all markets run by the RTOs.
Ancillary Services Markets allow the RTO to maintain a portfolio of backup generation in case of unexpectedly high demand or if contingencies, such as generator outages, arise on the system. There are many different types of ancillary services, corresponding to the speed with which the backup generation needs to be dispatched. “Reserves” represent capacity that can be synchronized with the grid and brought to some operating level within 60, 30, or 15 minutes. “Regulation” represents capacity that can change its level of output within a few seconds in response to fluctuations in the system frequency. Ancillary services are increasingly important for renewable energy integration, so we will discuss those markets in Lesson 12.
Suppliers may participate in multiple markets. For example, a 100 MW generator could offer 80 MW to the day-ahead market, 10 MW to the real-time market, and 5 MW each to the regulation and reserves markets. The generator would earn different payments for each type of service provided to the grid. Thus, while the day-ahead or real-time price is often referred to as “the” market price of electricity, in reality, there are many different prices in the RTO market at any given time, each representing a different type of service offered to the RTO.
Because the RTO operates its entire system in an integrated way, even though its footprint may encompass many different utility territories and transmission owners, RTO type markets are sometimes referred to as “power pools” or simply “pools.” The following video contains more information about how the pool-type markets are structured, using the largest pool type model (PJM, in the Mid-Atlantic U.S.).
Video: PJM Model and SMP (9:37)
Seth Blumsack: PJM - ah, they used a different model, a different market model, which is sometimes called a pool. And the way the PJM, or pool market, works is that individual generators commit their capacity to the market, or the pool. The pool decides which generators are going to run at which hours. The way that generators are allowed to structure supply offers is much more limited in the pool than it was in the power exchange. In the pool, the supply offers from generators basically just reflected variable cost. And so, capital cost recovery and other things were made up through separate payments or separate markets.
So, the pool-type market has really become the dominant market model used in the US today. The pool-type market was, more or less, what FERC's standard market design looked like. The markets that are run by regional transmission organizations are all run as what we call uniform price auctions. They way that a uniform price auction works is that suppliers submit supply offers to the RTO and then these offers are aggregated to form a system supply curve. Originally, demand was assumed to be perfectly inelastic - which is the same thing as saying a vertical demand curve - so, whatever demand happened to be, that's what it was and they would pay whatever price the market happened to produce. At the point where this vertical demand curve crossed the offer curve, or the supply curve, was the market clearing price, or what we call the system marginal price for that particular time. I'll show you a couple of different pictures of this.
This is approximately what the supply curve looks like for the PJM market. A couple of things about this supply curve are that, first of all, it has this hockey stick sort of shape. Over a large range of electricity demand, the market price would not vary all that much - or the cost of generation would not vary all that much. In the example that I have here, if demand is a hundred thousand megawatt hours, which is this vertical line about here, then the point where that line crosses the supply curve is what sets the market price for that particular time period. And so, in this particular time period, at a demand of a hundred thousand megawatt hours, the price would be eighty dollars per megawatt hour. And if the price were a little bit lower or a little bit higher than that, say eighty thousand instead of a hundred thousand, the market clearing price would not change all that much. But as demand increases, in this case past a hundred and or a hundred and twenty thousand megawatt hours, then the cost of the capacity you'd have to use in order to satisfy that demand starts to rise very sharply. So, this point, the part of the supply curve over here where the price starts to rise very steeply is sometimes called the "devil's elbow."
If we have demand of a hundred and forty thousand megawatt hours, then, all of a sudden, the price would jump to $160 per megawatt hour. So, we have increased demand by 40% and we have doubled the price. At high levels of electricity demand, the small changes in demand can produce much larger than proportional changes in the market price.
The last generator that is dispatched to meet electricity demand is the generator that basically sets the market price, or the system marginal price. And the way these uniform price auctions work is that that system marginal price, or that market price, is paid to every generator whose supply offer was lower than the market price. So, if you're a generator, your profit during any time period is equal to whatever the market the price is minus your marginal cost. Sometimes, you'll hear this market referred to as a scarcity rent. The way that these uniform price auctions work, if you've take Econ 101, is not dissimilar to just about any other market in the world.
There is a variation on the uniform price auction called the pay-as-bid auction. This is used in the UK but not in the United States. The idea behind the pay-as-bid auction is that there's still a system marginal price that is produced through the market, but rather than each generator earning the system marginal price, each generator who is accepted into the auction, each generator that bids below what the system marginal price turns out to be, is payed whatever their bid was. As I said, this is used in the UK but not in the US. The belief in the US is that if you switched to a pay-as-bid system, this would simply give generators incentives to manipulate their bids. So, if you're a generator that has a marginal cost of five dollars per megawatt hour and you believe that the market price, or the system marginal price, will be fifty dollars per megawatt hour, in the uniform clearing price option, you would earn fifty minus five equals forty-five dollars per megawatt hour in profit. In the pay-as-bid auction, if you actually submitted a bid that was equal to your marginal cost, then you would earn five dollars per megawatt hour. The thought is, in the US, is that this would give this particular supplier an incentive to inflate their bid up to whatever they thought the market clearing price would be. So, the pay-as-bid is not really used in the US.
So, basically, all of the centralized wholesale markets run by RTOs follow this uniform price option format.
If you are interested, the following two videos discuss electricity market structures that are alternatives to the pool:
Video: Bilateral Markets Exist in Regions of the U.S. (4:25)
Seth Blumsack: Areas of the US that do not have these centralized electricity markets do have wholesale trade of electricity between generators and buyers, between utilities and so on and so forth. These are what we call bilateral markets, and these bilateral markets actually existed long before electricity deregulation, long before the PJM electricity market and so on and so forth. The first of these was actually set up in the western US in the late 1980s. It was called the Western Systems Power Pool. It's actually still in place - so, the market structure that was set up in the 1980s in the western states is actually still used there today.
The way that bilateral markets work is that large volumes of electricity, sometimes called bulk power, is traded between utilities, between buyers and sellers, at whatever price the two counter parties agree upon. And how these trades actually occur is that potential counter parties actually call each other up on the phone. So, I might be, like, Bonneville Power Administration and I could call somebody at SMUD (The Sacramento Municipal Utility District) and say, "I've got spare electricity to sell; do you want to buy any?" This is basically how the bilateral markets work. And sometimes, the energy that's purchased through these bilateral markets is coupled with access to the transmission grid so that you could actually deliver the electricity. This is sometimes called "firm" energy, as opposed to non-"firm" energy, which is sold without access to the transmission grid. These bilateral markets still exist today. Now, a lot of the bilateral trading takes place over electronic trading platforms. People don't call each other up on the phone as much; instead they might log in to some electronic trading platform, kind of like e-Bay or something like that. When we talk about centralized electricity markets, just keep in mind that places in the US that do not have centralized electricity markets still have trading of electricity through these bilateral markets.
In the mid-1990s, California and a handful of Mid-Atlantic states (the "PJM" market, which stands for Pennsylvania, New Jersey, and Maryland), as part of a broader electricity market restructuring effort, set up much more coordinated, much more formal mechanisms for trading electricity. The California model was a little bit different from the PJM model, but the big similarity that they shared was that rather than people calling each other up on the phone, there would be a centralized exchange setup, kind of like something analogous to the New York Stock Exchange or the New York Mercantile Exchange, where crude oil futures are traded. And rather than buyers and sellers trying to find each other by calling each other up on the phone, everybody would go to this centralized market, or this centralized exchange
Video: The Power Exchange Model Was Tried for a Couple of Years in California (6:00)
Seth Blumsack: Video 11.3: The power exchange model was tried for a couple of years in California, prior to that state’s energy crisis in 2000 and 2001. The function of the power exchange is to facilitate the purchase and sale of bulk wholesale electricity using a structure very much like a financial exchange.
Click for transcript of The Power Exchange Model Was Tried for a Couple of Years in California.
For these centralized electricity markets….I'd said that starting in the 1990s there were two competing models for setting up electricity markets: one in California and one in the PJM states. What California did was it tried most directly to replicate a financial exchange, like the New York Stock Exchange, for buying and selling electricity. And so, it opened The California Power Exchange. So, California's biggest utilities, they all agreed to go along with this, and they agreed to buy all of their power from the power exchange. So, how the power exchange worked was this:
First, individual generators decided whether or not they wanted to enter their supplies into the power exchange. This is called decentralized unit commitment. It was up to the generators whether or not they wanted to make their capacity available to the exchange. The bids from the generators, there was an overall cap, so a maximum amount, that the generators could bid, but beyond that, the generators could more or less do whatever they wanted. They could submit whatever type of supply offer they wanted to. And then, just as generators had to submit supply offers, the three large California utilities, they also had to submit demand bids. So, the idea was that you would have so many suppliers rushing into this market to serve so much electricity demand that there would be sort of this vigorous competition that would ensue, sort of like in an auction.
So, the way that the power exchange market worked was that every hour, suppliers would submit supply offers, which is the blue curve here, and the supply offer indicated how much generating capacity the supplier was willing to make available to the power exchange at what price. So, when you put all of these together you got what we call a supply curve or an offer curve. And that's in the blue. On the demand side, the utilities had to submit the amount of electricity that they were willing to buy from the exchange at some price. And so, that's the pink curve right over here. And when these purchase offers were aggregated together you got kind of a California system demand curve. And where the supply and demand curve met determined the price and quantity at which the electricity market would clear. So, in this example, and this is a picture from the late 1990s, the point where supply equals demand, the market cleared for this particular hour at about 32,500 megawatts of generation capacity would be utilized to serve 32,500 megawatt hours of energy demand, and the market clearing price would be $190 per megawatt hour. So, this was repeated every single hour of every single day. And in the event that there wasn't enough electricity purchased in through the power exchange to serve all of California's electricity demand, there was a secondary balancing market that would ultimately equate demand and supply on a sub-hourly basis. So, this was basically how the power exchange model worked, and the California power exchange lasted for about two and a half years, and after the California power crisis, as California's sort of screeching halt to electricity deregulation, the power exchange was shut down. Partially because of California's sort of dismal failure, the power exchange model has not really been replicated anywhere else except in Alberta, up in Canada, where they actually have had a power exchange type market for well over a decade. They seem to like it, but in California, it didn't work so well.
Virtually all RTO markets are operated as “uniform price auctions.” Under the uniform price auction, generators submit supply offers to the RTO, and the RTO chooses the lowest-cost supply offers until supply is equal to the RTO’s demand. This process is called “clearing the market.” The last generator dispatched is called the “marginal unit” and sets the market price. Any generator whose supply offer is below the market-clearing price is said to have “cleared the market,” and is paid the market-clearing price for the amount of supply that cleared the market. Generators with marginal operating costs below the market-clearing price will earn profits. In general, if the market is competitive (all suppliers offer at marginal operating cost) the marginal unit does not earn any profit.
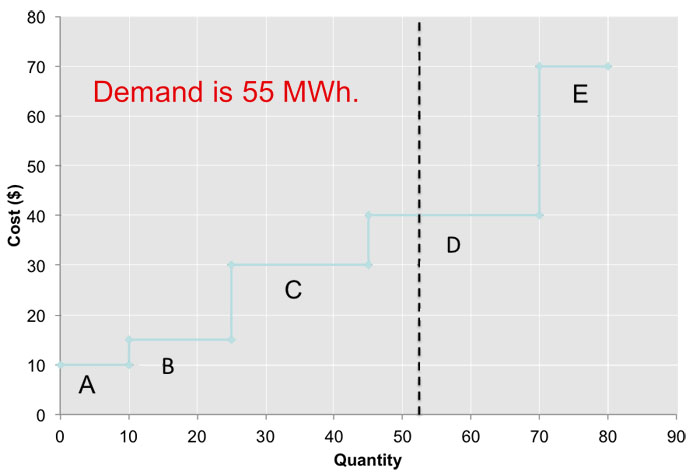
The uniform price auction is illustrated in Figure 11.7. There are five suppliers, each of which offers its capacity to the market at a different price. These supply offers are shown in Table 11.1. Here we will assume that supply offers are equal to the marginal costs of each generator, but in the deregulated generation market suppliers are not really obligated to submit offers that are equal to costs. The RTO aggregates these supply offers to form a single market-wide “dispatch stack” or supply curve. Demand is represented by a vertical line (the RTO assumes that demand is fixed, or “perfectly inelastic” with respect to price). In this case, demand is 55 MWh. Generators A, B, C and D clear the market. Generator E does not clear the market since its supply offer is too high. The market-clearing price, known as the “system marginal price (SMP)” would be $40 per MWh. Generators A, B, C, and D would each be paid $40 per MWh. Generators A, B and C would earn profit. Generator D is the marginal unit so it earns zero profit.
| Supplier | Capacity (MW) |
Marginal Cost ($/MWh) |
|---|---|---|
| A | 10 | $10 |
| B | 15 | $15 |
| C | 20 | $30 |
| D | 25 | $40 |
| E | 10 | $70 |
Let’s calculate the profits for each of our generators. Remember that each generator that clears the market (in this case, it would be A, B, C, and D; E does not clear the market) earns the SMP for each unit of electricity they sell. Total profits are thus calculated as:
Profit = Output × (SMP – Marginal Cost).
Since the SMP in our example is equal to $40, profits are calculated as:
Firm A profit = 10 × (40 – 10) = $300
Firm B profit = 15 × (40 – 15) = $375
Firm C profit = 20 × (40 – 30) = $200
Firm D profit = 10 × (40 – 40) = $0
Firm E profit = 0 × (40 – 70) = $0.
Note in particular that Firm D, which is the “marginal unit” setting the SMP of $40/MWh, clears the market but does not earn any profits. We will come back to this case when we discuss capacity markets in Lesson 7.
Locational Marginal Pricing
Locational Marginal Pricing
Unlike petroleum pipelines or natural gas pipelines, which in most cases require compression to maintain sufficient pressure to move product from the wellhead to the sales point, the cost of moving additional electrons through a network of conductors is essentially zero, since there is no fuel cost for “compression” in electrical networks.
(Actually, this isn’t quite true for a couple of reasons. First, transmission lines aren’t perfect conductors, so there is some resistance in the network. Because of this resistance, some of the electricity injected into the transmission grid by power generators is lost as heat between the power plant and the customer. The magnitude of these “resistive losses” is around 10% in a modern power grid like North America’s. What this means is that the system has to generate more power than is actually demanded, to account for these losses. For example, if demand in a system with 10% losses is 100 MW, then the system will need to generate around 111 MW. Second, the transmission grid needs to maintain a certain voltage level, and maintaining this level sometimes involves output adjustments at the power plant location, which does impose an economic cost on the system. In the discussion here, we will ignore these two costs to focus on the effects of transmission congestion.)
In the market-clearing example that we just went through, all suppliers were paid the market-clearing “system marginal price,” and the problem did not really say anything about where the generators or customers were located, or what the transmission network looked like. We just assumed that power produced at any one plant could be delivered to a customer at any location in the transmission network. Thus, electricity markets should exhibit the law of one price, just as we saw in natural gas networks.
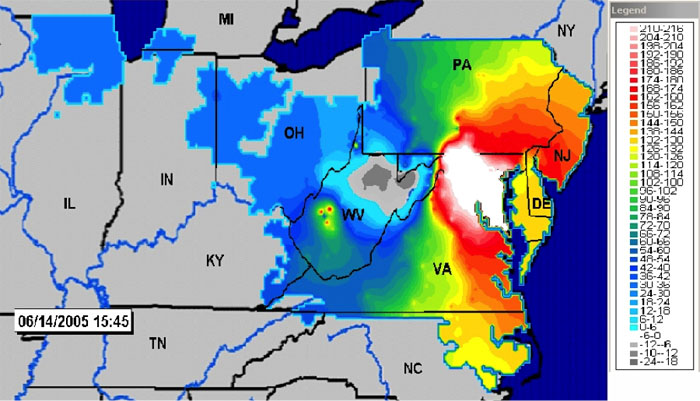
While electricity markets should exhibit the law of one price, the reality is that they often do not. Figure 11.8 shows a contour map of electricity prices in the PJM electricity grid on a warm, but not terribly hot day in June 2005. You can find more up-to-date maps [9] on the PJM website [10]. You can also find a really nifty animation of LMPs [11] from the MISO market [12]. If you look carefully at the MISO animation, you may see some negative prices, meaning that someone using electricity gets paid to use it, and someone producing electricity actually pays to generate power! While this may seem strange, it is actually a natural economic outcome of a market with fluctuating supply and demand, and no storage. We'll get to the negative-price phenomenon later in the course.
Getting back to our picture of prices in the PJM system, you can see that prices in the western portion of PJM’s grid are an order of magnitude lower than prices in the eastern portion of the grid. This means that a power plant located in, say, Pittsburgh could make a lot of money by selling electricity to customers in Washington, DC. The demand from Washington should bid up the price in Pittsburgh as more generation in Pittsburgh comes online to serve the Washington market. This is just what we saw in our study of natural gas markets. But this doesn’t happen in electricity. Why?
The basic answer is “transmission congestion.” Conductors cannot hold an infinite number of electrons. At some point, the resistive heat would just cause the conductor to melt. (Remember that materials expand when they get hot. When you hear about power lines “sagging” into trees, that is what’s going on.) So, power system engineers place limits on the amount of power that a transmission line can carry at any point in time. When a line’s loading hits its rated capacity, we say that the line is “congested” and it can’t transfer any additional power. So, the system has to find another way to meet demand, without additionally loading congested lines. Usually, this involves reducing output at low-cost generators and increasing output at higher-cost generators. This process, known as “out of merit dispatch,” imposes an economic cost on the system.
After correcting for transmission congestion by adjusting the dispatch of power plants, the cost of meeting demand in one location (e.g., Washington) may be substantially higher than the cost of meeting demand in another location (e.g., Pittsburgh). The locational marginal price (LMP) at some particular point in the grid measures the marginal cost of delivering an additional unit of electric energy (i.e., a marginal MWh) to that location.
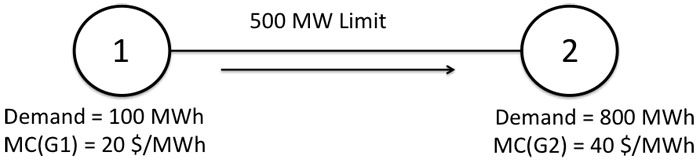
We will illustrate the concept of LMP using the two-node network shown in Figure 11.9. Node 1 has 100 MWh of demand, while node 2 has 800 MWh of demand. There are two generators in the system – one at node 1 with a marginal cost of $20/MWh and one at node 2 with a marginal cost of $40/MWh. A transmission line connects the two nodes. For the purposes of this example, assume that either of the generators could produce 1,000 MWh, and we will ignore any issues with transmission losses. Both generators submit supply offers to the electricity market that are equal to their marginal costs.
Suppose that the transmission line could carry an infinite amount of electricity. How should the system operator dispatch the generators to meet demand? Either generator by itself could meet all 900 MWh of demand in the system, so the system operator would dispatch generator 1 at 900 MWh and generator 2 would not be dispatched. The SMP would be equal to $20/MWh.
Now, suppose that the transmission line could carry only 500 MWh. In this case, the system operator could supply all of the demand at node 1 with generator 1, but only 500 MWh of demand at node 2 with generator 1. The remaining demand at node 2 would need to be met by dispatching generator 2. Since there is plenty of generation capacity left at generator 1, if demand at node 1 were to increase by 1 MWh, it could be met using generator 1 and thus the LMP at node 1 is $20 per MWh. If demand at node 2 were to increase, that demand would need to be met by increasing output at generator 2. Thus, the LMP at node 2 would be $40 per MWh.
Next, we'll look at how much the Generators are paid and how much the Customers pay. Customers at Node 1 are charged $20 per MWh, while customers at Node 2 are charged $40 per MWh for all energy consumed. Generator 1 is paid $20 per MWh, while Generator 2 is paid $40 per MWh for all energy produced. You may notice here that while customers at Node 2 pay $40 per MWh for all 800 MWh that they consume, some of that energy was imported from Node 1 at a much lower cost. This is not a mistake - it's how the LMP pricing system works in the US.
The RTO collects revenue from the customers as follows:
From Node 1: 100 MWh × $20 per MWh = $2,000
From Node 2: 800 MWh × $40 per MWh = $32,000
Total Collections = $34,000
The RTO pays the generators as follows:
To Node 1: 600 MWh × $20 per MWh = $12,000
From Node 2: 300 MWh × $40 per MWh = $12,000
Total Collections = $24,000
The RTO collects excess revenue in the amount of $34,000 - $24,000 = $10,000. It collects this excess revenue because customers at Node 2 pay $40/MWh for all energy consumed, while some of those megawatt-hours only cost $20/MWh to produce.
This excess revenue is called "congestion revenue." In general, when there is congestion in the network and LMPs differ, then there will be some congestion revenue. We will discuss later in the course what the RTO does with this extra revenue. For now, just remember that whenever there is transmission congestion and LMPs at different nodes of the network aren't equal, the RTO will usually wind up with some congestion revenue.
As an exercise for yourself, calculate the LMPs and congestion revenue under a second two-node example. Demand at Node 1 is 5 MWh, while demand at Node 2 is 10 MWh. The transmission line connecting Nodes 1 and 2 has a capacity of 5 MWh. The marginal cost of Generator 1 is $10/MWh while the marginal cost of Generator 2 is $15/MWh.
You should find that the LMP at Node 1 is $10/MWh; the LMP at Node 2 is $15/MWh; and that 5 MW of power is exported from Node 1 to Node 2 on the transmission line.
You should also find that congestion revenue is equal to $25.
Lesson 11 Summary and Final Tasks
Summary and Final Tasks
While rate of return regulation served the electricity industry and consumers well for many decades, it had embedded in it a number of incentive problems that made for inefficient operation of electric utilities and some behavior by regulators that was not always in the public interest. In particular, rate of return regulation gave electric utilities incentives to over-invest in capital - the so-called "Averch Johnson" effect. Regulators, in turn, labored under incomplete information regarding the state of the utilities that they were supposed to regulate. Even on their best day, the utilities knew more about the power grid than their regulators, so utilities could more easily get regulators to approve investments. Public utility commissioners are aided by large technical staffs, but at the end of the day, these staff members had expert knowledge but still had less data and system information than the utilities.
Recognizing that generation could be competitive over large regional areas, and that transmission and distribution needed to retain some form of regulation, the restructuring of the electricity industry consisted of the following fundamental changes:
- Dis-integration (or "vertical unbundling") of the regulated electric utility; or privatization of the national electric company in countries that had formerly known governmental control over electricity.
- A shift in transmission regulation away from state or local control and towards federal control. Federal policy encouraged the establishment of Regional Transmission Organizations (RTOs), which would manage electric grids over wide geographic areas.
- Establishment of competitive electricity markets for power generation, run by the RTOs. Generation companies would no longer enjoy a guaranteed rate of return, but would need to earn profits by providing services to RTOs at a lower price than their competitors.
- At the state level, establishment of retail competition for generation services.
In the United States in particular, restructuring has proceeded unevenly. Around half of U.S. states now have a power sector that has been restructured in some way. The other half still operate following the regulated utility structure that we discussed in Lesson 5.
Reminder - Complete all of the Lesson 11 tasks!
You have reached the end of Lesson 11! Double check the What is Due for Lesson 11? list on the first page of this lesson to make sure you have completed all of the activities listed there before you begin Lesson 12.