
4.4. Case of Garment Cleaning Solvents
The case study presented below exemplifies the application of a range of criteria to the process in the dry cleaner industry. This kind of analysis can help decision-making process in the green chemistry context.
(Source: UCLA Sustainable Technology & Policy Program, 2011)
Baseline and alternatives
The existing process of garment cleaning utilizes chlorine-based solvent technology, which is not sufficiently benign. This case study examines a few alternative technologies, which aim at making it a greener process. Table 4.3 below lists the alternatives under consideration.
| Garment care method | Description |
|---|---|
| Baseline option: Perchloroethylene (PCE) dry cleaning | Chlorine-based solvent technology. Washing and drying in the same drum. Utilizes solvent recovery system which condenses heated and vaporized solvent during dry cycle and distillation. |
| DF-2000 | Petroleum-based solvent technology. Washing and drying in the same drum. Utilizes solvent recovery system which condenses heated and vaporized solvent during dry cycle and distillation cycle. |
| GreenEarth | Siloxane-based solvent technology. Washing and drying in the same drum. Utilizes solvent recovery system which condenses heated and vaporized solvent during dry cycle and distillation cycle. |
| Rynex | Glycol ether-based solvent technology. Washing and drying in the same drum. Utilizes solvent recovery system which condenses heated and vaporized solvent during dry cycle and distillation cycle. |
| nPropyl Bromide | Bromine-based solvent technology. Washing and drying in the same drum. Utilizes solvent recovery system which condenses heated and vaporized solvent during dry cycle and distillation cycle. |
| Carbon dioxide | CO2-based solvent technology. Washing and drying in the same drum. Utilizes solvent recovery system through change in pressure. Distillation uses heat and condensation to clean solvent. |
| Professional Wet Cleaning | Water-based solvent technology. Typically, washing and drying in different machines. Solvent recovery is not used. |
The criteria for evaluation were selected from the list in Table 4.1.
Criteria weighting
Criteria weighting was based on stakeholder elicitation. Four stakeholder groups were considered by the authors: Environmental Non-governmental Organizations (NGO), Industry, Policymakers, and Consumers. The elicitation process was also designed to obtain stakeholder reactions to the criteria; for example, whether any relevant criteria have been left out. During interviews, stakeholder representatives were asked to rank the major criteria on the 100 point scale, and the average weight of that criterion was obtained by averaging scores over all interviews. The list of relative (percentage) weights of all major evaluation criteria, as voted by different stakeholders, is presented in Table 4.4.
| Envtl. NGO | Industry | Consumer | Policymaker | Overall Average | |
|---|---|---|---|---|---|
| Physical Chemical Hazards | 15.22% | 11.04% | 15.21% | 13.12% | 13.75% |
| Human Health Impact | 21.14% | 18.07% | 20.28% | 24.75% | 20.83% |
| Ecological Hazards | 18.60% | 18.67% | 19.68% | 18.07% | 18.75% |
| Environmental Impacts | 18.60% | 20.08% | 19.68% | 14.11% | 18.33% |
| Technical Feasibility | 14.38% | 16.47% | 11.56% | 16.58% | 14.58% |
| Economic Feasibility | 12.05% | 15.66% | 13.59% | 13.37% | 13.75% |
As was noted by the authors of the study,
"on average, all stakeholder groups (except Industry) placed more weight on human health and ecological hazards as well as on environmental impact criteria. Industry and Policymakers assigned more weight to technical feasibility as compared to Consumers and Environmental NGOs. Industry placed more weight on economic feasibility than the other three groups. As discussed above, however, the sample sizes for the stakeholder groups were quite small (three in each group), with the goal of getting a sense of the potential differences across and within groups." (UCLA.., 2011)
Scoring methods
One of the goals of this project was to demonstrate the application of two techniques for multi-criteria decision analysis: (1) multi-attribute utility theory MAUT and (2) outranking.
"MAUT is an optimization approach, meaning that it represents the decision-maker's preferences as utility functions, and attempts to maximize the decision-maker's overall utility. MAUT is premised on the assumption that the decision-maker has a fairly well-defined set of preferences that can be represented on a dimensionless utility scale. It also assumes that the decision-maker is rational; that is, they prefer more utility rather than less and are consistent in those preferences. In the context of this project, therefore, a utility function was generated for each criterion, which reflects how a decision maker's preference changes for different values of that criterion. This utility function spans from 0 to 1, with a utility of 1 being assigned to the value of the best (or highest) alternative score for that criterion and 0 being assigned to the value of the worst (or lowest) alternative score. In this case, a linear utility function was used; which assumes that increases in utility are directly related to increases in the alternative's score for the criterion in question. Linear utility function was used as a default. Because the weighted scores for all criteria are added to produce the alternative's total score, MAUT is a 'compensatory' method. This means that poor performance on one criterion can be compensated by better performance on another.
Outranking models do not create utility functions, but instead directly compare the performance of two alternatives at a time, in terms of each criterion, to identify the extent to which one alternative out-performs the other. It then aggregates that information for all possible pairings to rank the alternatives based on overall performance on all criteria. Generally speaking, the PROMETHEE code used in the project creates a 'preference index' for each alternative, which is calculated by reference to the alternative's positive flow (i.e., those instances in which the alternative outperforms another alternative on a given criterion) and negative flow (i.e., those instances in which the alternative is outperformed by another alternative). The value awarded for winning a particular pairing is weighted, meaning it is adjusted to reflect the value placed upon that criterion by the decision-maker. Thus, outperforming another alternative in a minor criterion is worth less than outperforming it with respect to a more highly weighted criterion. As a default in PROMETHEE and most other outranking methods, any difference in performance - however small - will result in an increase in positive flow for the better performing alternative. As in MAUT, PROMETHEE recognizes that a decision-maker may be indifferent to how alternatives perform on certain criteria until certain levels are met or after certain levels are exceeded. Because outranking techniques aggregate the results of pairings for all criteria, they allow superior performance on some criteria to compensate for inferior performance on other criteria. However, they do not necessarily reflect the magnitude of relative under performance in a criterion versus the magnitude of over-performance in another criterion. In other words, if Alternative A is marginally worse than Alternative B in one criterion, but substantially better with respect to another, outranking may not fully 'compensate' Alternative A for its overall better performance. Therefore, outranking models are known as 'partially compensatory.'" (UCLA.., 2011)
Results
As Figures 4.1 and 4.2 demonstrate, for garment care, the two MCDA approaches ranked the alternatives in the same order. Both methods identified wet cleaning as the best overall performer. It was followed by CO2 cleaning and perchloroethylene. Figure 4.1 displays the total score received by each garment care alternative under MAUT; the higher the score, the better the overall performance.
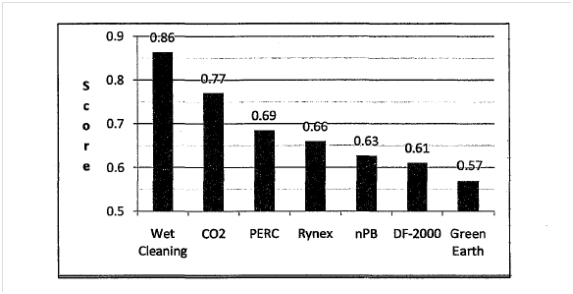
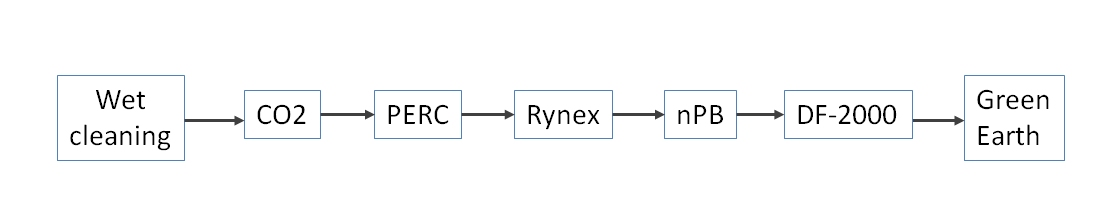
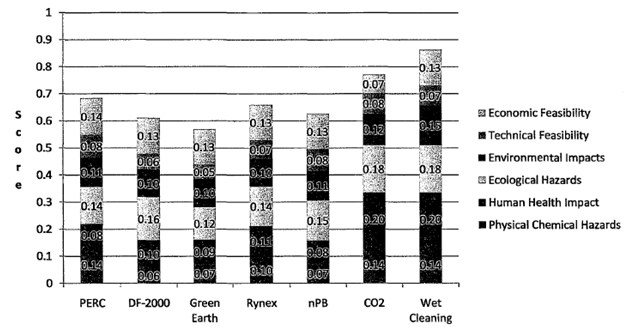
Figure 4.3 shows the breakdown of scores by each criterion. It is demonstrated that, "taking into account weighting, wet cleaning and CO2 cleaning's impact on human health, environmental, and ecological criteria drove the outcome in this case. This was so despite CO2 cleaning's very poor performance in terms of economic impact. Poor performance by DF-2000, nPB, Rynex and Green Earth in terms of physical and chemical hazards placed those alternatives behind the existing technology-perchloroethylene dry cleaning."
Example of score calculation
Wet cleaning technique, which outscored the other methods based on selected criteria, obtained a score of 0.15 for environmental impacts. This number is the product of the number of points assigned by the MAUT code and the average criterion weight (as prescribed in Table 4.2):
Score (Wet cleaning) = MAUT (Env. Impact) x Weight = 0.82 x 0.1833 = 0.15
The same technique received a MAUT ranking of 1 for physicochemical hazards (meaning it is least hazardous of all considered alternatives). Considering the weight of that criterion of 13.75% we calculate:
Score (Wet cleaning) = MAUT (Phys-Chem) x Weight = 1 x 0.1375 = 0.1375 ~ 0.14
In spite of better performance of wet cleaning on this criterion, its weighted score is lower than that obtained for the environmental impact, because of the lower weighing factor put on this category.