Lessons
Lesson 1: EM SC 240N Lesson 1 Review
Overview
The purpose of this lesson is for you to review key concepts from Lesson 1 (Energy and Sustainability) of EMSC 240N. I strongly encourage you to at least browse through Lesson 1 [1] of EMSC 240N, though that is not required.
Learning Outcomes
By the end of this lesson, you should be able to:
- provide a basic description/definition of the following terms/concepts: energy, thermodynamics, the First Law of Thermodynamics, energy efficiency, renewable energy, non-renewable energy, carbon-free, carbon neutral, sustainability, Brundtland Commission, 3 Es, intergenerational equity, and systems thinking;
- identify examples of the above concepts in contemporary culture;
- apply the above concepts in analyses of contemporary issues;
- identify and describe different forms of energy;
- describe how energy can be converted from one form to another; and
- analyze energy-focused charts and graphs.
Lesson Roadmap
| To Read | Lesson 1 Online Content | You're here! |
|---|---|---|
| To Do |
Lesson 1 Quiz Lesson 1 Journal Entry Lesson 1 Discussion Board Post #1 |
Canvas Modules > Lesson 1 Canvas Modules > Lesson 1 Canvas Modules > Lesson 1 |
Questions?
If you have any general course questions, please post them to our HAVE A QUESTION discussion forum located under the Discussions tab in Canvas. I will check that discussion forum regularly to respond as appropriate. While you are there, feel free to post your own responses and comments if you are able to help out a classmate. If you have a question but would like to remain anonymous to the other students, email me through Canvas.
If you have something related to the material that you'd like to share, feel free to post to the Coffee Shop forum, also under the Discussions tab in Canvas.
Energy and Thermodynamics
Thermodynamics is defined by NASA [2] as "the study of the effects of work, heat, and energy on a system." Any time you discuss energy transfer, assess the efficiency of a piece of equipment, or analyze the conversion of energy from one form to another, it involves thermodynamics.
Energy and Forms of Energy
Energy
Energy is defined as "the ability to do work," and work is the transfer of energy or the application of force across a distance. If this were a Physics or Thermodynamics course, we'd be more concerned about work, but for better or worse it is not, so we will stick to focusing on energy. For the purposes of this course, there are a few important things to remember about energy:
- Energy "makes things happen". Energy is required for a computer screen to light up, a car to move, the sun to make plants grow, and your brain to comprehend this sentence. In short, energy is involved in everything that humans can sense (sights, sounds, movement, thoughts, etc.) and many things that humans cannot sense (bacteria digesting waste, atoms holding together, mountains building, etc.). Everything physical around us either has or uses energy.
- Energy cannot be created or destroyed. It can only change forms. This is the First Law of Thermodynamics, sometimes known as the Law of Conservation of Energy. For a summary of the different forms of energy, see below.
- Since energy is the ability to do work, it can be quantified. More energy provides the ability to do more work; less energy provides the ability to do less work.
- Energy can be expressed in a number of different units, and one energy unit can be converted to any other energy unit as long as the unit conversion is known. More on this later in the course.
Forms of Energy
The following discussion of energy forms is taken nearly word-for-word from EM SC 240N. Direct quotes are from this reading from the National Energy Education Development (NEED) Project [3], which you are welcome, but not required, to read.
The two categories of energy are potential and kinetic. Potential energy is stored energy and kinetic energy is energy in motion. The forms of energy are as follows:
Forms of Potential Energy
- Chemical energy is stored in the bonds between atoms and molecules. Common examples include the energy stored in food, fossil fuels, and batteries, but anything that is made of more than one atom has chemical energy. Practically speaking, everything made of matter has chemical energy.
- Mechanical energy is "stored in objects by the application of a force." Common examples include a wound spring, a stretched out rubber band, and compressed air.
- Nuclear energy is "stored in the nucleus of atoms," and is what holds the nucleus together. Anything made of matter has nuclear energy, but most of the nuclear energy converted by humans comes from the fission (splitting) of uranium atoms and is used to generate electricity. Most of the energy used by humans, however, comes from nuclear fusion (fusing of atoms) in the sun.
- Gravitational energy is "energy of position or place." Common examples include water (e.g., in a river) at a high(er) elevation, a ball sitting on top of a hill, and you sitting on your chair right now. If you see naturally flowing water, it is moving downhill (tides and waves notwithstanding), so hydroelectric energy (electrical energy generated from flowing water) starts out as gravitational potential energy.
Forms of Kinetic Energy
- Electrical energy is "the movement of electrons." The most common example of this is electricity moving through a wire, but discharging static electricity and lightning are also electrical energy.
- Radiant energy is also called electromagnetic energy. It travels in transverse waves and is produced by anything with a temperature above absolute zero. Common examples include light, sunlight, microwaves, radio waves, and radiant heat emanating in all directions from a fire.
- Thermal energy is the vibration of the molecules of a substance. As an object or substance gets heated up, the molecules vibrate more rapidly; as it cools, they slow down. Humans cannot see this vibration because it happens at a molecular level, but we can feel it, or at least the results of it. Have you ever accidentally touched a hot stove and gotten burned? That unpleasant sensation is the result of the quickly vibrating molecules of the stove imparting their thermal energy into your skin. Anything above absolute zero has thermal energy, so it is all around us all the time, including everything you see right now.
- Motion energy is the energy in moving objects. Anything with mass that is moving has motion energy. Moving cars, flowing water, a falling object, and even wind (air is made of matter, after all!) are common examples.
- Sound energy moves in waves and is produced by vibrating objects. When you hear something, it is the result of the bones in your ear absorbing and converting these waves into motion energy, which your brain then interprets as sound. Despite what you may have heard, if a tree falls in the woods and there is no one there to hear it, it does generate a sound! Well, it generates sound energy, at least.
Differentiating the various forms of energy is usually straightforward, but I have noticed that people often confuse thermal and radiant energy. This is probably because most people associate "thermal" with "heat," so when something generates heat, it is assumed that thermal energy is being released. Please keep in mind that radiant energy travels in waves, and is released by everything above absolute zero (humans have never observed absolute zero). Radiant energy emanates in all directions from everything, and the hotter the object, the more and more intense radiant energy it emits. All radiant energy is invisible to the human eye except for energy in the visible spectrum. Thermal energy, on the other hand, is energy in the vibrating molecules of a substance. Again, everything above absolute zero has thermal energy, i.e., its molecules are vibrating. Thermal energy is contained within the molecule(s) and is not emitted.

Energy Transfer
Energy is constantly changing forms all around you (and everywhere else on earth) all of the time. All forms of energy can end up as all other forms of energy, and recall that the First Law of Thermodynamics dictates that all energy, irrespective of its form, comes from somewhere else. Again, the following is taken almost word-for-word from EM SC 240N.
Try This
Take a few minutes to look around you. Based on what you know about energy, what is energy “doing” where you are right now? What forms can you identify? (Seriously, take a look.)
Click for answer.
Considering I can't see you right now (Or can I? Hmm...), I'll just give you a few probable examples. If you are inside, light is coming from somewhere, whether it’s a light bulb on the ceiling, sunlight coming through a window, or at least coming from the screen you are looking at (this is electromagnetic/radiant energy). Any sound you hear is sound energy. Everything around you is radiating heat, which is a form of radiant/electromagnetic energy. Since everything in and around you has a temperature above absolute zero, it has vibrating molecules and thus thermal energy. If you are moving at all - even the slightest twitch of an eyelid - your body is using motion energy. Merely thinking about this question requires your brain to use electrical energy.
We could go on and on. But as you probably know, these are all examples of kinetic energy. There are also a number of types of potential energy around you. Think of some examples of potential energy around (and in) you right now. You are able to move and think because of chemical (potential) energy inside of your body. In fact, everything around you has chemical potential energy. Any object on the wall, on a table, attached to the ceiling, or just above the ground has gravitational (potential) energy because it is above the ground. There is also nuclear (potential) energy in all matter because all matter has at least one nucleus. Again, we could go on and on, but the point is that everything around you has potential energy, and thus has the ability to do work, i.e., “to make things happen.”
All of the examples of energy that were noted above came from somewhere else. The light coming from a light bulb is converted from electrical energy running through a wire. The heat radiating from non-living things around you was absorbed from another source such as sunlight or the heating system of the building. The motion and electrical energy your body has right now come from the chemical energy inside of your body. The gravitational energy of things around you came from motion energy required to lift the objects. And so on. And recall that each time energy was transferred, work was done.
Energy Efficiency
Efficiency is an often used term when discussing energy, e.g., "I have an efficient car," "How efficient is your furnace?", and "The average efficiency of a coal-fired power plant is around 33%." Though the term is thrown around a lot, it has a specific meaning. Energy efficiency is the amount of useful output per unit of input. The "useful" part of that definition is important since the First Law of Thermodynamics requires that all energy that goes into something must go somewhere.
- For example, the average internal combustion engine is 28% - 32% efficient, according to the U.S. Department of Energy [5] (U.S. DOE). This means that of all the energy that goes into the engine (chemical energy in the gasoline), only 28% - 32% results in motion energy to move the wheels and electrical energy to operate the various electrical components. Most of the rest is wasted as heat. (Note that only 16% - 25% of the chemical energy ends up actually moving the wheels due to the drivetrain and other losses.)
- Modern natural gas furnaces can be upwards of 97% efficient, which means that 97% of the chemical energy in the natural gas is converted to useful heat that can be delivered to the building, with the remaining 3% lost as waste heat and latent heat in the exhaust. (It is not uncommon for 30% of this energy to be lost in the ducts, according to the U.S. DOE [6], by the way.) Older natural gas furnaces often operate in the 70% - 80% efficiency range.
- According to the U.S. EIA [7], the average coal-fired power plant in the U.S. is about 33% efficient, which means that only about 33% of the chemical energy in the coal ends up as electrical energy. Almost all of the rest is wasted as heat. If you are so inclined, see the video below for a thorough explanation and animation of how a coal-fired power plant works.
Optional Video
The video below provides a very good explanation and animation of how a coal-fired power plant works. Think it's as easy as dumping a bunch of coal into a furnace and turning a turbine? Watch the video to find out.
First Energy operates twenty power plants in the Northeast United States that produce nearly seventy million megawatt-hours of electricity each year for over 4 million residential, commercial, and industrial customers. Over half of First Energy's electricity is produced by using coal, compared to about 60 percent nationwide. Let's see how electricity is generated from coal by taking a virtual tour of a coal-fired power plant similar to those operated by First Energy.
This plant has three generating units that produce more than 2,000 megawatts of electricity. At full capacity, this one power plant can produce enough electricity to supply the needs of one and a half million homes and businesses.
Generating electricity requires a fuel source. At this plant, the fuel source is coal which arrives mainly by a barge but also by rail and truck. Each barge delivers 1500 tons of coal - enough to keep the plant running for a couple of hours. The plant uses about 21,000 tons of coal each day, so over a million tons of coal is stockpiled next to the plant. A device called a stacker reclaimer scoops coal onto a quarter mile long conveyor that can transport up to 900 tons of coal into the plant each hour.
Once inside the plant, up to a thirty-hour supply of coal can be stored in bunkers. Coal moves from the bunkers to feeders to be measured and moved to pulverizers. Each generating unit has 16 coal feeders that supply 8 pulverizers. Coal enters the pulverizer and spins in a large drum where hundreds of steel balls grind it into a fine powder.
Now a fine powder, the coal leaves the pulverizers and heads to the boiler. About 335 tons of coal can be pulverized per hour.
Large fans add warm air to the powdery coal and blow it into the boiler. The boiler has miles of tubes filled with high-quality water. Once inside the boiler, the coal ignites, releasing energy and generating intense heat that changes the water inside the tubes to hot dry steam. The temperature of the steam is now about 1,000 degrees Fahrenheit. This process generates thermal energy which is transformed to mechanical energy at the turbine which is the next stop on our tour.
High-pressure steam, now one thousand degrees Fahrenheit at 3500 pounds per square inch is piped from the boiler to the first in a series of turbines. Here it expands between layers of turbine blades mounted on the turbine shaft. The steam loops back to the furnace, then on to the second turbine. In this process, the steam turns the series of turbines 3600 revolutions per minute providing power to the generator, the last in the series of machines. The generator continuously creates an electrical charge of 34,481 amps at 18000 volts of electricity. From here, the electricity leaves the plant and begins its journey to customers.
After the steam has been used to create electricity, it is exhausted from the turbine and sent to a condenser to be changed back into water. Inside the condenser, steam passes over the outside of pipes filled with chilled water from the cooling towers. The steam condenses to water and returns to the boilers to repeat the steam generating process over again. As the steam condenses, the chilled water inside the condenser pipes becomes warm from the heat of the steam so it is sent to a cooling tower. These particular towers are called natural draft cooling towers, which are designed with no moving parts. Inside, the water splashes over a series of baffles which breaks up the water into small droplets. These droplets mix with air from the open bottom of the tower evaporating some of the water and cooling the rest by as much as 27 degrees. The newly chilled water returns to the condenser to repeat the process of cooling more steam.
Since 1971, First Energy has spent more than $5 billion dollars on environmental protection. Our plants are equipped with air quality control systems to remove sulfur dioxide and particulates called fly ash. Fly ash is removed by a mechanical process and sulfur dioxide is removed with a chemical reaction using lime. These processes take place in large ductwork scrubber trains located between a unit's boiler and its chimney. Boiler gasses pass through scrubbing vessels and are sprayed with slurry, a mixture of water and lime. The sulfur dioxide particles and other pollutants are absorbed by the slurry and fall to the bottom of the vessels. A fan releases the cleansed gases through the chimney. By the time this happens, more than 99 percent of particulates have been removed, as well as ninety-two percent of sulfur dioxide. A plant similar to this one can remove over 400,000 tons of sulfur dioxide each year.
The scrubbing process creates a huge amount of a byproduct called calcium sulfite. This plant could create more than 3 million gallons of calcium sulfite slurry each day. First Energy created a process that turns that waste product into a valuable building material called gypsum which is used to make wallboard or drywall. The slurry leaving the scrubbers is thickened and pumped through a forced oxidation gypsum or fog system. Oxygen is then added changing it into gypsum which is dried, treated, and sent to a gypsum manufacturer to make wallboard.
First Energy recycles about a half million tons of gypsum each year - enough to manufacture wallboard for seventy thousand new homes.
Precipitators are another method of extracting coal ash, also called fly ash, which can be recycled or deposited in landfills. This mechanical process extracts fly ash left over from the combustion process. These poles called rappers shake fly ash from a vibrating wire. Gas from the furnace containing fly ash flows into the box. The fly ash drops into a storage chamber and is blown into silos to be loaded into a truck.
Fly ash from First Energy plants is used in manufacturing a variety of products, including concrete, grouting, roofing shingles, granules, and anti-skid road materials.
First Energy also uses a selective catalytic reduction technology or SCR to reduce nitrogen oxide emissions. SCR systems work much like a catalytic converter on a car. Flue gas containing nitrogen oxide emissions from the combustion process is mixed with ammonia. The mixed gases travel through a series of catalytic layers which causes the nitrogen oxides to react with the ammonia. The reaction converts the nitrogen oxides to water vapor and pure nitrogen, a benign chemical that makes up eighty percent of the air we breathe. Both elements are returned to the environment through the station stacks.
Now that we've taken a look at how electricity is produced and some of the environmental control protection systems used in our plants, let's take a look at how the electricity is delivered to our homes and businesses. Transformers located just outside the plant boost the power from 18,000 volts to 345,000 volts so it can travel long distances over transmission lines to where it is needed. Substations located along the path reduce the voltage so it can be moved along distribution lines attached to the utility poles. As the electricity nears customer locations, transformers on poles step down the power for use in homes and businesses.
(Music) We hope you enjoyed seeing how energy is produced at First Energy, where our energy is working for you.
All energy-using (and generating) technologies have an efficiency - TVs, light bulbs, solar panels, cell phones, wind turbines, airplane engines, electric motors, you name it. One important aspect to know is that when energy is converted, it is physically impossible to convert all of the energy into useful output. In other words, it is not possible for anything to be 100% efficient. This is dictated by the Second Law of Thermodynamics. The Second Law has other implications, but they are not important in the context of this course. If you'd like to learn more about the Second Law, see the video below and/or this [8]link.
Optional - Explanation of the Second Law of Thermodynamics
The second law can be confusing, but the narrator in the video below does a pretty good job of explaining some aspects of it.
Let's talk about the Second Law of Thermodynamics. This law is weird. There are about 10 different ways to state it, which is one reason why it's weird. Let's start with one of the most common ways to state it, which is, if you've got a cold object and a hot object, heat will never be seen to flow spontaneously from a colder object to a hotter object. So if you have these two sitting together, maybe an ice cube and a hot piece of metal, and you make them touch, heat's going to flow between them, but we know what's gonna happen. The heat's gonna flow from the hot object to the cold object, and never the other way. At least, not spontaneously. You can force heat from a cold object to a hot object as we do with a refrigerator or a freezer, but that's using a heat pump. And those refrigerators and freezers are doing work to force that heat from the cold region into the hot region. It won't do it spontaneously by itself. You've got to force it to do it. So what the second law says, or at least one version of it is that that process will never be seen to happen in reverse. The heat will never be seen to flow from the cold object to the hot object. Now, you might be thinking, "Duh. "Do we really need a law to tell us that?" But it's not so obvious, because you can still conserve energy and momentum and all the other rules of physics and laws of physics by allowing heat to flow from the cold object to the hot object. In other words, let's say the cold object started with 10 Joules of thermal energy and the hot object started with ... It's hotter, so let's just say it has 30 Joules of thermal energy. You could imagine five Joules of energy going from the cold object into the hot object which would leave you with five Joules of energy for the cold object, 35 Joules of thermal energy for the hot object. You still have 40, just like you did before. You didn't break the law of conservation of energy. It's just, energy won't go that way. So why? Why is thermal energy never seen to flow from the cold object to the hot object, even though it satisfies every other known law of physics besides the second law? Well, before we answer that question, I think it'd be useful to talk about an alternate version of the second law, which looks something like this. The total disorder will never be seen to decrease. What do I mean by "disorder"? Imagine you had a room and there were blue spheres. And they're bouncing around wildly. So these all have some velocity and random directions. And when they strike a wall or each other, they lose no energy. So they keep bouncing around like crazy. And then there's another section of the room with red spheres, and these are also bouncing around randomly. They lose no energy. They keep doing their thing. Except, there's a divider in this room that doesn't allow the red spheres to go onto the blue spheres' side and vice versa. These can't mix up. So right now, this is an ordered state because the reds are separated from the blues. So we say that this state has a certain amount of order to it. But let's imagine we removed the divider. Now, what's gonna happen? Well, you'll see these things mix up. This blue sphere will move over here, and it'll bounce onto this side. This red sphere will go over here. They'll just keep getting mixed up. And at some given moment, you might find the spheres in some configuration like this. They're still bouncing around, but now they're all mixed up and we say that this state has a higher amount of disorder. This is not ordered. We say that this is more disordered, which supports the second law. The second law says, if you let things do what they wanna do spontaneously, your system will go from a more ordered state to a more disordered state. And you'll never see it go the other way. We can stand in this room and wait. But you're probably never gonna see the blue spheres line up all on the left side and the right spheres line up on the right side. With 12 total spheres, maybe if you wait long enough, a really long time, you might catch it where all the red spheres are on one side and blues are on the other. But imagine this. Imagine now, instead of six reds and six blues, there's 100 reds, 1,000 reds, maybe 10 to the 23d and Avogadro's number of reds, and now they're all mixed up. The odds of ever seeing them get back to this ordered state are basically zero. The probability isn't exactly zero, but the probability is very, very low that you would ever see a disordered state with that many numbers of particles reassemble themselves into an ordered state.
So we kind of just know that from experience and what we've seen in our day-to-day lives. But you still might be wondering, "How come? "How come we never see a disordered state go to an ordered state?" Well, it basically has to do with counting. If you were to count all the possible ways of lining up the reds over here on this side and the blues on the left-hand side, there'd be a lot of combinations that would satisfy that condition. I mean, you could swap this red with that red, and this red with that red, all on the right-hand side. All these reds could get swapped around. And these blues, as well. They can get swapped around on the left-hand side. You get a large number of variations that would satisfy the condition of blues on the left, reds on the right. But now I want you to ask yourself, how many possibilities are there for having blues and reds spread out through the whole room? Well, you could probably convince yourself, there's more. And it turns out, there'll be a lot more. Now this red doesn't just have to maintain its position on the right-hand side somewhere. This red can get swapped out anywhere over here. I can swap a red with this blue, and this blue with this red, and this red with this red, and this blue with this blue. I can move them all over. Now that these spheres have the whole room through which they can mix, the number of states that will have blues and reds mixed throughout the whole room will vastly outnumber the number of states that have just reds on one side and just blues on the other side. And this simple idea is the basis for the Second Law of Thermodynamics. Roughly speaking, the Second Law of Thermodynamics holds because there are so many more disordered states than there are ordered states. Now, I'm gonna tell you something that you might not like. This particular disordered state that I have drawn, this exact one, is just as likely as this exact ordered state. In other words, if I get rid of the barrier over here, if you came in, you'd be just as likely to find the room in this exact configuration as you were to find it in this exact configuration. These two exact states are equally likely, which sounds weird. It makes you think, "Well, you're just as likely to find an ordered state as a disordered state." But no. This particular state is just as likely as this other particular state. But there are so many more mixed-up states than there are separated states. Even though any particular state is just as likely, since the mixed-up states vastly outnumber the separated states, if you pick one at random, it's gonna be a mixed-up state because there are so many more of them. Imagine putting these all into a hat. Imagine writing down all the possible configurations of states, ordered, disordered, in between. You put them all into a hat, you pull one out randomly, any particular state is just as likely. But since there are so many more disordered states, you pick one out randomly, it's probably gonna be mixed up. And if there's a large number of particles, you're almost certain to find it mixed up. So to help us keep these ideas straight, we need some different terms. Physicists came up with a couple terms. One is a macrostate. And a macrostate is basically saying, okay, the particles are mixed up. That's one possible macrostate. And we could be more precise. We can say, the reds and the blues can be anywhere within the box. Another possible macrostate would be to say that the particles are separated, that is to say, reds are on this side, anywhere on that side, but on the right side, and blues are on the left side, anywhere on the left side. These terms are referring to a macrostate, an overall description of what you would see. Now, there's another term, a microstate. And a microstate is a precise, exact description of the nitty-gritty details of what every particle is doing within there. If I just tell you, "The particles are mixed up," you're not gonna know exactly where they are. Similarly, if I just tell you, "They're separated," you're not gonna know exactly where they are. You'll know they'll be on the right-hand side, the red ones will, but you won't know. Maybe this red ones moves down here, maybe this red one moves up here. The microstate is an exact description. This red one's right here, going a particular speed. This blue one's right here, going a particular speed. If you specify the exact location, blue right here, blue right there, going that fast, red right here, what you're describing to me is a microstate. And so the second law, another way of thinking about it, there are more microstates for a disordered macrostate than there are microstates for an ordered macrostate. And that's why we see systems go from order to disorder. It's really just a statistical result of counting up the possible number of states. You might be wondering, what does this have to do with heat going from hot to cold, all this talk about microstates and macrostates? Well, it's not just position that can get disordered. It's velocities that can get disordered, energy that can get disordered, and that's more of like what's happening up here. The positions of the hot molecules aren't necessarily moving over into the cold range. But the energy over here is getting dissipated into the cold area. So image it this way. Let's get rid of all this. And imagine you had a room with gas in it, but this gas was kind of weird. At this particular moment, all the gas molecules on the right-hand side were moving really fast, and all the gas molecules on the left-hand side were moving really slow. So the room was separated into a cold region and a hot region, just like this energy is. This is ordered, or at least, somewhat ordered. It's more ordered than it's going to be. If you wait a while, this is all gonna mix up. You're gonna have some fast-moving particles over here, some slow ones over here. It's all gonna be blended together.
And so, what would you say if you were standing in here? At first, you'd feel cold because these particles don't have a lot of energy. Then you start feeling warmer and warmer. You'd say heat is flowing over to the left because you feel faster-moving particles striking your body. And so you'd rightly say that heat is moving from the right of this room to the left of this room. It flows from the hot to the cold. And that's what's happening up here. Heat flows from the hot to the cold. You might object. These are solids, I said, copper and an ice cube. A copper atom's not gonna make it over into the cold ice cube. But the energy is gonna move. So you can make the same argument over here. Don't allow these, let's say these are the copper atoms moving around fast, or at least jiggling in place rapidly. When they bump into the slower-moving water molecules in the ice cube, they're gonna give those water molecules some of their energy. And this energy's gonna become mixed up. The energy will become disordered. It will go from this ordered state, where the high energy is over here and low energy's here, to a disordered state where the energy's distributed somewhat evenly. So essentially what I'm saying is, if you consider the macrostate, where the hot molecules are separated from the cold molecules, there will be less microstates that satisfy that condition than there will be microstates that satisfy the condition for a macrostate where the energy is mixed up and you're just as likely to find a fast-moving particle on the left as you are on the right. This will have vastly more microstates, many more possible ways of making up a mixed-up state than there are microstates that create a separated state. I mean, there's gonna be a lot. I'm talking a lot of microstates that satisfy this condition for this macrostate, separated. But there will be so many more microstates for the mixed-up case, this dominates. That's why you always see heat flow from a hot object to a cold object, just because it's statistically inevitable with the large number of particles that you have here. There are so many more ways of heat flowing from hot to cold than there are from cold to hot, statistically speaking, you just never see it go the other way. Energy will always, at least spontaneously, if you let it do what it wants to, energy's always going to dissipate and evenly distribute. That's why it goes from the hot to the cold. This energy's trying to get mixed up, just because statistically, there are so many more ways for that to happen. Now, I need to tell you that there's actually a scientific term for the amount of disorder, and we call it the entropy. Physicists use the letter S to denote the entropy. And if you wanna know the formula for the entropy, you could look on Boltzmann's grave. This is Ludwig Boltzmann. He's got it on his gravestone. How awesome is that? The entropy S is k, Boltzmann's constant, times log. This is actually the natural log of W. And W is the number of microstates for a particular macrostate. So you got some configuration, you wanna know the entropy? Just look at what macrostate it's in, count up how many microstates are there for that macrostate, take the log of it, multiply by Boltzmann's constant, that gives you the entropy. And there's a term for this W. It's called the Multiplicity because it's determining the multitude of microstates that satisfy the conditions for a particular macrostate. Now, entropy is cool. Entropy is weird. Entropy is somewhat mysterious and still, probably, has secrets for us to unlock here. I don't have time to go into all of them here, but if you read up on it, entropy has a role to play in the fate of the universe, the beginning of the universe, the arrow of time, maybe our perception, all kinds of facets of physics that are extremely interesting. And entropy, you always find this guy lurking around. And one place you always find entropy is in the Second Law of Thermodynamics because it allows us a third way to state the second law, which is that the total entropy of a closed system will always be seen to increase. Technically, if it's a reversible process, the entropy could stay the same. But honestly, for all real-world processes, the entropy's gonna increase for a closed system, which is to say that the disorder increases.
Renewable and Non-Renewable Energy
Renewable energy is defined by the U.S. Environmental Protection Agency [9] thus: "Renewable energy includes resources that rely on fuel sources that restore themselves over short periods of time and do not diminish." Non-renewable energy is energy that cannot restore itself over a short period of time and does diminish. It is usually easy to distinguish between renewable and non-renewable, but there are some exceptions (more on that in a minute).
Non-Renewable Energy
Fossil Fuels
Fossil fuels are fossilized hydrocarbons made from organic material. They are considered "fossilized" because they take millions of years to form, they are hydrocarbons because they are made mostly of hydrogen and carbon, and of course organic material refers to living or recently living things.
The three primary fossil fuels used in the world are coal, oil, and natural gas. (As noted in EM SC 240N, oil and natural gas are technically made up of multiple hydrocarbons, but they are each conventionally referred to as individual hydrocarbons.) Feel free to read through the U.S. Energy Information Administration's (U.S. EIA's) summaries of coal [10], oil [11], and natural gas [12] before reading the summaries below.
- Coal is formed when organic material (almost entirely plants) dies and sinks to the bottom of swampy areas, and is subsequently buried under sediment for millions of years. There are four main types of coal, listed from lowest to highest heat content (i.e., lowest to highest chemical potential energy per ton): lignite, sub-bituminous, bituminous, and anthracite. Anthracite coal is the shiny black rock that most people probably think of when they think of coal, and the rest are shades of dull black or brown. Anthracite has very high carbon content (86% - 97%, according to the U.S. EIA [10]), and lignite has the lowest at around 25% - 35% carbon. Anthracite is mainly used in the metals industry, and the rest are primarily used to generate energy.
- Oil (aka petroleum, which means "rock oil") is formed when dead organic material (mostly microscopic photosynthetic organisms) die and sink to the bottom of shallow seas, are buried under sediment (usually sand and/or silt), and changed by heat and pressure over millions of years. Most of the oil extracted in the world is found in the pores of rock layers - sandstone (formed from sand grains) and increasingly from shale (formed from silt grains). Shale oil is extracted through hydraulic fracturing ("fracking"), which will be discussed in a future lesson.
- Natural gas is formed by the same process as oil. Natural gas naturally exists as a gas, and like oil is found inside the pores of rocks. Oil and natural gas are almost always found together.
Since all fossil fuels started out as plants or animals, all of their energy comes from the sun. The solar energy (all radiant energy) is stored as chemical energy when the plant undergoes photosynthesis, then is stored as chemical energy in the fossil fuel itself. It is (usually) released when the fuel undergoes combustion, which results in thermal and ultimately radiant energy release. Note that the physical material of fossil fuels does not come from the sun - the carbon, for example, is pulled from the atmosphere during photosynthesis - but the energy that is released when coal, oil, or natural gas is burned was once solar energy.
Nuclear
Nuclear energy, as discussed above, is the energy that holds the nucleus of atoms together. Nuclear energy in nuclear power plants is extracted using fission of uranium atoms. Fission releases radiant energy, which is used to heat water to steam and turn a turbine, which spins a generator and generates an electrical current. The sun utilizes fusion (fusing hydrogen together to form helium atoms), which then releases radiant energy.
Renewable Energy
As noted above, renewable energy sources "restore themselves over short periods of time and do not diminish." For a thorough explanation of many renewable energy sources, see this site from the U.S. EIA [13]. A more thorough explanation of these sources is provided later in this course.
- Solar [14]energy comes directly from the sun. (Recall that it results from nuclear fission, and arrives at the earth as radiant/electromagnetic energy.) Solar photovoltaics (PV) convert solar energy directly to electricity. Solar thermal technologies absorb solar energy and convert it to thermal energy in water or other fluids. Passive solar energy is a form of solar thermal and is when a home or other building uses the sun's energy to heat the inside of the building. Solar energy is constantly replenished, and so is renewable. It is intermittent, of course, which is its main limitation, along with being limited in power output. There is only so much energy per area available at a given time.
- Wind [15]energy is the motion energy in moving air. Air has mass, and when moving has velocity and thus kinetic energy. The wind energy used by humans is mostly harvested using wind turbines, which utilize wind energy to spin blades, which spins a generator that generates electricity. Air moves from areas of higher pressure to areas of lower pressure. This pressure difference is caused by differential heating (and cooling), which is the result of solar energy as it is absorbed and released by the irregularly shaped earth and different materials the earth is made of. Thermodynamically speaking, kinetic energy in the wind starts out solar energy, and so is renewable. Like solar, the wind is intermittent and limited in amount, but does not "run out."
- Hydropower [16]is energy in moving water (again, mass that has a velocity has kinetic energy). Most of the hydropower used by humans is used to generate hydroelectricity, which is when moving water spins a turbine, which spins a generator that generates electricity. Hydropower also comes from the sun: Water gets its kinetic energy from gravitational energy that causes it to flow downhill. This gravitational energy is the result of water being elevated. The only way water naturally goes uphill is through evaporation, which is almost entirely the result of direct solar energy or wind energy, and evapotranspiration by plants, which is also the result of solar energy. Any way you slice it, hydropower starts as solar energy. Hydropower is limited in scale and location (many places do not have flowing water), but where it does flow, it will often continue to do so, and is thus renewable.
- Biomass [17]is energy from living or recently living things. There are many ways that humans use biomass: burning wood, collecting biogas from sewage and animal waste, converting corn or switchgrass to ethanol, converting vegetable oil or algae to biodiesel, and burning food or agricultural waste are all ways to utilize biomass to generate useful energy. All living things get their energy from the sun - plants directly so, and animals ultimately get their energy from plants. Biomass is thus renewable but is limited in scale and supply. Plants only grow so fast, so if you harvest biomass faster than it is replenished, it is not being used at a renewable rate.
- There are other minor renewable energy sources such as geothermal (thermal energy from the earth), tidal energy (kinetic energy in tides, which results from gravitational energy from the sun and the moon), and wave energy (the result of wind energy that moves over bodies of water).
Carbon Free and Carbon Neutral Energy Sources
As you are no doubt aware, a primary sustainability concern regarding energy use is carbon dioxide (CO2) emissions. A carbon-free energy source emits no carbon when energy is being generated. Solar, wind, hydroelectric, and nuclear energy are commonly used carbon-free sources. Carbon neutral sources release CO2 but have no net impact on the CO2 concentration of the atmosphere because they release no more CO2 than was absorbed from the same atmosphere. Biomass is the only carbon-neutral source of energy. Recall that biomass gets its energy from the sun by virtue of it being used by photosynthetic organisms to grow. Biomass is made mostly of carbon, which is integrated into the biomass when CO2 is absorbed from the surrounding air. When said biomass is converted to useful thermal/radiant energy via combustion, the same or less CO2 is released, resulting in a net zero impact on carbon dioxide concentrations. To summarize:
- Carbon-free energy sources: solar, wind, hydropower, wave, geothermal, tidal, nuclear
- Carbon-neutral energy source: biomass
- Carbon-emitting energy sources: coal, oil, natural gas
Sustainability
It will help to at least skim through this page of EM SC 240N [18] prior to reading this material, but it is not necessary.
Key Sustainability Concepts
As I'm sure you are aware, the terms sustainable and green are used in many contexts and in many sectors of society. Sustainable growth, sustainable energy, green business, sustainable fashion, green cars, sustainable food, and sustainable consumption are just a small sample of how the terms are used. Many people in the sustainability field (myself included) are concerned that the term has been overused to the point that it is almost meaningless. Robert Engelman, President of the Worldwatch Institute [19], refers to this phenomenon as "sustainababble" in his "Beyond Sustainababble [20]" chapter from Is Sustainability Still Possible?. While this excessive usage of the term is undesirable, it is in some ways understandable because a) sustainability relates to everything that humans do and b) it has become an effective way to market products. Selling stuff to the masses drives the economy (consumer spending historically [21] constitutes around 65% - 70% of U.S. GDP), though such rampant consumerism ironically has a largely negative impact on sustainability. You may recall that EM SC 240N was largely designed to cut through a lot of this "sustainababble," and help you understand what sustainability really means. This course will offer a review of a lot of the concepts in that course, as well as provide some additional ones.
See below for a summary of key sustainability points from Lesson 1 of EM SC 240N:
- There is no single, universal definition of "sustainable," "sustainability," or "green." This lack of definition allows for the ubiquitous use noted above. There is no authority that monitors and/or limits the terms' use, and thus it can be attached to nearly anything. That stated, there are a few important definitions/conceptualizations that you should know:
- If something cannot be done for at least the foreseeable future, then it should not be considered sustainable. The example of sustained yield management used in EM SC 240N is useful here: If trees (or any naturally replenishing resource such as fish, freshwater, soil nitrogen, etc.) are harvested faster than they can be replenished, then they are not sustainable. On the flip side, if a waste product is being emitted faster than it can naturally be reabsorbed by the environment, it is not sustainable. Rising CO2 levels are a good example of this - the earth cannot absorb carbon dioxide at the rate it is being emitted by humans.
- The most universally recognized definition of sustainability (technically it is the definition for sustainable development, but the terms can generally be used interchangeably) is from the so-called Brundtland Commission, which was the United Nations committee headed by Gro Harlem Brundtland that published Our Common Future in 1987. Their definition is that sustainable development "meets the needs of the present without compromising the ability of future generations to meet their own needs" (Credit: Is Sustainability Still Possible? p. 3. Original source: Our Common Future [22], World Commission on Environment and Development).
- There are many other helpful definitions of sustainability. One that I think is particularly robust is from the U.S. EPA [23]: "To pursue sustainability is to create and maintain the conditions under which humans and nature can exist in productive harmony to support present and future generations."
- Front and center of the Brundtland Commission's definition is intergenerational equity, a very important concept in sustainability. Intergenerational equity mandates that we consider the impacts of our actions on future generations. This expands the basic concept of sustainability (Can we keep doing what we are doing indefinitely?) to include whether or not we are promoting a good quality of life for future generations. Not only should future generations survive, but they should thrive.
- Achieving intergenerational equity is fraught with difficulty. What is a need? To what degree do we sacrifice the needs and wants of the current generation in order to maximize the chances of future generations to live a good quality of life? How can we know the exact impact on the future? Though these are difficult questions to answer, true sustainability requires that we address all of them.
- Sustainability metrics/indicators help get rid of some of the "fuzziness" of sustainability definitions. Indicators quantify things that impact sustainability so that we can ascertain whether or not we are on a sustainable path, e.g. the number of resources remaining, the concentration of wastes, rates of consumption, population trends, etc. This is addressed in more detail in other lessons, but atmospheric CO2 levels are a good example of this (see below).
- Systems thinking is another essential concept in sustainability. The following is from EM SC 240N:
- There is difficulty in satisfying both present and future needs. Ridding the world of abject poverty is at the forefront of sustainability goals, but unfortunately economic growth and sustainability - particularly environmental sustainability - are often at odds. For example, increasing access to fossil fuels generally helps facilitate improving economic conditions, but causes unsustainable emissions. Even current and future sustainability can be at odds, e.g. when Engelman notes that: "Safe water may be reaching more people, but potentially at the expense of maintaining stable supplies of renewable freshwater in rivers or underground aquifers for future generations."
- This all indicates the importance of systems thinking. There is a lot of literature about systems thinking, and it does not have a single definition. (If only the world of sustainability were so simple!) It can be thought of as analyzing the world around us as a collection of interrelated systems, and not considering phenomena as isolated and unrelated to other phenomena. In other words, systems thinking requires consideration of connections.
- There is an old saying that "the biggest cause of problems is solutions," which is important to keep in mind when analyzing sustainability issues. From a sustainability perspective, systems thinking means that you should at least always a) consider the short- and long-term impacts of actions, both in space and time, and b) consider the possible causes of issues. It is unwise to address a problem or situation without thinking about the possible causes and consequences.

The Three Es of Sustainability
Sustainability and sustainable development are often thought of as having three core components: environment, economy, and equity. These are commonly referred to as the "3 Es" of sustainability. The 3 Es is a useful way to provide an analytical framework for sustainability. This 3E framework is useful because it provides questions that can be asked when investigating whether or not something is sustainable. While even these terms can be defined in various ways, we will use the following definitions from the reading when analyzing the sustainability implications of something:
- Is it "environmentally sustainable, or viable over the very long term"? (environment)
- Is it "economically sustainable, maintaining living standards over the long term"? (economy)
- Is it "socially sustainable, now and in the future"? (social equity)

The following provides a few more details about each of the 3 Es:
- The environment is the least confusing of the three. If we can keep doing ___________ without compromising the integrity or functioning of the environment (e.g. by not emitting wastes faster than they can be absorbed and not using natural resources faster than they can be replenished), then it can be considered environmentally sustainable. Later in this course, we will go over the concept of regenerative sustainability, which refers to taking this a step further and improving natural conditions.
- Equity refers to the fairness of opportunity and access to resources like education, health care, a clean environment, political participation, social standing, food, shelter, and others. It does not mean equal distribution of resources. There will always be inequality, whether we want it or not. In a socially equitable society, everyone has reasonable access to things that are generally considered conducive to a good quality of life. Whether or not they take advantage of them is another story. There is an important difference between being uneducated because of laziness and because of lack of access to good schools. Making this happen is easier said than done, but the distinction is important to make.
- Economic sustainability refers both to a) engaging in actions that are economically sustainable (if businesses do not make enough money to continue, they will not be in business for long) and b) promoting an economy that provides and maintains a reasonably high quality of life for all over the long term. From a sustainability perspective, money should be seen as a means to an end, and that end should be quality of life and environmental sustainability. If I run a business that makes me a lot of money but negatively impacts the quality of life for current and/or future generations, it is not considered economically sustainable from a 3E perspective.
Energy, Sustainability, and Society
I have a challenge for you: think of something that you did in the past week that did not involve energy.
Okay, so that's not really a fair challenge. Everything we do, even thinking about things that we might do, requires energy. Here's a more reasonable challenge: think of something that you did in the past week that did not involve the use of non-renewable energy.
Any food you eat almost certainly required non-renewable energy. There are obvious connections like farm machinery, artificial fertilizers, and herbicides, transporting food, refrigerating food, cooking food, and packaging food. But even if you grow your own, you likely used a tool or fencing that was manufactured using non-renewables, seeds that were processed and shipped with fossil fuel-using machines, packaging that was made using non-renewable energy, or maybe even plastic row markers made with petroleum-based plastics. Almost all transportation uses non-renewables, most businesses run on non-renewable energy sources (either directly or indirectly through electricity generation), almost all of the products you buy contain materials either made of or that are processed with fossil fuels. The electronic device you are looking at right now is partially made of and manufactured using fossil fuels. In short, modern society is very dependent upon access to non-renewable energy, particularly fossil fuels. As Asher Miller notes in The Post Carbon Reader:
Look around and you'll see that the very fabric of our lives - where we live, what we eat, how we move, what we buy, what we do, and what we value - was woven with cheap, abundant energy. (p. xiv)
The charts below provide some insight into the U.S. and global energy regimes. The first chart is from the International Energy Agency, and the other is from the U.S. EIA. Both are excellent sources of energy information. Please take a look at them and read through the descriptions, and keep in mind that there is one final summative point provided below.
Global Energy Use

There are a few interesting things to point out from the chart above.
- These charts provide what is referred to as an energy fuel mix. The term "fuel mix" refers to the percent breakdown of energy sources for a given area or sector.
- Total Primary Energy Supply (TPES) refers to all original or primary energy consumed. For example, if your electricity is supplied by a power plant, the energy your electronic device is using right now is not primary energy because the electricity was converted from an original source (e.g. coal, oil, natural gas, nuclear). Given that electricity generation is always less than 100% efficient (sometimes much less, per the previous section), the primary energy used by your device is greater than what shows up on your electric bill.
- Biofuels are lumped together with "waste." In many parts of the world, including many states in the U.S., if you burn garbage to produce heat and/or electricity, it is considered a biofuel, and thus renewable.
- Wind and solar are lumped into the "other" category, at a measly 1.5%. This has improved since 2015 (and was 1.1% of the total in 2012), and in fact has been growing at an all-time high rate, but there is still a long way to go before wind and solar make a major dent in the global energy regime.
U.S. Energy Fuel Mix
The charts below provide rather dramatic evidence of how important non-renewable energy is to the U.S. Both charts are from the EIA's Annual Energy Outlook (AEO) series, which are published on a yearly basis. A few things worth pointing out:
- The first chart is from the 2015 version of the AEO. Though a bit outdated, I put it here because the chart style (distinct color-coding and percentages) makes it very easy to see the dominance of non-renewable energy sources. The second chart is from the most recent report but is not quite as easy to interpret.
- These charts include both historical use and projected future use. Any way you slice it, the charts make clear that non-renewable energy (in particular fossil fuels) has played, and will (likely) continue to play, a dominant role in society.
- Aside from recessions (e.g., the early 1980s and 2007-8), energy use continues to increase over time. Despite consistent increases in energy efficiency, the U.S. can't seem to level off, never mind reduce overall consumption. This is also something that will have to be addressed if we are going to have a sustainable energy future.


Final Thought on Energy and Sustainability
It should be clear that the vast majority of energy used worldwide comes from non-renewable sources, and this is unlikely to change any time soon. This has a lot of sustainability implications, which we will address in more detail later. From systems thinking perspective, it is important to realize that everything you do requires energy, and it is important to think about where that energy comes from and what the sustainability implications are.
Summary and Final Tasks
Summary
That's it for Lesson 1! Hopefully this review helped solidify these concepts for you. By now you should be able to:
- provide a basic description/definition of the following terms/concepts: energy, thermodynamics, the First Law of Thermodynamics, energy efficiency, renewable energy, non-renewable energy, carbon free, carbon neutral, sustainability, Brundtland Commission, 3 E's, intergenerational equity, and systems thinking;
- identify examples of the above concepts in contemporary culture;
- apply the above concepts in analyses of contemporary issues;
- identify and describe different forms of energy;
- describe how energy can be converted from one form to another; and
- analyze energy-focused charts and graphs.
Reminder - Complete all of the Lesson 1 tasks!
Double-check the to-do list on the Lesson 1 Overview page [28] to make sure you have completed all of the activities listed there before you begin Lesson 2.
Lesson 2: EM SC 240N Lesson 2 Review
Overview
The purpose of this lesson is for you to review key concepts from Lesson 2 (Fundamental Sustainability Considerations) in EM SC 240N. I strongly encourage you to at least browse through Lesson 2 [29] of EM SC 240N, though that is not required.
Learning Outcomes
By the end of this lesson, you should be able to:
- define and provide examples of negative externalities;
- analyze the implications of achieving a steady state economy, and how they relate to ecological footprint.
- identify the pros and cons of energy return on energy invested;
- describe the (in)adequacies of using GDP as a development metric;
- analyze the viability of various development metrics;
- define social and environmental justice;
- identify examples of social and environmental (in)justice.
Lesson Roadmap
| To Read | Lesson 2 Online Content | You're here! |
|---|---|---|
| To Do |
|
|
Questions?
If you have any general course questions, please post them to our HAVE A QUESTION discussion forum located under the Discussions tab in Canvas. I will check that discussion forum regularly to respond as appropriate. While you are there, feel free to post your own responses and comments if you are able to help out a classmate. If you have a question but would like to remain anonymous to the other students, email me through Canvas.
If you have something related to the material that you'd like to share, feel free to post to the Coffee Shop forum, also under the Discussions tab in Canvas.
Externalities
Externalities is one of the more nuanced concepts from EM SC 240N, so I am giving it its own page. This is mostly a summary of EM SC 240N's version.
At this point, I'm sure you are all familiar enough with basic economics to know these three fundamental principles:
- All else being equal (this is known in economics as ceteris paribus [30]), as the demand for something in a market economy increases, the price increases, and when the demand decreases the price decreases.
- All else being equal, as the price of a good increases, the demand decreases, and if the price goes down, demand increases.
- Economic actors buy and sell things based on a cost-benefit analysis. They consider the private utility (the benefit to them) and the private cost (the cost to them) and engage in the transaction if they deem the cost-benefit balance to be in their favor.
The first two are not very controversial - if very few people want something (it has low demand) then it makes sense that companies would need to drop the price to sell it, and if something is in high demand, a company can charge more. Also, as the price of something rises, it makes sense that fewer people would want (or be able to) buy it, and vice versa. (It should be noted that some goods can be "inelastic" to a certain degree, which means that a price increase does not reduce demand by much and/or a price drop does not increase demand by much. Oil [31]can be inelastic under certain conditions, for example.)
The third point makes a lot of sense, too. If I go to buy apples and I go to the grocery store and see two different brands of the same apples (probably Honeycrisp, since my kids are obsessed with them) side-by-side, but one is cheaper than the other, I'll probably buy the cheaper one. The same type of decision-making process goes into most economic decisions that you make, whether it involves clothes, cars, where to go out to eat, which detergent to buy, which cell phone to purchase, and so on. You ask yourself: "Is it worth it to buy this product or that one?" and this is based on the price combined with the perceived value of the good. This lies at the heart of modern economic models.
Thus, the price of something is an essential consideration in how much of it is used, and thereby produced. But how is the price determined? In simplified terms, all of the costs that go into getting the product to the end user should be reflected in the price. For my Honeycrisp apple, the costs of at least the following should be included: the farm (paying for seeds, workers, growing equipment, etc.), the company that shipped the apple to the store (paying for workers, fuel to drive the trucks, people to arrange logistics, etc.), and of course the grocery store (paying workers, electricity bills, paying investors, insurance, etc.). These and any other costs associated with getting the apple to you should be covered. Otherwise, the businesses lose money and won't be able to stay in business much longer. In sum, all of the costs to get the good to you should be included in the price. Seems pretty straightforward, right?
As you may remember, it is not always this simple. All of the apple-related costs included in the price that was noted above are internalized, that is, they are reflected in the price. But can you think of any externalized costs, that is, costs that are not reflected in the price? Examples may include:
- If the apple is not organic, the workers may get sick from the chemicals, which costs them medical bills and lost work.
- If the farm sprays a lot of pesticides, this could harm local bee populations, which in turn reduces other crops that rely on bees to pollinate.
- The fuel used to ship the apples emits CO2, which contributes to climate change, and other pollutants such as particulates, which cause health problems and associated costs.
- The electricity used to power the grocery store may have been generated by burning coal, which has similar impacts to the gas or diesel noted above.
There may also be some external benefits involved with the process of getting the apple to you. Possible examples include:
- The tree absorbed CO2 and some pollutants from the air, reducing the damages noted above. (It should be noted that this would likely be lower than the amount emitted by the truck and the power plant noted above.)
- The trucking job provided enough income for the worker to go to school and eventually get a higher-paying job with better benefits.
- The money paid to the grocery store helped it stay in business, which contributed to the viability of the community around it.
There are many more possible impacts that are not included in the price of the apple. All of these would be considered externalities, as long as they were not included in the cost. The OECD offers a reasonably good, concise definition of externalities:
Externalities refers to situations when the effect of production or consumption of goods and services imposes costs or benefits on others which are not reflected in the prices charged for the goods and services being provided
(Please note that some economists consider anything that happens to someone that was not directly involved in a transaction an externality whether or not that "anything" is included in the price. In this course, we will only consider it if it is not included in the price.) Before moving on, feel free to watch the video below. The most relevant parts are the first 3:20 of the video and 5:06 - 6:22.
OPTIONAL video
Externalities occur when costs or benefits accrue to a person, or persons, who are not involved in the decision-making process. Note that externalities can involve either third-party costs (this would be a negative externality) or third-party benefits (this would be a positive externality). Let's address each of these in turn.
Negative externalities occur when a decision or activity imposes costs on anyone not involved in making that decision. Think of it this way: every decision involves some cost to the decision-maker; that's the private cost of your choice. But sometimes the decision imposes costs on others as well, which would be the external cost. Social cost, then, is the total cost to all members of society, or the sum of the cost to the decision-maker (which is private cost), and to others (external cost). What this means is that if a decision imposes any kind of external cost, then the social cost will exceed the private cost.
Think about this: do you think that too many people use their cell phones while driving, or too few? Well, why do you think that is? The answer lies with this notion of externalities. Look at it this way: when you're deciding whether or not to get on your cell phone while you're driving, what are the private costs, i.e. the costs to you, the decision-maker? Perhaps the cost of buying a cell phone in the first place? Or maybe the minutes you'll be using, or the cost of sending a message? It might even occur to you that you're increasing the likelihood of you getting into an accident. Now, are there any costs to other people, people who have no control over your decision to use your phone while behind the wheel? What about the increased risks to them? Or even just the annoyance of you driving like an idiot because you're on the phone? These are the external costs or the costs you impose on others with your behavior.
In the end, this discrepancy between the cost to you and the cost to society (which is the sum of the private and the external cost) leads to overproduction, if you will, of people driving while on their cell phones. Why? Because we’re all rational decision-makers – using the cost to us and the benefits to us to make our decisions. Very rarely do you find someone who includes costs to others when weighing a private decision. Essentially, you make the decision to be on the phone while driving because you consider only part of the cost - the cost to you. With negative externalities, because the private decision is based on costs that are too low, from society’s standpoint, the behaviors, or products, are overproduced from society's view.
This market failure provides a role for the government to correct the market, i.e., bring the production back to the socially optimal level. In the case of cell phones, this is most often done by putting laws in place that ban such behavior while driving and have hefty fines attached if you're caught. This effectively raises the cost of engaging in such behavior and thus decreases the amount of the behavior that occurs. The same idea would apply to, say, a steel factory. There's a certain private cost of producing steel (I’ll assume that on the benefit or demand-side, private and social are the same for now), but the production of steel also results in pollution, a cost to others in society. This means that the marginal social cost is greater than the marginal private cost. Left to its own devices, the steel market will be based on private costs and private benefits, yielding the price and quantity associated with equilibrium E1. What would society rather see? The socially optimal outcome would be based on social cost and social benefits, or equilibrium E2. Notice, this means society would like to see less production, meaning less pollution, and would be willing to pay a higher price to do so.
This is where the government comes in.
What is the government solution to a negative externality? Simple! Get the decision-maker to internalize the external effect. Since the problem arises from the decision-maker using costs that are too low, you need to somehow impose some additional cost, so the decision becomes based on level of social cost. This could be done by way of taxes, fines, regulation or cleanup fees. Or, in the case of pollution, there’s now a market for credits that allow you to pollute. If you're a clean producer, you’ll have unused credits you can sell which is an incentive for cleaner production. If you create a lot of pollution, you’ll need to acquire extra credits to continue producing, which is also an incentive to cut back on pollution production.
What about positive externalities? Just as you can make choices that impose costs on others, you can also make choices that result in benefits to others. If this is the case, then social benefits equal the private benefits, or benefits to the decision-maker, plus external benefits, or benefits to others. In the case of a positive externality, social benefits exceed the private benefits. Take education, for example. YOU decided to continue your education; why is that? What are the benefits to you of making this decision? It might just be the love of learning, or because you know that education means a better, higher-paying job in the future. But what about society? Society as a whole benefits from having a better-educated populace; highly educated, highly-skilled workers tend to be innovators, which helps keep our economy moving forward. All of this is good except for the fact that, in a free market, education will be underproduced -- this is true of any positive externality.
Why? Because the private decision-maker doesn't see the full benefit of education that society sees, so not as much education is produced. For the consumer of education, there's a certain private benefit (I’ll assume private cost and social cost are going to be the same). Decision-making based solely on private costs and benefits results in equilibrium at E1. Society as a whole sees a greater benefit; if the equilibrium were based on social costs and social benefits, equilibrium would occur at E2. Society desires a greater level of education, and is willing to pay more to achieve it. From a social standpoint, in a free-market, education will be underproduced. What's the government solution to a positive externality? Well, get the decision-maker to internalize the external effect. Sounds familiar, doesn't it? Except that with the negative externality, we had to try to get the decision-maker to see higher costs; with a positive externality, the government needs to somehow make the decision more beneficial to the private decision-maker. In the case of education, the government may provide grant money, low-interest loans, or tax credits in order to provide added incentive to get more education.
As noted in the video, there are usually external costs and/or external benefits to transactions. External costs and benefits are borne by people or other entities that had no input on the transaction and were not fully included in the price. A negative externality occurs when an external cost occurs, and a positive externality occurs when an external benefit occurs.
Sustainability Implication
There are a few important sustainability implications of externalities:
- Negative externalities are very common, and often impact sustainability. Pollution is a prime example of this. It is rare that all of the costs of pollution are included in the price of something, whether it is mercury, sulfur dioxide, or particulates emitted from a power plant, CO2 emitted from a car's tailpipe or fertilizers that run off of farms and cause dead zones. These can all have major negative sustainability impacts.
- Negative externalities are overproduced because they make the price lower than it should be. If the negative impacts of climate change were included in the cost of coal-fired electricity, for example, the cost of coal-based electricity would be higher and the demand for it would diminish.
- Positive externalities are underproduced because they make the cost lower than it should be. If all of the benefits of say, education were included in its price, the price would be lower and thus in higher demand.
- In a broader context, economics plays such an important role in modern society that externalities have become a major problem.
In sum, externalities are by definition not included in the cost of goods. Positive externalities, which are usually good for sustainability, do not occur as often as they should because the benefit is not included in the price. Negative externalities (which are more common, by the way) happen more often than they should because their cost is not included in the price.
The Social Cost of Carbon
Without getting into the specifics about the probable causes of climate change (that will be covered in the next lesson), let's take a look at climate change as an externality. As you will see in the next lesson, if the climate continues to change, the impacts will be overwhelmingly negative. Quantifying these costs is an active area of research, but many countries - including the U.S. - have placed an "official" cost on the emission of carbon dioxide (this is used to calculate the cost of new legislation). Under the Obama administration, the U.S. federal government used a social cost of carbon (SCC) of $39 per tonne [32]of carbon dioxide. (Not surprisingly, the Trump administration has proposed to lower this significantly.) A 2015 study out of Stanford University [33] found that the U.S. grossly underestimated the SCC and that it should be closer to 220 dollars/tonne. In 2013, major corporations integrate the cost of carbon emissions into their projects [34] (between 6 dollars and 60 dollars/tonne), though they use some different considerations than SCC, and by late 2016 hundreds of companies [35] worldwide had integrated SCC internally.
Summary
There is a lot of material to these points and it is very important, so here is a summary of the key points:
- An externality is a cost or benefit of the production or consumption of a good or service that is not included in the private cost/benefit of that good or service.
- An external cost (e.g. pollution) not included in the price is a negative externality. An external benefit (e.g. education) that is not included in the price is a positive externality.
- If all external costs and/or benefits are included in the price, then most economists believe that no externality has taken place.
- Goods and services with negative externalities tend to be overproduced, meaning that more is produced than is socially optimal. This is because the private cost of the good/service is less than the total (social) cost, i.e., it is cheaper than it should be.
- Goods/services with positive externalities tend to be underproduced because the total (social) benefit is higher than the private cost, i.e., it is more expensive than it should be.
- The direct short-term external costs of energy generation can be significant, due to health problems and other issues. In other words, if external costs were included in the price of fossil fuels, they would be more expensive. However, in some emerging economies, these external costs may be overcome by the positive benefits of having more energy.
- Climate change is considered a negative externality because the impacts of emissions are felt by people that did not cause the emissions. Most of these costs are in the future.
- The social cost of carbon (SCC) is an attempt to quantify the external cost of emitting CO2. This is very difficult to do but has been quantified in terms of dollars per tonne of emissions. By using dollar per tonne, the cost of a kWh of electricity, a gallon of gasoline, ccf of natural gas, etc. can be calculated.
- The intent of using SCC is to integrate the external cost of carbon emissions into the price of things that cause these emissions. This would make them more expensive, but could more accurately reflect the true cost.
Ecological Footprint
I'd like you to consider these two basic truths:
- When a resource has a limited capacity to be replenished, if it is harvested faster than it is replenished, it will diminish.
- When pollution is emitted faster than it can be absorbed, it will accumulate in the environment.
Just as a business that loses more money than it makes runs a deficit, when humans overuse the capacity of the earth to replenish resources, it could be said that these places are running an ecological deficit. In this scenario (see the image below for an example), our stock of natural resources will diminish.
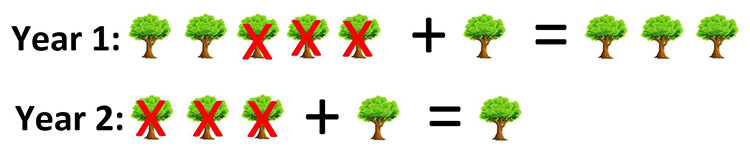
It is relatively easy to determine the number of trees (or other plants) that a farm can grow in a year. The earth, of course, provides a lot of other natural resources that are useful and/or important for humans (absorbing CO2, providing oxygen, providing food, replenishing the soil, etc.). Combined, the amount of these resources sustainably provided in one year can be considered one "earth's worth" of resources. If we could figure out this "one earth" and compare it to how many of these resources we use, we could determine if we are losing or gaining ecological capacity. This is where the concept of ecological footprint comes in.
Optional Video
Feel free to watch this short video from Mathis Wackernagel, who originated the concept of ecological footprint. He is currently Executive Director of the Global Footprint Network [37], which specializes in calculating ecological footprints.
The Ecological Footprint: Accounting for a Small Planet
We have been the most successful species on this planet. Two hundred years ago, nobody could have imagined that kind of lives we are living today: the cities we have been able to construct, the technologies we have been able to create. And so we are asking ourselves, how will we be able to maintain the success in the future? Since the end of World War Two, we have more than doubled population, and we are consuming far more per capita. In the last century alone, we are now consuming tenfold the energy what we did hundred years ago, and we are recognizing that the planet is getting awfully small.
If we just compare, you know, how successful we have become as a species. We as a species together with our cows and pigs, we are about 97 percent of the biomass of all vertebrate species. But only about three percent are wild species, so we have been able to dominate the whole ecosystem of the planet. Now that may be a success but its success also had its cost: that the planet is getting awfully small. That’s why we have developed the ecological footprint to start to measure how big are we compared to the biosphere, how can we actually use our ecological assets more effectively to live well on this planet. Now the ecological footprint is a very simple tool. It's a tool like a bank statement that tells us on the one hand how many resources do we have that renew itself, thanks to the biosphere that is powered by the sun. And how many do we use, and then you can see to what extent we are actually dipping into the overall capital or to what extent we're really living within that interest that nature provides us.
If you want a real simple and effective model of how do the economy operates, just take the cow. Because everything that enters the cow as food will leave again. Very similar to an economy, a cow also produces a value-added, the milk. The milk, too, whether you consume it or not, becomes waste.
So a farmer knows how much area, how much pasture, how much cropland, how big of a farm is necessary to maintain his or her cow herd. Now the same way we can see how much area is necessary to support me or to support our cities, to support our economies, to support the world as a whole, all humanity - to maintain all the resources we consume and to absorb the waste - that's what the ecological footprint measures for you.
This all points to the importance of ecological footprint. Ecological footprint can be defined as follows:
"Ecological Footprints estimate the productive ecosystem area required, on a continuous basis, by any specified population to produce the renewable resources it consumes and to assimilate its (mostly carbon) wastes."
~Jennie Moore and William Rees, "Getting to One-Planet Living", p. 40
The beauty of ecological footprint is that it provides a specific area of land and water that must be used to sustainably provide the resources necessary to support a person or population. (It is impossible to know the exact area needed, but we can derive a good scientific estimate.) From a sustainability perspective, it follows that if a person or population is using more land/water area than they have available to them, they are living unsustainably. On a global scale, if humans are using more resources than the earth can sustainably provide (one earth), then they are living unsustainably, and the earth's capacity to provide resources will diminish. This is where we are right now, as you can see in the image below.
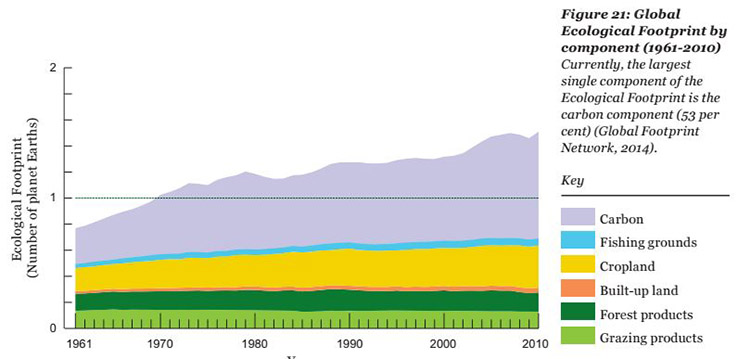
Click here for a text description.
The key points related to ecological footprint are as follows:
- We depend on the earth's natural resources for survival. If we diminish the ability of the earth to replenish natural resources through time, we are compromising our ability to survive.
- We only have one earth, and this one earth can only regenerate so many resources in a given year (produce food, filter water, pull carbon dioxide out of the atmosphere, etc.). If we compare the number of resources that are provided each year be the earth (one "earth") to the amount we use (our global ecological footprint), we can determine whether or not we are living within our ecological budget.
- If our global ecological footprint is one earth or less, we are living sustainably from the perspective of ecological footprint (note that this says nothing about the quality of life of people on the planet or the survival of specific species).
- If the ecological footprint is greater than one earth, then the stock of biocapacity will diminish over time. If biocapacity diminishes, eventually ecosystem collapse will occur, and ultimately societal collapse as well.
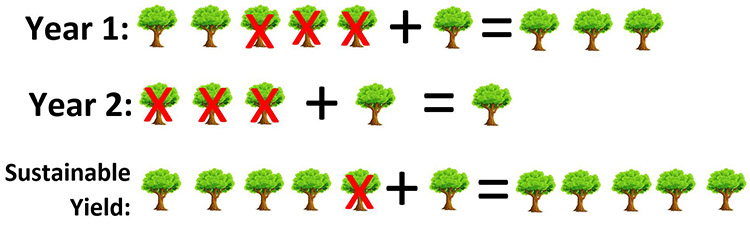
Overshoot and Collapse
Finally, I'd like to remind you of the concept of overshoot and collapse. Overshoot and collapse refers to a situation in which a critical threshold has been surpassed, but the full negative impacts of crossing that threshold have not yet become apparent. By the time those impacts have become apparent, it is too late to remedy the situation. (Feel free to read the description of what happened on St. Matthew Island [39] cited in EM SC 240N.) Humans are by-and-large good at responding to feedback, so when a situation occurs that does not provide immediate feedback, we tend to have difficulty addressing it. Climate change is unfortunately a prominent example of this because by the time the worst impacts have become reality, it will be too late to do anything about it unless we can rapidly remove the greenhouse gases from the air.
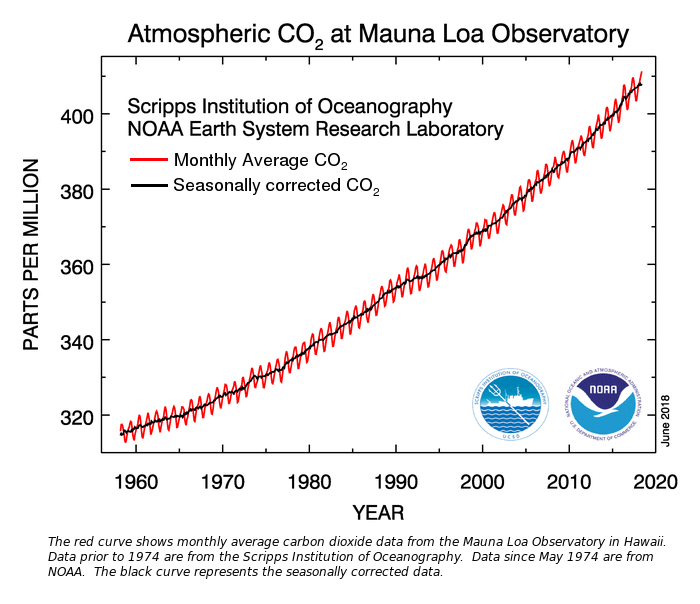
Figure 2.4: The concentration of carbon dioxide in the atmosphere has been directly measured since 1958, increasing from just above 315 parts per million (ppm) in 1958 to over 400 ppm currently. At a fundamental level, this increase is due to more carbon being emitted into the atmosphere than pulled from it.
A chart showing the global carbon dioxide increase since 1958. The line gradually increases from 315 parts per million (ppm) in 1958 to over 410 ppm in August of 2018. Seasonal fluctuations occur, but only a few ppm each year. The graph shows a steadily increasing rate from 1958 to 2018.
EROI and Sustainable Growth
Energy Return on Energy Invested
Energy return on energy invested (EROI) is a fairly straightforward concept. The following summaries key concepts and terms regarding EROI:
- Almost all end-use energy used by humans requires some energy to gather. Drilling rigs must use energy to drill for oil and natural gas, all of the components of the rigs require energy to manufacture, oil refineries use energy to turn oil into gas and other products, energy is required to transport oil and gas through pipelines, and so on. Renewable energy is no different: The silicon for solar cells must be mined and processed onto wafers, the plants that manufacture solar panels require energy to run, solar installers transport panels using vehicles, and so on. All of the energy used in providing end-use energy is considered embodied energy.
- Net energy is the difference between embodied energy and end-use energy (end use energy - embodied energy = net energy).
- By dividing end-use energy by embodied energy, you get EROI. Thus, EROI is the ratio of how much energy you get out of a process to the amount of energy required to obtain that energy. So an EROI of 4 indicates that you were provided 4 times as much energy as you used. An EROI of 100 means that you have 100 times the amount of energy that was used. And so on.
Here is the equation. (Note that "quantity of energy supplied" is the same as end-use energy and "quantity of energy used in supply process " is the same as embodied energy.):

The images below provide a snapshot of sample EROIs of various fuels provided in a peer-reviewed article by Hall, Lambert, and Balogh called "EROI for different fuels and the implications for society [42]."
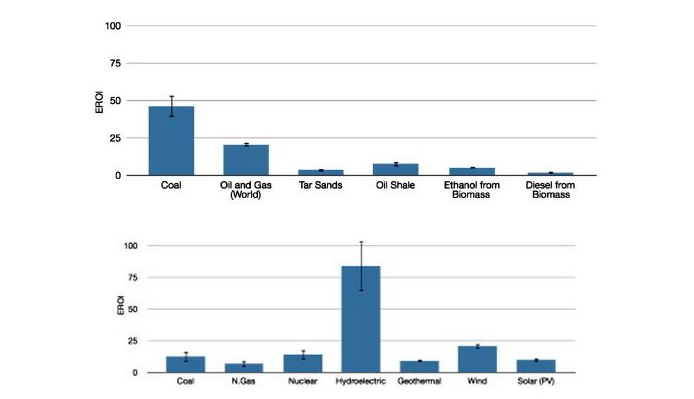
- Above 75 EROI: Hydroelectric
- Near 50 EROI: Coal
- Near 25 EROI: Oil and Gas (World), Wind
- Approximately 10-12 EROI: Oil Shale, Coal, Nuclear, Geothermal, Solar (PV)
- Near 0 EROI: Tar Sands, Ethanol from Biomass, Diesel from Biomass, Natural Gas
Why is EROI important? One of the main reasons is that EROI is more indicative of the true net energy benefit of various fuels than the end use. It takes about the energy from 1 barrel of oil to extract 20 actual barrels of "traditional" oil (it has an EROI of about 20:1), but the same amount of energy, when used to extract tar sands oil, results in only about 4 actual barrels. In other words, EROI indicates that you get about 5 times the amount of energy from traditional oil than from tar sand oil given the same amount of input. A very interesting finding in the Hall, Lambert, and Balogh article is that oil discovery in the U.S. has decreased from 1000:1 in 1919 to only 5:1 in the 2010s, meaning we get 100 times less energy now than 90 years ago! (Essentially, we have extracted most of the "easy to get" oil and do things like deep sea drilling now.) Getting ethanol from corn (recall from Lesson 1 that this is the U.S.'s primary source of biofuel) can require almost as much energy in as energy you get out, depending on how it is grown and processed.
EROI can help policymakers and others decide which energy source is a more efficient use of energy resources. In the context of this course, it is a particularly important consideration for non-renewable resources, because it indicates the net energy benefit of the sources.
One extremely important final thing to note: EROI only describes energy use. It says nothing about the other important impacts and factors. For example:
- Total energy available is an important consideration - if we can get something really efficiently (high EROI), but there is not a lot of it, then that may not help very much.
- Coal has a relatively high EROI but is the most polluting energy source we use.
- Hydroelectricity has a very high EROI, but if done the wrong way can have negative impacts as well.
- Tar sands, on the other hand, have both a low EROI and a very negative impact on the environment.
- Coal (like oil, natural gas, and nuclear) is non-renewable, and thus limited. (Though we are unlikely to run out any time soon for most of these, as you'll see in a future lesson.)
- All resources are available in limited locations and can be difficult to transport efficiently. Local/native resources may be more logical to use, even if they have a relatively low EROI.
In short, EROI is only one consideration to be made.
Sustainable Growth?
If you listen to the news, pay attention to politics, or read about business activity (no matter where you live in the world), you know that it is taken as almost a given that economic growth is good, and should be pursued ad infinitum. But you may recall from EM SC 240N that not only is growth not always good, but permanent economic growth is impossible on a finite planet unless it can be done in such a way that the total amount of natural resources on Earth remains the same year after year. In other words, as stated by Herman Daly:
"An economy in sustainable development...stops at a scale at which the remaining ecosystem...can continue to function and renew itself year after year" (Herman Daly, "Sustainable Growth, an Impossibility Theorem," p. 45)
This is one of the main points of Herman Daly's seminal article "Sustainable Growth, an Impossibility Theorem." Feel free to read through this reading, which is posted in Canvas. The following are some other important points from the article:
- Daly is careful to point out the difference between growth (getting "bigger") and development (getting "different"). The economy and society can develop forever, but cannot grow forever. A developing economy is not stagnant, even if it is not growing. An economy cannot grow forever, however, because it is a subset of the Earth, and is subject to the physical limitations that the Earth's biocapacity provides.
- He states from the outset that "sustainable growth is impossible" (p. 45). Simply put, as long as the economy is based on the unsustainable use of natural resources, economic growth cannot be sustained indefinitely.
- Sustainable development is possible only if it exists within a system that is "maintained in a steady state by a throughput of matter-energy that is within the regenerative and assimilative capacities of the ecosystem" (p. 45), i.e., we can only use resources at a rate no faster than they can be replenished, and cannot emit wastes any faster than they can be safely absorbed into/assimilated by the natural environment.
- He notes that growth has "almost religious connotations of ultimate goodness" (p. 45). This was addressed above.
- On p. 46, he is clear that one of the primary goals of the economy should be to alleviate poverty, but that simply growing GDP (or GNP) will not make that happen without some guidance and/or policies.
- He offers a few relatively straightforward policy solutions on pp. 46 - 47:
- Tax resource extraction and using the money to reduce income tax, particularly at lower income levels. (Side note: This is referred to as a revenue-neutral tax because all of the revenue is given back to the people, not the government. A revenue-neutral carbon tax has been proposed by more than one bipartisan group. See this link to the Citizens' Climate Lobby [44], and this one to the Climate Leadership Council [45], if you are interested in learning more.)
- "Renewable resources should be exploited in a manner such that: (1) harvesting rates do not exceed regeneration rates, and (2) waste emissions do not exceed the renewable assimilative capacity of the local environment" (p. 47). Sorry to sound like a broken record, but these should sound familiar.
- Finally, he proposes that: "Non-renewable resources should be depleted at a rate equal to the rate of creation of renewable substitutes" (p. 47). For example, for every 1,000,000 BTUs of fossil fuel used, we should find a renewable source of 1,000,000 BTUs. He suggests supporting this by taxing non-renewables and using the funding to develop renewable substitutes.
All of the above summarizes the concept of the steady state economy.
Optional Video
Feel free to watch a video (5:07) featuring Herman Daly, himself, discussing the steady state economy:
If we start with the total system, the Earth, then it's fairly clear that the Earth is more or less a steady state - in the sense that is not increasing in aggregate mass; it is not increasing in surface area. The rate of inflow of solar energy is more or less constant. The rate of outflow of radiant heat energy is more or less constant. – at the same amount, same amount of energy.
If that weren't the case, then temperatures will be going up. The import from outer space of materials and the export to outer space of materials are roughly equal - I mean both negligible, and usually involuntary in any case. So, the Earth as a whole, in its behavior mode is a steady state. So as the economy becomes a larger and larger subsystem of the Earth, then more and more it has to conform to the behavior mode of the whole of which it is an ever-larger part.
So in the limit, I mean the economy takes over the whole Earth, well then it’s got to be a steady state because that's the way the Earth is. And then I think it needs to approximate a steady state long before it hits that limit. And so I think that's kinda the long run idea of steady state.
Now the idea, I think there are limits, you know, long before the macroeconomy hits that physical scale limit. Long before that happens, we experience the cost of growth rising faster than the benefit. Because we're sacrificing natural services that are more important than the production benefits that we gain.
I mean, you would expect this to be a normal consequence of classical economics - the law of diminishing marginal utility: you satisfy your most pressing wants first. So, you are going to run out of important things that you need. And the Law of increasing marginal cost: you do the easiest thing, you have access to the easiest resources first, so the cost will go up there.
So, you know, what we need is to be good economists, in the sense that we measure costs and benefits and are sensitive enough to recognize the economic limit to growth, to stop when growth becomes un-economic and not be so dumb or so insensitive that we have to crash headlong into biophysical limits and really get smashed.
As John Stuart Mill said, who was the classical economist who gave the fullest exposition and the most favorable exposition of the idea of a steady state, which they referred to as a stationary state, but it meant basically the same thing… He says it by no means implies any stationary state of human welfare. There will be as much room for moral and ethical and technical improvement as there was in a growth economy. And much more likelihood of it happening, in a way, because when you close off physical growth then the path to progress has to be moral and technological and intellectual and informational. You’ve switched the path to progress from this physical more and more stuff to a qualitative improvement of the same amount of stuff.
And, how far we can go in that direction? Uh, you know, who knows, but regardless of how far, why not, so we're gonna have to go in that direction.
So, let’s do it, and if we're lucky it won't be all that costly. It will be a great deal of moral improvement because I rather expect that we will…it will go well in that way because the material, the attempt to satisfy our wants by material growth was a little bit like scratching in the wrong place. You know, you’ve got a real itch, but you are just clawing somewhere and it doesn't help.
So at least I think this will help us to scratch in the right place if we devote our attention to moral and technical progress.
Free Market Environmentalism
It should not be difficult to recognize that humans are subject to the physical constraints of planet Earth. But how we make sure that we do not exceed our limit to the point of collapse (e.g., overshoot and collapse mentioned previously) is something that is debated, even by people with seemingly the same end goals. There is a branch of environmental (well, it's primarily economic) thought that is based on the power of free markets to most efficiently manage resources. This is often called free market environmentalism (FME). Those who advocate for FME believe that free markets (economic systems that are free from government regulation) are the best way to solve environmental problems. And, just as important, they believe that the government is much worse at managing resources than the market. This article from the Library of Economics and Liberty [46] (a free market think tank) summarizes the school of thought pretty well.
As outlined in this article, this school of thought rests on three assumptions in order for markets to work for any environmental good (e.g., a forest, clean water, clean air, etc.): "Rights to each important resource must be clearly defined, easily defended against invasion, and divestible (transferable) by owners on terms agreeable to buyer and seller" (source: Library of Economics and Liberty [46]). In other words, if a piece of property has:
- clear ownership, and
- those ownership rights are defensible in court (or elsewhere), and
- it can be bought and sold freely, it will be preserved.
I would add that (4) the author (and this is typical of FME) also assumes that the owner of the property is motivated to protect the property in anticipation of future profits.
For example, if I own a lake and someone pollutes it, if the courts are just, the polluter will end up paying me because (s)he compromised my ability to enjoy my property. If these conditions are known, then the polluter, in theory, will decide not to pollute in order to avoid the extra cost. As you can see, all of this relies on using money as the motivating factor.
This is a very sound argument as long as those conditions are met, at least in terms of environmental protection. This situation, and variations of it have been proven effective in a wide array of applications. It worked for water conservation in the Western U.S. [47] And here are a number of case studies [48] demonstrating that these principles can work.
But what if those four conditions are not met? With climate change, a fundamental question is: "Who owns the atmosphere?" (The answer: no one does.) If there is no clear ownership, the system may not work. Let's go back to my lake that got polluted, and think about a few plausible scenarios.
- What if it was impossible to prove where the pollution came from? If it was airborne pollution that is impossible to trace, I am out of luck. I have no one to sue. This is, unfortunately, the case for a lot of types of pollution.
- What if I can make more money destroying my lake than preserving it? I could fill it in and build an apartment on it. Or sell it to a chemical company to use as a dumping ground. If I place a certain economic value on my lake, then it stands to reason that I would be willing to destroy it if I could make more money by doing so. I could use the money to move on and buy more property. The case studies noted above hinge on a party or parties agreeing that conservation is necessary.
- This type of system is based on the perceived value being the real value, which can also cause problems. Biodiversity (which we will go over in the coming lessons) is something that very few people place value on but is essential for human survival. Also, there are certain goods that are nearly impossible to accurately price, even using Willingness to Pay analysis. Negative impacts on future generations is one that is particularly sticky in this regard. (Remember intergenerational equity?)
- Finally, by basing everything on money, those without money will have less access to the resource. If you recall from Lesson 1, this fits squarely with one of the fundamental sustainability principles (social equity). If I charge people a lot of money to fish in my lake, that may help preserve the lake, but at the expense of equity.
This article from the Property and Environment Research Center [49] - also an advocate for free-market environmentalism - goes over a few of these and other examples where the system breaks down.
Food for Thought
It should be apparent at this point that humans cannot continue to live beyond the planet's ecological means and expect to survive. We have one "Earth's worth" of replenishable resources, and as we diminish that stock of resources by using them faster than they can be replenished and/or emit wastes faster than they can be absorbed, we reduce our ability to survive. Many different ways to achieve such a steady state economy (or something close to it) have been posed. Some people, such as Herman Daly, propose using taxes, incentives, and other policy-based solutions. Others advocate unleashing the power of economic markets to solve the problem, mostly through privatization. Please note that even the most ardent advocates [50] of regulation recognize that markets are extremely effective and efficient at allocating resources, but that they do not work well under a number of circumstances, e.g. when negative externalities artificially lower prices, and when impacts are not immediately felt (e.g. with climate change). Because of the massive externalities - particularly with regards to intergenerational equity, i.e. the impacts of today's actions will be felt by future generations - even free-market proponents recognize that it is not a problem that can easily be solved by markets.
Hopefully, by reading through and thinking about these issues, you will not simply take for granted that "growth is good," regardless of the circumstances or consequences. Daly himself concedes that growth can be good as long as it helps alleviate poverty, but ultimately we must reach a steady state economy if we are to establish a sustainable society.
Development, Quality of Life, Social/Environmental Justice
The Inadequacy of GDP
GDP is the most oft-used metric to indicate how a country "is doing," economically speaking. But it is also widely used as a general indicator of how a country's people are doing. There is some usefulness to this, as you will see below. But GDP obscures a lot of possible problems (economic, social, environmental, etc.), and does not indicate all of the good things about society. In short, there are some things that are good for GDP that are bad for people, and there are some things that are good for people that are not necessarily good for GDP. This problem was eloquently described by Robert F. Kennedy in 1968. It is as relevant today as it was 50 years ago. Hopefully, this will give you some pause when you hear the latest GDP numbers as an indicator of how well a country is doing.
Too much, and for too long, we seem to have surrendered personal excellence and community values in the mere accumulation of material things. Our gross national product now is over 800 million dollars a year. But that gross national product - if we judge the United States of America by that - that gross national product counts:
- air pollution and
- cigarette advertising
- and ambulances to clear our highways of carnage.
It counts special locks for our doors and the jails for the people who break them. It counts the destruction of the redwoods and the loss of our natural wonder in chaotic sprawl. It counts napalm and it counts nuclear warheads and armored cars for the police to fight the riots in our cities. It counts Whitman's rifle and Speck's knife, and the television programs which glorify violence in order to sell toys to our children.
Yet the gross national product does not allow for the health of our children, the quality of their education or the joy of their play.
It does not include the beauty of our poetry or the strength of our marriages, the intelligence of our public debates or the integrity of our public officials. It measures neither our wits nor our courage. Neither our wisdom nor our learning, neither our compassion nor our devotion to our country. It measures everything, in short, except that which makes life worthwhile, and it can tell us everything about America except why we are proud that we are Americans.
Quality of Life
Quality of life is another one of those terms that is thrown around liberally but has no specific definition. We all want a high quality of life, but what does that mean exactly? I am not here to settle the debate, but I do like the definition from this website [51]: Quality of life is "the extent to which people's 'happiness requirements' are met." I'd add the term "satisfaction" in there as well, as in "are people's 'satisfaction' requirements met?" Nothing is universally regarded as necessary for happiness or life satisfaction. For example, I have friends who LOVE to hunt for deer and will sit for hours in a tree stand in the freezing cold, silently waiting for one to walk by. I can think of a lot of things that I'd rather do than that. But to them, that is an important part of their quality of life. Nothing wrong at all with that, by the way - it's just not for me.
Hunting is something that is obviously not universally required for a high quality of life. But I'm sure there are thousands, if not millions, of people who count it as important. But if you think about it, there is nothing that everybody loves to do, so it wouldn't matter which activity I used as an example. So, if we want to measure the quality of life, how do we do it?
Development
Before we move on to the discussion of how to measure the quality of life, it is important to consider the concept of development. Development refers to how well the people in a country are doing, as in "How developed is country X?" or these are the "underdeveloped countries." Please note that many people (myself included) take issue with categorizing an entire country full of people using a single western-centric, judgmental term, which is why I use terms such as "(less) industrialized" or "high/low income" countries. These terms are objective descriptors, not judgments. Regardless, GDP and/or GDP/capita play primary roles in defining the level of development of a country, as do things such as having modern economic and political systems. There is some validity to this, but as RFK and others point out, GDP is not everything! A few more aspects of development worth pointing out (some of which are described in this reading from the World Bank [52]) are as follows:
- GDP/capita indicates nothing about the distribution of wealth. It is possible (e.g., in Equatorial Guinea) to have a high GDP/cap but to still have a large portion of the population having very little access to resources.
- Having a relatively high GDP does provide the potential for development - it is difficult to thrive in the modern world without some money, after all - but does not mean that all people have access to health care, education, and other things that contribute to a high quality of life. Generally speaking, having a higher GDP indicates that the people in a country are doing relatively well, but this is not always the case.
- Related to the previous point, GDP should not be misconstrued as the goal of development. High quality of life should be the "end," and economic development is only one means to that end.
- It is important to keep in mind that unless the economy is structured in an environmentally sustainable manner, the ability to provide a high quality of life will diminish over time.
Quality of Life Metrics
There are many possible factors that contribute to the quality of life, or lack thereof. So how do we measure quality of life? For that, we need a quality of life metric. These are often referred to as development indices. Recall from Lesson 1 that it is important to be able to measure aspects of sustainability. Development indices are one aspect of this.
There are two approaches to this:
- On the one hand, we could try to directly measure the quality of life itself.
- Conversely, we could try to quantify the conditions that lead to a high quality of life.
There have been many attempts to do the latter and a few that have tried to do the former. It would be impossible to research all of these, but some of the most used and/or most useful ones are listed below. The first two (HDI and Inequality-Adjusted HDI) measure things that lead to a high quality of life, the third one (Happiness Index) attempts to measure it directly, and the last one (Happy Planet Index) is a mixture of the two plus ecological footprint. Please note that even the best metric cannot create a full picture of development, however it is measured. Even the most "developed" country will have people who are living in poor conditions. Also, keep in mind that this is not a comprehensive list of development indices.
Human Development Index (HDI)
The Human Development Index is the most well-known quality of life metric. It was created by the United Nations (UN), who assesses it every year. It measures three things to determine quality of life, as you will see below: living a "long and healthy life, being knowledgeable, and hav(ing) a decent standard of living." The HDI scale goes from 0 (the worst possible) to 1 (the best possible). Feel free to read the description from the UN here [53], and browse through the ratings here [54].
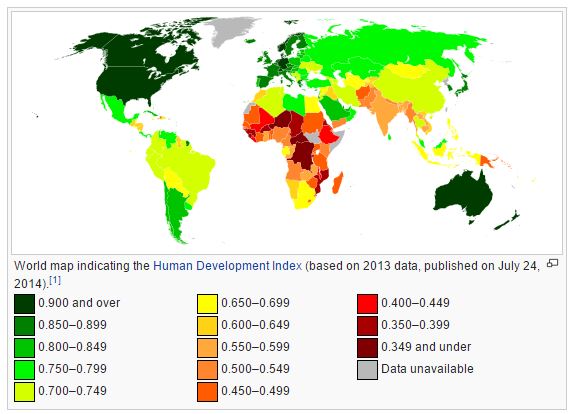
Inequality-Adjusted Human Development Index (IHDI)
The UN also publishes Inequality-Adjusted HDI (IHDI), which takes HDI and discounts it according to how equally the individual development metrics are spread across the population. If the Inequality-Adjusted HDI is lower than a country's HDI, then there is some inequality. As noted by the UN, the IHDI represents "the loss to human development due to inequality." The more inequality, the more the HDI score drops when adjusted for inequality. Note that the pattern in the map below is similar to the HDI map above, but the raw values are a little bit lower. Feel free to read more about IHDI here [57].
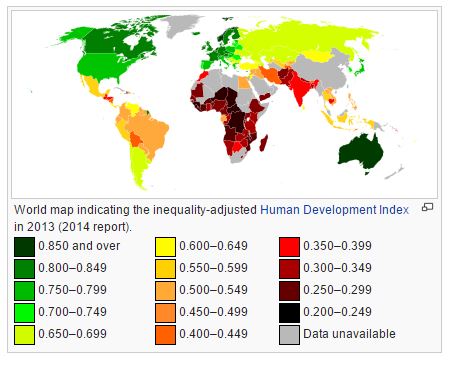
World Happiness Index/Report
The World Happiness Report asks people to indicate on a scale of 0 - 10 their quality of life now and their expected quality of life in the future (see World Happiness Report details here [60], if you'd like). The basic premise behind this is that if you would like to determine how happy or satisfied someone is with their life, just ask them. This is a type of self-reported quality of life and results in a score of 0 - 10. This is sometimes referred to as the Happiness Index.
Pretty simple, right? Though it does beg some important questions. For example, if someone lives a short life with little education, but they are happy, does it matter? What about someone that has very little freedom, but is happy? What if they have almost no money, but are happy? What if others in their country lead much "better" lives, but they do not know it? I do not have the answers, but they are important questions to think about.
Happy Planet Index
Last but not least, we have the Happy Planet Index. This index takes into account both well-being (they use the same metric as the Happiness Index), life expectancy (like the HDI), and inequality of outcomes. The higher your well-being and life expectancy, the higher your score. Inequality is expressed as a percentage, with a higher percentage meaning more equal outcomes. But what is unique about the Happy Planet Index is that it divides by the ecological footprint, so a higher ecological footprint will result in a lower score, and vice-versa. Nic Marks created this index. He describes it in the short (1:54) video below if you are so interested. Also, you can read more about HPI here [61].
Optional Viewing
Everybody wants to live a good life, and I presume we want people in the future to live good lives. We created that the happy planet index really to highlight the tension between creating good lives now and good lives in the future.
Because we think people should be happy and the planet should be happy, why don't we create a measure of progress that shows that? And what we do is we say that the ultimate outcome of a nation is how successful is it at creating happy and healthy lives for its citizens? Economic activity tends to be taken as a sign of the sort of strength and power of a nation, and yet all it is, is just economic turnover.
What the happy planet index does is, it takes two things really: it's looking at the well-being of citizens in countries and then is looking at how many resources they use.
It creates what we'll call an efficiency measure: it says how much well-being do you get for your resources? It's like a miles per gallon, bang per buck indicator.
Running horizontally on the graph, ecological footprint is how much pressure we put on the planet. More is bad. Running vertically upwards is a measure called happy life years. It’s like a happiness adjusted life expectancy, and the yellow dot there you see is the global average.
The challenge really is to pull the global average up here. That's what we need to do. And if we're going to do that, we need to pull countries from the bottom, and we need to pull countries from the right of the graph, and then we're starting to create a Happy Planet.
You can download the report, you can check out your own personal HPI score. That’s the first global index of sustainable well-being.
Social Justice
There is no single definition for social justice, but take a moment to think about the definition of social justice from the National Association of Social Workers [62], who provide a good, concise definition:
Social justice is the view that everyone deserves equal economic, political and social rights and opportunities.
Ultimately then, social justice is about equal rights and opportunities, which is a near-universal ideal of democratic and moral societies. Not so bad, right? But let's unpack that definition a little before we move on.
First, it is important to point out that they use the word, everyone. This seemingly innocuous word actually lies at the core of social justice! I'm sure you can think of many historical and contemporary examples of unequal rights being granted to groups of people. Examples abound of discrimination against people of certain ethnicities, races, religious beliefs, sexual orientations, income levels, genders, and more. Social justice requires such characteristics and qualities have no bearing on rights and opportunities. Let's take a look at each of the "types" of opportunities indicated in the definition above.
- Having equal political rights and opportunities refers to everyone having equal ability to participate in all political processes. The most basic aspect of this is the right to vote, but also entails equal opportunity to vote (e.g., by not being subject to voter suppression or intimidation), equal ability to run for office, equal ability to influence political decisions (e.g., by money not being very influential in politics), and more.
- Equal economic rights and opportunities essentially refers to everyone having reasonable access to rights and opportunities that can result in economic security and stability. This includes things such as access to jobs with livable wages, access to good education and training, and fair lending practices.
- Equal social rights and opportunities overlap significantly with economic rights and opportunities. Social rights include things like education, safe neighborhoods, health care, legal protection, access to transportation, access to healthy food, freedom to practice religion, and more.
Please keep in mind that social justice requires equal access to these rights and opportunities. If someone has access to a good education but does not take advantage of it, that is on them. But if they do not have access to it in the first place (e.g., by college being too expensive or public schools in low-income areas being underfunded), that would be considered social injustice. Conceptually, this is straightforward, but practically speaking it can be difficult to determine where injustices occur because the lines between having opportunities and taking advantage of the opportunities is not always clear.
Environmental Justice
Environmental justice is very closely related to social justice. It is the notion that everyone should have equal rights and opportunities to access a reasonably clean environment. Things like clean air, a safe water supply, and natural areas to enjoy are not available to all. In short, environmental "goods" and "bads" are unevenly distributed. The short video below does a great job of illustrating this phenomenon.
Optional Viewing
Where we live in society plays a huge role in the environmental benefits and risks that we're exposed to. And, I'm gonna actually draw in different parts of society by using this line which represents a spectrum of society. On the right hand side, I'm gonna draw part of society that experiences higher poverty and also incorporates the often disadvantaged racial and minority groups. On the left hand side, I'm gonna draw a much wealthier part of society. One of the things that we know is that living areas that experience high poverty and have a lot of racial minorities often have few environmental benefits compared to the wealthier part of society. What do I mean by environmental benefits? I mean green spaces, parks, recreational areas. What does that look like? Well, let me draw it for you, using this triangle. This is supposed to represent environmental benefits. And one of the things we can see is that the wealthier part of society has much higher benefits than the high poverty and racial minority part of society. And as I mentioned, those benefits include things like parks, bike paths, and other green spaces. So one part of society seems to be getting a lot of benefit while another part of society seems to not be getting as much benefit. But what the high poverty and racial minority part of society does get, it does get something, and what it does get, it gets a lot of environmental burden.
So what does that look like? This line is actually supposed to represent increasing burden. So compared to the high income part of society the high poverty and racial minorities get increasing burden. And this includes things like waste facilities, manufacturing and factories, energy production, and transportation facilities such as airports. And one of the things we have to consider is that these are disadvantaged populations, they are really at risk because they're disadvantaged in many ways. They often have few alternatives in terms of where they work and where they live. They may have little awareness of the risks they may face being exposed to various environmental risks or pollutants or chemicals. They may also have other pressing issues, meaning that environmental issues are low on their agenda and let us contrast that to the wealthier population. The wealthier population may very well be more politically powerful, they can also be economically powerful, literally being able to demand that the environmental beneficial facilities are placed close to them, and the burdensome facilities are placed far away. And being able to control things like laws and regulations to benefit them more so than the other communities. And they can also be better represented in environmental groups or lobbying groups. Now this is all of significance when we consider that the high poverty groups and racial minorities may have health problems such as asthma or obesity, because we know conditions like asthma have got strong correlations to environmental issues such as pollutants, particles and ozones, and these are part of the environmental burdens that these populations face. And also when we consider obesity, obesity can be thought of as a lack of access to safe recreational facilities where people can exercise. So a lack of access to environmental benefits, and lack of access to affordable grocery and shopping facilities. The big concept here, that I want to write down is the concept of environmental justice. And what this concept really looks at is that there is a fair distribution of the benefits and burdens, of the environmental benefits and burdens within society, across all groups. And as we can see here, that is clearly not happening at the moment, and much action still needs to be taken.
You may have caught the narrator's definition of environmental justice:
A fair distribution of environmental benefits and burdens across all groups.
This sums it up quite well, though it does leave the door open for some wiggle room in what it specifically means. Take another look at the definition. Do you see anything that might be open to interpretation? How about the word "fair"? This is most definitely open to interpretation, but perhaps that is done on purpose. Similar to the economic aspect of social justice, it is not reasonable to think that everyone will have equal access to all environmental goods and equal exposure to all environmental bads. But what we can strive for is to try to provide equal opportunities to access for as many people as possible.
Final Note on Social and Environmental Justice
You would think that establishing societies that provide equal rights and opportunities to all would not be controversial. The thing about it - this is is widely considered one of the (if not the primary) core values of American society. Yet, social and environmental justice are often some of the most controversial aspects of sustainability. Though there are, unfortunately, many that do not believe that everyone should have equal rights, more often the controversy arises as a result of the application of solutions to social and environmental injustice. There are many reasons for this, but some important ones are as follows:
- By their very nature, fixing social justice issues requires altering the power structure of a given area or society. When women and black Americans were given the right and opportunity to vote in the U.S., it reduced the power of white males. If lobbying activity is restricted, the companies they work for would have less influence, and so on. Those with power tend to try to hold onto it, and because they are already powerful, it can be difficult to stop them.
- There is often a strong ideological resistance to new regulations. Regulation is often posed as solutions to address social and environmental injustice, e.g., by taxing companies and wealthy individuals to subsidize those of lower incomes, taxing companies that pollute or otherwise damage local environments, and so forth.
- The root cause of many of these problems cannot easily be fixed, even with the best-intended policies. For example, urban and rural poverty - both in the U.S. and abroad - is a complex, deep-seated problem that does not have an easy solution. There is no "magic bullet" to fix them. It's difficult to blame businesses for wanting to locate in wealthier areas where people have more money to spend, for example.
- Finally, it is very important to note that providing equal opportunity sometimes requires what some would consider "unequal" treatment. For example, many social and environmental justice organizations provide more resources to low income individuals than those with higher incomes. This can seem unfair to those not eligible for benefits. ("Why won't the government subsidize my housing and childcare?" "Why do I pay more taxes, just because I've made more money through my hard work?")
The goal of those concerned with social/environmental justice is to provide equal opportunity for all people, and there is wide recognition that many people are born at a disadvantage through no fault of their own. In general, social justice advocates err on the side of providing extra assistance and/or helping empower all who might need help, regardless of how they got into their circumstance. We live in a VERY unequal world, and those concerned with social justice want to change that.
Summary and Final Tasks
Summary
By now you should be able to:
- define and provide examples of negative externalities;
- analyze the implications of achieving a steady state economy, and how they relate to ecological footprint;
- identify the pros and cons of energy return on energy invested;
- describe the (in)adequacies of using GDP as a development metric;
- analyze the viability of various development metrics;
- define social and environmental justice;
- identify examples of social and environmental (in)justice.
Reminder - Complete all of the Lesson 2 tasks!
You have reached the end of Lesson 2! Double-check the to-do list on the Lesson 2 Overview page [63] to make sure you have completed all of the activities listed there before you begin Lesson 3.
Lesson 3: EM SC 240N Lesson 3 Review
Overview
The purpose of this lesson is for you to review key concepts from Lesson 3 (Critical Thinking and Specific Sustainability Issues) in EM SC 240N. I strongly encourage you to at least browse through Lesson 3 [64] of EM SC 240N, though that is not required.
Learning Outcomes
By the end of this lesson, you should be able to:
- analyze the credibility of information sources;
- identify characteristics of the Anthropocene;
- explain how the greenhouse effect increases the average surface temperature of the earth;
- identify evidence for anthropogenic climate change;
- identify characteristics of the 6th Mass Extinction;
- explain the benefits of biodiversity;
- analyze the sustainability impacts of freshwater availability; and
- apply the precautionary principle to sustainability considerations.
Lesson Roadmap
| To Read | Lesson 3 Online Content | You're here! |
|---|---|---|
| To Do |
|
|
Questions?
If you have any general course questions, please post them to our HAVE A QUESTION discussion forum located under the Discussions tab in Canvas. I will check that discussion forum regularly to respond as appropriate. While you are there, feel free to post your own responses and comments if you are able to help out a classmate. If you have a question but would like to remain anonymous to the other students, email me through Canvas.
If you have something related to the material that you'd like to share, feel free to post to the Coffee Shop forum, also under the Discussions tab in Canvas.
Critical Thinking and Critiquing Information Sources
Critical Thinking
There has never been a time in human history where such a massive quantity of information is readily available to most people, but the ease with which information can be shared has led to an abundance of questionable information. As the adage goes, "You can always find someone that agrees with you on the Internet" (okay, maybe that's not an actual adage, but you have to admit it is difficult to disagree with it.) At any rate, enter critical thinking, an essential skill to have in our modern information-overloaded world.
Feel free to read through The Foundation for Critical Thinking [65]'s definition of critical thinking (here) [66]. The summary is as follows:
- Critical thinking requires a skilled evaluation of information using all manner of analytical and observational tools at your disposal. Regardless of what you are analyzing, you should use the same or similar set of skills. Critical thinking transcends the subject material.
- Critical thinking requires self-evaluation of what you know and do not know, your assumptions, the scientific basis of the problem at hand, and an analysis of the results. One aspect of this is looking at issues from viewpoints different than your own, to the extent possible.
- Critical thinking requires more than just "knowing things" and having information processing skills. You must apply this knowledge and these skills, and accept the results, whether they are the results you had hoped for/expected or not.
- If you are seeking selfish (subjective) motives, you may be able to think critically, but the results will usually be flawed. You must approach the issue with "intellectual integrity," which really refers to the above three points (thorough analysis and acceptance of the results).
- No one knows everything, and everyone is subject to bias by virtue of being limited in knowledge and experience. You can be an extremely skilled critical thinker but are limited by your knowledge and experience of the topic at hand. The best critical analysis may arrive at an incorrect conclusion due to this. The flip side of this is that the more you know about, experience, and objectively analyze a piece or type of information, the more likely you are to arrive at a sound conclusion. As stated in the article: "The development of critical thinking skills and dispositions is a life-long endeavor."
They also provide a good approach to critical thinking:
A well cultivated critical thinker:
- raises vital questions and problems, formulating them clearly and precisely;
- gathers and assesses relevant information, using abstract ideas to interpret it effectively;
- comes to well-reasoned conclusions and solutions, testing them against relevant criteria and standards;
- thinks open mindedly within alternative systems of thought, recognizing and assessing, as need be, their assumptions, implications, and practical consequences; and
- communicates effectively with others in figuring out solutions to complex problems.
Credit: The Foundation for Critical Thinking [66]
I am asking you to apply these principles as much as possible. Keep an open mind, and try to analyze information using evidence, logic, reason, and with an eye on alternative viewpoints. Try to recognize the limitations of your knowledge, and attempt to be self-critical with regards to biases and limited worldviews that you have. Embrace discussion with others, and try to approach discussions with the intent of learning from each other to come to a reasonable conclusion, not to convince the other person that you are correct.
Critiquing Information Sources
In addition to critical thinking, assessing the quality of sources of information is an important part of determining whether or not the information is reliable. Though there is no universal method of doing this, with some practice (and knowledge) you can usually determine source validity with relative confidence.
Optional Reading
- "Harvard Guide to Using Sources [67]." Feel free to read through the entire webpage, but the key tabs for our purposes are "Questions to Ask About All Sources," "Evaluating Journal Articles," and "Evaluating Web Sources."
Here are some general and additional tips for analyzing sources:
- Always consider the author's credentials. This is not the only thing to look at, but it is an important element. All else being equal, someone who has spent many years analyzing a subject or has advanced training is more likely to be reliable than someone with thin credentials.
- Be careful when using a source that is expressly opinion-based, e.g., in the Opinion pages of the newspaper (hard copy or online). An opinion is not necessarily wrong - there are certainly such things as "well-informed" opinions - but you should not use this as an academic reference. Opinions from people you trust are a great way to learn things, but you should not use them as unvarnished truth. Always seek to corroborate the information provided.
- As indicated by the Harvard articles, I strongly suggest corroborating factual information presented in the article elsewhere (in general, not just for opinions).
- As indicated in a previous lesson, peer-reviewed journals are generally the most reliable information sources. When not peer-reviewed, consider where the factual information came from. Often, non-peer reviewed articles use data from peer-reviewed sources. You should always try to find the original material if possible.
- Related to the previous point, always consider where the author got their information from (check their sources!).
- Currency is important for some sources (especially for things like technology), but for others, it is less important (e.g., historical events, foundational theories). Use your best judgment.
- If you don't know already, do some research on the author of the article. Use Google to your advantage! You can search "<author or organization's name> bias" or "is <name> biased," etc. I strongly suggest searching for other articles/websites published by the author/organization. Oftentimes, you can click on the author's name on the website and it will link you to other articles written by them. Scan through them and see if a consistent bias (or at least worldview) is presented. It will often become obvious if someone holds a certain political/social viewpoint.
- The same advice as the previous point goes for the site owner - look through articles published on the website, and try to figure out if a one-sided viewpoint is presented. All that said, keep in mind that just because someone holds a certain worldview does not mean that the information is unusable (complicated, I know!). There are many reliable information sources (people and organizations) that hold a certain worldview. You should consider the other aspects of the information, particularly the objectivity. Also, keep a lookout for consistently extreme viewpoints.
- Do NOT take a website's self-description as proof of its objectivity. I wish it were that easy! Even the most biased of sources want you to believe that they are unbiased.
- Just because a website is a ".org" and not a ".com" does not mean it is unbiased. In fact, the type of organization is pretty meaningless. There are a lot of biased non-profits out there.
When analyzing sources in this course, I'll ask you to do the following things:
- The most reliable type of information is taken directly from a peer-reviewed article. If you pull your information directly from such an article, you just need to state the journal and the author, then provide some information about the author, per the next step.
- Analyze the author's credentials. Are they an authority on the subject? Do they have years of experience and/or an advanced degree in the topic? Are they a well-respected writer? Have they won journalism, academic, etc., awards?
- Consider the objectivity of the way the information is presented. Is it matter-of-fact/objective or does it use sensational/emotional language? Does the author appear to inject opinion and/or use language that tries to get an emotional response?
- Consider the objectivity of the site the information is on. Investigate other articles on the website to see if there appears to be an agenda.
- Reliability. Can you find other reliable sources that have the same information? Corroborate the information.
Overall, understanding the reliability of sources gets easier with time. The keys are a) to keep reading and paying attention to other information sources, b) to constantly investigate the reliability of sources, and most importantly c) learn as much as you can! The more you do this, the more you will develop a "bias detector," so to speak.
The Anthropocene and Biodiversity
Living in the Anthropocene and Recognizing Planetary Boundaries
To Read Now
- Skim through the most up-to-date status of the 9 Planetary Boundaries [68]. This link takes you to the Stockholm Resilience Center, which is where the 9 Planetary Boundaries concept originated. (Not required, but you can access a downloadable, resizeable image of the Planetary Boundaries here [69].)
- "Ecosystem Services [70]." National Wildlife Federation.
- (Optional) Read pp. 19 - 22 of chapter 2 of Sustainability Still Possible?. "Respecting Planetary Boundaries and Reconnecting to the Biosphere." This is located in the Module tab in Canvas, under Lesson 3.
- (Optional) Feel free to read through some critiques of the 9 Planetary Boundaries concept, as well as responses from the authors [71]. This is not required, but it is enlightening if you are interested in this concept. (Access a .pdf version of these critiques/responses [72], in case you cannot access the previous link.)
The following is a summary of some key points from the readings:
- The National Wildlife Federation [73] defines an ecosystem service as:
"any positive benefit that wildlife or ecosystems provide to people."
Examples include plants that convert carbon dioxide into oxygen, fisheries that naturally replenish themselves and feed humans, wetlands that filter toxins and mitigate storm impacts, soil organisms that foster plant growth, and bees that pollinate food crops and other plants. We could cite innumerable examples, but without ecosystem services, life on earth would not be possible. Further, much of what we depend on for survival is offered for free by nature. Most ecosystem services are performed by the biosphere, which "includes all living organisms on earth, together with the dead organic matter produced by them." (Credit: Encyclopedia of Earth [74]).
- Folke starts out with a brief discussion of the biosphere, which is "the living part" of the area on and near the earth's surface.
- He points out that humans have become "a dominant force in the operation of the biosphere."
The time that we find ourselves in now is what he terms the "Anthropocene," which he defines as "the age in which human actions are a powerful planetary force shaping the biosphere."
- Note that the term "Anthropocene" is well-known in scientific circles - Folke is nowhere near alone in using it! Regardless, the unprecedented success of the human species during this time has "to a large extent...been enabled by the human ability to draw on the functioning of the biosphere." He notes that ecosystem services (e.g., "fertile soils, storm protection, and sinks for greenhouse gases and other wastes") have played an essential role in humanity's success.
- He points out that there have been many positive benefits to people, but that we are overburdening the biosphere and risk "undermin(ing) the capacity of life-supporting ecosystems to...provide the essential ecosystem services that human well-being ultimately depends on."
- If we humans are to continue the success that we have realized in the past few thousand years, he believes that we need to work on reducing our ecological impact to the point that ecosystems can continue to thrive and provide essential services. In order to do this, he points to the need to measure our impact in "critical biophysical processes in the Earth's system." These are termed the "nine planetary boundaries."
- The nine planetary boundaries provide metrics that can be analyzed to determine if humans are overusing ecological capacity. They are called "boundaries" because they represent indicators of when we have crossed into dangerous territory. He is careful to point out that there is some uncertainty with some of the boundaries, but that they provide the best scientific analysis of whether or not humanity is operating within safe ecological limits.
 [75]
[75]
Why call it the Anthropocene?
So where does the term Anthropocene come from? You may remember the concept of the geologic time scale [77] from Geology or Environmental Science class, which is how the earth's history is separated into different time periods called eons, eras, periods, epochs, and ages. (Refer to this chart from the Geological Society of America [78] for details.)
The Holocene epoch began around 10,000 years ago and saw the beginning of agriculture and thus permanent human settlements. The term "Anthropocene" is a deliberate reference to the fact that humans have become such a dominant force in the world that many scientists consider it to be a new geologic epoch. "Anthro" refers to "humans" (remember anthropocentric from an earlier lesson?), which is why it is referred to as the Anthropocene.
Biodiversity
The American Museum of Natural History in New York defines biodiversity thus:
The term biodiversity (from 'biological diversity') refers to the variety of life on Earth at all its levels, from genes to ecosystems, and can encompass the evolutionary, ecological, and cultural processes that sustain life. Biodiversity includes not only species we consider rare, threatened, or endangered, but also every living thing — from humans to organisms we know little about, such as microbes, fungi, and invertebrates.
Credit: U.S. Museum of Natural History [79]
Biodiversity is the variety of life on earth, encompassing everything from the largest ecosystem to strands of DNA. It is in every living thing around us, and everything around us is part of it. I know, this all seems very poetic, and nature can be appreciated merely by virtue of its own beauty and diversity. But there are some practical, and even selfish reasons to care about biodiversity, as you will see in the readings below.
Optional Reading
- "How does biodiversity loss affect me and everyone else? [80]" World Wildlife Foundation (Note the description of ecosystem services at the bottom.)
- E.O. Wilson Biodiversity Foundation - Introduction [81] (Please watch the video as well.)
- E.O. Wilson Biodiversity Foundation - The Diversity of Life [82]
There are many reasons to care about biodiversity. Aside from the huge economic benefits of ecosystem services, we depend on the biosphere - and by extension, biodiversity - to sustain human life. We depend on ecosystem services for food, shelter, clothing, water, and even our oxygen. So yeah, basically everything we need to physically survive!
Life on earth is connected in innumerable ways, and compromising one part of an ecosystem - including a single organism - has impacts in other areas. Unfortunately, human activity is playing a major role in ecosystem damage, including species extinction. Wilson points out [82] that:
"Species are disappearing at an accelerating rate through human action, primarily habitat destruction but also pollution and the introduction of exotic species into residual natural environments."
Biodiversity is a key aspect of ecosystem services, and ecosystem services are essential for human survival. One thing that makes biodiversity difficult to manage is that we don't know how many species exist, and by extension do not know exactly how many are going extinct each year.
The 6th Mass Extinction
So how much danger are we in, and how do we know? As it turns out, it is possible to measure - or at least scientifically estimate - the rate at which biodiversity is dropping. As Carl Folke pointed out in Chapter 2 of Is Sustainability Still Possible?, the rate of biodiversity loss as one of "The Nine Planetary Boundaries." The metric used to quantify this loss is the background extinction rate, which is defined as the number of species going extinct every year. So, how are we doing on this front? Some recently published studies can shed some light on this issue.
Optional Reading
- "Sixth mass extinction: The era of 'biological annihilation' [83]." John D. Sutter, CNN.
- "Stanford researcher declares that the 6th mass extinction is here [84]." Rob Jordan, Stanford News, or read the full, peer-reviewed article [85].
Sutter starts out by stating: "Many scientists say it's abundantly clear that Earth is entering its sixth mass-extinction event, meaning three-quarters of all species could disappear in the coming centuries." A mass extinction event is when more than 50% of the world's species disappear in a relatively short period of time (hundreds to thousands of years), according to National Geographic [86]. There have been five mass extinction events in earth's history. The last one was around 65 million years ago when the last of the dinosaurs famously went extinct.
It's not every day that you read a serious article that quotes a knowledgeable person as stating that: "What is at stake is really the state of humanity." Alas, that is where we find ourselves on this issue. There is unequivocal evidence that populations of many species have dropped considerably since humans became the dominant species, and as the article states, the background extinction rate is probably at least "100 times what would be considered normal" (see the optional reading above for some insight on this), which may be a conservative estimate. As indicated in the article, there is some controversy regarding this issue - the Atlantic article [87] that Sutter links to provides a good, even-keeled assessment of some of them - but this primarily has to do with difficulty in determining the rate of extinction, and whether or not it should be considered a "mass extinction" or just a dangerous level of it.
Whether a true mass extinction event is happening or not, we do know that humans are causing species to go extinct at an accelerated rate for a variety of reasons, including land use change (especially food production), poaching, climate change, ocean acidification, and more. It is important to point out that it is very unlikely that we have crossed an extinction threshold from which we cannot recover, but many signs point to us risking catastrophe. There is hope, but we will likely have to take action very quickly to prevent the worst outcome(s). Before this happens, it will have to be recognized as a problem, which unfortunately is only happening very slowly.
Climate Change
Learning Objectives Self-Check
Read through the following statements/questions. You should be able to answer all of these after reading through the content on this page. I suggest writing or typing out your answers, but if nothing else, say them out loud to yourself.
First, a few important terms:
- Greenhouse effect: the term used to describe the phenomenon whereby infrared heat warms the lower atmosphere of the earth or another planet due to the gaseous content of the atmosphere.
- Enhanced greenhouse effect: This occurs when the magnitude of the greenhouse effect is enhanced by human activity, due to the emission of greenhouse gases at an unnaturally high level.
- Greenhouse gas: a gas that absorbs infrared radiation and contributes to the greenhouse effect.
- Anthropogenic: caused by humans.
- Anthropogenic climate change: the component of climate change that is believed to be caused by humans.
The following article from the U.S. National Aeronautics and Space Administration (NASA) explains a lot of the basics regarding the terms listed above.
Optional Reading
Fact 1: The Greenhouse Effect is Settled Science
The greenhouse effect is a universally accepted natural phenomenon, and carbon dioxide (CO2) is one of the primary greenhouse gases. Without it, life on earth would not be possible. The video below from NASA does the best job of succinctly explaining the greenhouse effect of any video I've found. It is not the most high-tech video out there, but don't let that distract you from the content. (For those of you who have been around long enough to remember a teacher popping a tape into a VCR player connected to one of those big CRT televisions, this may spark some memories.)
Earth's greenhouse effect greatly affects climate. See if you can describe how carbon dioxide and water vapor cause Earth's greenhouse effect. Also, see if you can describe how the greenhouse effect maintains the surface temperature of Earth.
Scientists have long known that the presence of an atmosphere keeps the surface of the planet warmer than it would be without an atmosphere. In fact, without an atmosphere, the surface of the earth would be about 30 degrees Celsius cooler than it is now. In order to understand why, we need to consider the surface of the earth and its atmosphere separately. Because there is a radiative equilibrium we know that the planet emits enough longwave radiation into space to equal the solar radiation absorbed by it. However, most of the longwave radiation that is emitted by the planet into space is emitted by the atmosphere rather than the surface of the earth beneath it. Although the surface of the earth does emit longwave radiation, only about 10 percent of this radiation passes through the atmosphere and escapes into space. The rest is absorbed by clouds and by greenhouse gases in the atmosphere.
There are many greenhouse gases but the most abundant greenhouse gases are water vapor and carbon dioxide. Shortwave radiation from the Sun passes through greenhouse gases, but longwave radiation is absorbed by them. Greenhouse gases absorb longwave radiation that is emitted by the surface of the earth. Subsequently, they re-emit the energy as longwave radiation in all directions. About half of the re-emitted longwave radiation does escape into space and contributes to the planet's radiative equilibrium. About half of the longwave radiation emitted by the gases is directed back toward the surface of the earth. As a result, a continual exchange of longwave radiation takes place between the surface of the earth and the atmosphere above it. The longwave radiation contained in this exchange causes the warming effect known as the greenhouse effect.
This phenomenon is known as the greenhouse effect because, like the glass in a greenhouse, the atmosphere traps some of the energy beneath it. The greenhouse effect produces a warmer climate on earth than would be possible without an atmosphere.
In summary, water vapor and carbon dioxide allow solar energy to penetrate Earth's atmosphere but prevent much of the longwave radiation emitted by the surface of the earth from escaping to space. This trapping of longwave energy is called the greenhouse effect and enhances the surface temperature of the earth.
In a nutshell:
- Greenhouse gases (GHGs) allow shortwave radiation to pass through them, but absorb longwave radiation and re-radiate it in all directions after they absorb it. This is simply a physical property of certain gases. Nature just doing its thing.
- Sunlight is mostly shortwave radiation, so passes through the GHGs on its way toward the earth's surface.
- If the shortwave radiation is reflected on or near the earth's surface (e.g., by clouds, water, physical objects), it passes back through the GHGs, because it is still shortwave. It goes back out to space.
- If the shortwave radiation is absorbed on or near the earth's surface (e.g., by your skin, water, soil, other surfaces) then it is radiated as longwave radiation. (This is radiant/electromagnetic heat transfer that was mentioned in Lesson 1, by the way!)
- If this longwave radiation hits a GHG molecule on its way out, it is absorbed and re-radiated in all directions.
- Some of that longwave radiation (about 50%) heads back towards the earth's surface. This results in warming that would not occur if the GHGs were not in the atmosphere.
The following gases contribute to the greenhouse effect: water vapor (H2O), carbon dioxide (CO2), methane (CH4), nitrous oxide (N2O), and chlorofluorocarbons (CFCs). There are a lot of details about each, but the main focus of anthropocentric climate change is carbon dioxide and methane because they play the largest role in the climate impact that most scientists believe humans are having.
Note that methane is considered approximately 30 times as powerful [89] as carbon dioxide in terms of causing increased warming (over a 100 year period). Methane is the primary component of natural gas and is what gives natural gas its energy. If natural gas is burned, it releases about half as much CO2 as if you burn an equivalent amount of coal. But if natural gas leaks or is otherwise emitted, it is about 30 times more potent than carbon dioxide. Despite this, carbon dioxide reduction is the main focus because it is far and away the biggest contributor to anthropogenic greenhouse gas emissions impact.
Fact 2: Carbon Dioxide Levels are Increasing Due to Human Activity
There are a few fundamental things to know in regards to the carbon dioxide content of the atmosphere.
- First, the amount of CO2 in the atmosphere is measured in parts per million (ppm). A concentration of 1 ppm means that there is one unit of mass of fluid for every million units of mass of the enveloping fluid. The current concentration of carbon dioxide is a little more than 400 ppm [90]. (FYI, this means that if you took 1 kg of air, there would be about 400/1,000,000 kg, which is 0.0004 kg or 0.4 g of CO2 in that kg of air.)
- Second, the atmosphere is considered the same everywhere you go on earth. Localized variations occur, but the current CO2 concentration s considered to be effectively the same no matter where you are on earth.
We have been directly measuring the atmospheric concentration of CO2 since 1958 in the Mauna Loa Observatory [91] in Hawaii, and have seen it increase steadily since then (see Figure 3.1 below). This is known as the Keeling curve and is named after Andrew Keeling, who initiated the measurements.

We also know with a very high level of certainty the concentration of the ancient atmosphere through time, as well through proxy measures such as ice core samples from ancient ice (click here for some links to explanations of how this is done [92] by clicking on the CO2 Past at the top of the page). The current levels of CO2 are almost certainly unprecedented in the past 800,000 years (credit: National Academy of Sciences) [93]. The chart below depicts the carbon dioxide levels in the atmosphere for the past 400,000 years.

It is an established fact that the burning of fossil fuels releases carbon dioxide and that the concentration of carbon dioxide has been increasing rapidly since around the beginning of the Industrial Revolution in the late 1700s. The Industrial Revolution is characterized by the increased use of fossil fuels - first coal, then oil, then natural gas. All of these non-renewable energy sources release CO2 when burned, and aside from minor natural occurrences like volcanic eruptions, are what has primarily caused the increased carbon dioxide concentration over the past 200+ years.
In short, energy is the primary culprit in anthropogenic greenhouse gas emissions. In fact, according to the International Energy Agency, two-thirds of global anthropogenic greenhouse gas emissions are due to energy use and production (Credit: IEA, "Energy and Climate Change [95]," World Energy Outlook 2015). This boils down to the fact that we are emitting carbon dioxide and other greenhouse gases at rates faster than can naturally be absorbed. This causes an imbalance, and thus the concentration increases.
Mythbusting: The Global Carbon Cycle
It is not unusual to hear something like the following as a reason to be skeptical of anthropogenic climate change: "The earth naturally emits WAY more CO2 than humans do. The emissions are so relatively small that they cannot have an impact on CO2 concentrations, never mind climate change."
The earth does, in fact, emit significantly more CO2 than humans do! The image below is from the Intergovernmental Panel on Climate Change's (IPCC) most recent report, called the Fifth Assessment Report or simply AR5. This is an illustration of the global carbon cycle. Carbon, like most other elements, is constantly moving around the earth, e.g., being emitted and absorbed by oceans, being taken up by plants, being released by decaying plants, being released by volcanoes, etc. The carbon cycle illustrates this process. (Don't worry about analyzing this image if you don't want to - it's pretty dense, and you do not need to know any of the numbers.)

This is a pretty busy image, so I'll summarize it for you:
- Humans directly cause about 9 billion tonnes (Gt) of carbon to enter the atmosphere each year.
- Natural emissions are on the order of 170 Gt per year.
Hmm, okay, so there are way more natural than anthropogenic emissions. So why care so much about the measly 9 billion anthropogenic tonnes? As it turns out, if there were no anthropogenic emissions, the carbon cycle would likely even out, or perhaps even cause a reduction in carbon in the atmosphere. There are many natural processes that absorb carbon, mostly oceans, and vegetation. According to the IPCC, the total increase in carbon in the atmosphere is only about 4 Gt per year (including anthropogenic emissions). If you do a little math it becomes apparent: if that 9 Gt of emissions caused by humans were not there, then there would likely be no increase in overall concentration. Even though the relative contribution is small, anthropogenic emissions throw the global carbon cycle out of whack.
One good analogy of this process is weight gain. Let's say you average around 2,000 calories of food intake each day, and on average you burn off the same amount each day. If this continues over time, you will not gain weight. But if you add one extra 100 calorie snack each day, it will throw this balance out of whack. Even though you are only increasing your calorie intake by a measly 5%, over time this will cause weight gain. Well, it appears that the earth has put on some serious carbon weight in the past ~200 years, and it is almost entirely due to the extra human emissions!
Fact 3: The Climate Is Warming
Humans have been taking direct temperature measurements since about 1880. There has been an upward trend in global temperature since around 1900, and the increase has become very sharp since about 1980.

Optional Reading
According to NASA [99]:
"Seventeen of the hottest 18 warmest years in the 136-year record all have occurred since 2001, with the exception of 1998. The year 2016 ranks as the warmest on record."
Based on this evidence (which has been corroborated by other scientific sources) and Figure 3.4 above, it is clear that the global temperature has been increasing since humans have been measuring it on a global scale, and it appears that the warming is accelerating.
One note of caution: The earth operates in cycles of thousands and millions of years, so less than 150 years of warming is not undeniable evidence that the climate will continue to warm. However, the correlation that is observed between increased CO2 levels and temperature, along with what we know about GHGs, is troubling.
Fact 4: If Climate Change Occurs as Many Scientists Believe, the Results Will Almost Certainly Be Catastrophic
There is wide consensus that if the climate continues to change and CO2 levels continue to rise the results will not be good (okay, "not good" is a pretty big understatement). As the Intergovernmental Panel on Climate Change (IPCC) stated in their 2007 report: "Taken as a whole, the range of published evidence indicates that the net damage costs of climate change are likely to be significant and to increase over time" (Credit: IPCC, quoted by NASA [100]). This is a stuffy way of saying that "things will probably be really bad and continue to get worse."
The link below outlines some of the possible impacts, some of which have already begun to occur. Note that I am not saying that all of these things will happen, even if climate change continues, but it is meant as a survey of some of the most commonly cited negative impacts of climate change. Also note that some of the likely consequences may be positive in some areas, including extended growing seasons in cool climate zones and some increased growth of plants due to extra carbon being available, but the overall impact will very likely be overwhelmingly negative.
Optional Reading
It is also very important to note that the most vulnerable to these impacts will be low-income and otherwise marginalized people all over the world. As the IPCC states in their 2014 assessment:
"(Climate change) risks are unevenly distributed and are generally greater for disadvantaged people and communities in countries at all levels of development" (IPCC, Climate Change 2014 Syntheses Report [102], p. 13).
Translation: the people with little power and/or resources will be disproportionately affected by climate change, regardless of whether they live in a low- or high-income country. This is thus an important social and environmental justice issue!
Fact 5: There is Broad Scientific Consensus that Humans are Most Likely the Primary Driver of Observed Climate Change
Multiple reports in peer-reviewed journals have found that at least 97% of scientists actively publishing in the climate field agree that the climate change observed in the past century is likely due to human influence, i.e., it is anthropogenic. See these links to some studies [103]. In 2015, 24 of Britain's top "Learned Societies" - groups of scientific experts, basically - wrote a letter [104] urging that we need to establish a "zero-carbon world" early in the second half of the 21st century. In the past 15 years, 18 U.S. scientific associations [103] have confirmed that climate change is likely being caused by humans. Big players in the private sector are concerned as well. For example, CEOs from 43 companies in various sectors (with over $1.2 trillion of revenue in 2014) signed an open lette [105]r urging action in April of 2015. Even Exxon Mobil states as their official position [106] on climate change (as of the summer of 2018) that:
"The risk of climate change is clear and the risk warrants action. Increasing carbon emissions in the atmosphere are having a warming effect. There is a broad scientific and policy consensus that action must be taken to further quantify and assess the risks."
Exxon Mobil, the world's largest publicly traded oil and gas company, is not known to be a friend of carbon reduction advocates. In fact, a study published in August of 2017 [107] found that they systematically misled the public for nearly 40 years about the dangers of climate change, even though they acknowledged the risks internally. Yet even they assert that emissions should be reduced.
Putting it All Together
Let's consider these facts together:
- We know that the greenhouse effect warms the planet and that carbon dioxide is a greenhouse gas.
- We know that humans are emitting greenhouse gases at a rate that is increasing their concentration in the atmosphere.
- We know that the global climate is warming.
These three facts alone indicate that there is likely a problem. But, on top of this, you add that:
- The vast majority of active climate scientists agree that climate change is a problem and that climate change is at least very likely being caused by humans. So, the people that we trust to understand the climate widely agree that it is a problem.
- Finally, if climate change is happening, then the results will likely be devastating and on a global scale.
Even if we are not certain that humans are impacting the climate (we can never by 100% certain because we only have one planet to run this global "experiment" on), it is probably worth taking the precaution to prevent it if it is true. Yes, it is possible that so many climate experts are wrong - it is a rare occurrence that so many experts are wrong, but there is a possibility, however slim. And yes, we do not know for a fact that humans impact the climate, though basically all signs point to it being the case. And yes, there will be costs associated with making the change to a low-carbon society. But why do people buy life insurance? What about fire insurance? As silly as it sounds, what about buying an extended warranty on a new piece of electronics, or extra insurance for a rental car? The point is that even though the likelihood of using those insurances is minimal - probably less than the likelihood that climate change is caused by humans - people are willing to pay the cost in order to avoid catastrophe. The same could be said of climate change. Taking steps to avoid the worst-case scenario, or perhaps something near the worst-case scenario, is known as the precautionary principle. This may cost money or other resources in the short term, but is seen as worth it because of the situation it may prevent.
One quick addendum to this: If steps are successfully taken to reduce climate emissions to a sustainable level, it is very likely that there will also be cleaner air, less environmental damage, more energy security (not being dependent on another country for energy), and probably more active/healthy citizens. Something to think about.
Further Reading - OPTIONAL
If you are interested in reading more about this topic, here are some suggested readings.
- "Climate Change Evidence & Causes: An overview from the Royal Society and the US National Academy of Sciences [93]." The Royal Society and the National Academy of Sciences.
- "Climate Change 2014 Synthesis Report: Summary for Policymakers [102]." Intergovernmental Panel on Climate Change.
- Link to a number of IPCC documents [108].
- "Energy & Climate Change [95]." World Energy Outlook Special Report. International Energy Agency, 2015.
- U.S. Environmental Protection Agency's Climate Change Website [109]
Optional (But Strongly Suggested)
Now that you have completed the content, I suggest going through the Learning Objectives Self-Check list at the top of the page.
Water

I'm sure I don't need to tell you that water is essential for life, including humans. The earth is considered a "Goldilocks" planet (not too hot, not too cold) based on the fact that water can exist in a liquid state over much of the planet. All water on earth cycles in and out of this system at different time scales (see the figure above), and has been for millennia. In fact, the water that you used to brush your teeth this morning may have been part of the iceberg that sank the Titanic, ran through ancient Roman aqueducts, or was used to wash the makeup off of Cleopatra's face. This is important to understand, because the water we have now is all of the water we'll ever have. There is no shortage of water, but freshwater is limited. The earth naturally replenishes fresh, clean water, but at a limited rate, and there are many obvious indicators that humans are not using freshwater at a sustainable rate.
The following are a number of facts presented by the World Health Organization in their article "Drinking Water [113]." You are welcome to read through the article, but that is not necessary.
- In 2015, 71% of the global population (5.2 billion people) used a safely managed drinking-water service – that is, one located on premises, available when needed, and free from contamination.
- 89% of the global population (6.5 billion people) used at least a basic service. A basic service is an improved drinking-water source within a round trip of 30 minutes to collect water.
- 844 million people lack even a basic drinking-water service, including 159 million people who are dependent on surface water.
- Globally, at least 2 billion people use a drinking water source contaminated with faeces.
- Contaminated water can transmit diseases such diarrhoea, cholera, dysentery, typhoid, and polio. Contaminated drinking water is estimated to cause 502 000 diarrhoeal deaths each year.
- By 2025, half of the world’s population will be living in water-stressed areas.
- In low- and middle-income countries, 38% of health care facilities lack an improved water source, 19% do not have improved sanitation, and 35% lack water and soap for handwashing...
- Contaminated water and poor sanitation are linked to transmission of diseases such as cholera, diarrhoea, dysentery, hepatitis A, typhoid, and polio. Absent, inadequate, or inappropriately managed water and sanitation services expose individuals to preventable health risks...
- Some 842 000 people are estimated to die each year from diarrhoea as a result of unsafe drinking-water, sanitation, and hand hygiene. Yet diarrhoea is largely preventable, and the deaths of 361 000 children aged under 5 years could be avoided each year if these risk factors were addressed...
- Diarrhoea is the most widely known disease linked to contaminated food and water but there are other hazards. Almost 240 million people are affected by schistosomiasis – an acute and chronic disease caused by parasitic worms contracted through exposure to infested water...
- Climate change, increasing water scarcity, population growth, demographic changes and urbanization already pose challenges for water supply systems. By 2025, half of the world’s population will be living in water-stressed areas.
The news is not all bad, though - according to the World Economic Forum [114] (WEF) the United Nations' Millennium Development Goal of "halv(ing) the proportion of the world's population without sustainable access to safe water" was met in 2010. However, the article indicates that while the broad goal was met (global percentage), none of the 48 "least developed" countries met the goal. As usual, there is a deficiency in terms of equity with regards to access to clean water, with "low-income, informal or illegal" populations "usually having less access to improved sources of drinking water than other residents."
These and other factors combine to make access to water an essential part of the quality of life. The United Nations has declared access to water and sanitation a human right and thus should be provided to all people equitably. The UN realizes that access is a fundamental component of the ability to live one's life and further that "clean drinking water and sanitation are essential to the realization of all human rights" (Credit: United Nations [115]).
Water Scarcity
- Physical water scarcity "occurs when the demand for water...is higher than the available resource." This is pretty straightforward: this occurs when an area needs more water than it has. This usually occurs in dry areas of the world, including wealthier ones like the southwestern U.S.
- Economic water scarcity "occurs when human, institutional and financial capital limit access to water even though water in nature is available for human needs." In other words, the water is there and is accessible, but the people are not capable of getting to it. This tends to happen in lower income countries of the world, and areas with social and/or political instability.
Credit: FAO [116]
Optional Viewing
The following video from FAO has no audio narration, so there is nothing wrong with your speakers/headphones! Note that the data provided are a few years old, but have not changed much. It is important to point out that despite what is indicated in the video above, reducing domestic water use is not the most effective way to reduce total water use. As you will see in the video below, much more water is used as a result of farming and industrial uses worldwide.It says: Water scarcity occurs when the demand for water from all sectors (agriculture, cities, environment, etc...) is higher than the available resource. Because water has been relatively abundant throughout our existence on earth, we have come to take it for granted. However, we now find our water supplies severely reduced as water scarcity is fast becoming one of the most serious resource issues we face today. The amount of water on our planet is fixed, but very little of it is available for us to use with about 2.5 percent of all water on earth being freshwater and 68.9 percent of the freshwater is locked in glaciers, 30.8 percent in groundwater, and 0.3 percent in lakes and rivers.
Currently, one-third of the world population lives in countries where there isn't enough water or its quality has been compromised. By 2025 this number is expected to rise to two-thirds.
There are two types of water scarcity. One is known as Physical Water Scarcity. This occurs when there is not enough water to meet our needs. Arid regions are generally associated with physical water scarcity. Physical water scarcity occurs in: the western United States, northern Africa, Saudi Arabia, eastern Australia, and areas of India and northern China. More areas are rapidly approaching physical water scarcity. Africa, Asia and the Pacific, and the Near East use over 75 percent of their water for agriculture. The other type of water scarcity is known as Economic Water Scarcity. This occurs when human, institutional and financial capital limit access to water even though water in nature is available for human needs. Economic water scarcity occurs in central and northern South America, Middle Africa, and in and around India. Poor households in developing countries spend higher portions of their income on water than families in industrialized nations.
You may think water issues are somebody else's problem. But in a few years, it will be yours too. Follow a few easy steps to do your part in maintaining this precious resource. Don't throw your cooking water down the drain. Close the tap when brushing your teeth. Don't buy unnecessary goods, as everything produced uses water.
Here are some things to keep in mind about water scarcity, according to the United Nations [117]:
Water scarcity already affects every continent. Around 1.2 billion people, or almost one-fifth of the world's population, live in areas of physical scarcity, and 500 million people are approaching this situation. Another 1.6 billion people, or almost one quarter of the world's population, face economic water shortage (where countries lack the necessary infrastructure to take water from rivers and aquifers).
Water scarcity is among the main problems to be faced by many societies and the World in the XXIst century. Water use has been growing at more than twice the rate of population increase in the last century, and, although there is no global water scarcity as such, an increasing number of regions are chronically short of water.
Water scarcity is both a natural and a human-made phenomenon. There is enough freshwater on the planet for seven billion people but it is distributed unevenly and too much of it is wasted, polluted and unsustainably managed...
- Around 700 million people in 43 countries suffer today from water scarcity.
- By 2025, 1.8 billion people will be living in countries or regions with absolute water scarcity, and two-thirds of the world's population could be living under water stressed conditions.
- With the existing climate change scenario, almost half the world's population will be living in areas of high water stress by 2030, including between 75 million and 250 million people in Africa. In addition, water scarcity in some arid and semi-arid places will displace between 24 million and 700 million people.
- Sub-Saharan Africa has the largest number of water-stressed countries of any region

- Economic water scarcity: Sub-Saharan Africa, parts of northwestern South America, northern India and some of southeast Asia
- Physical water scarcity: Northern China, parts of the Middle East, southeastern Australia, southwest U.S.
- Approaching physical water scarcity: Central Mexico and parts of Texas, South Africa, most of the Middle East, some in northern China.
- Little or no water scarcity: Most of the rest of the world, except for Alaska, Greenland, Siberian Russia, and Central Australia, which had no data.
Considering that about 97% of the water in the world is salt water, one of the ways that scarcity can be overcome is through desalination. This is being done all over the world, but current desalination technology requires an immense amount of energy [118], can impact local environments in a variety of ways [119], and is quite expensive [118]. Desalination is probably necessary to satisfy the world's energy needs (and likely increasingly so), particularly in arid areas of the world. But as succinctly stated by Scientific American [119]: "Due to its high cost, energy intensiveness and overall ecological footprint, most environmental advocates view desalinization...as a last resort for providing fresh water to needy populations."
Water Use
It is a common misconception that household water use (taking showers, washing dishes, etc.) is the primary driver of water use in the world, but only about 8% of global freshwater consumption is from domestic uses. Most - about 70% - is used for agriculture, and over 20% is used for industrial purposes (e.g., manufacturing, energy generation).
It turns out that U.S. water consumption follows a similar pattern. The chart below shows the percent of consumption different sectors of use are responsible for. Some interesting things to note:
- Thermoelectric cooling is the single biggest user of total water in the U.S. (about 40%). (Keep in mind that about 50 billion gallons of salt water are used for thermoelectric power, so irrigation is the biggest single freshwater user in the U.S.).
- Irrigation is responsible for about 38% of annual water use, but about 42% of freshwater used.
- Domestic water use accounts for about 2% of the total.

| Public Supply | 39,000 |
|---|---|
| Self-Supplied Domestic | 3,260 |
| Irrigation | 118,000 |
| Livestock | 2,000 |
| Aquaculture | 7,550 |
| Self-supplied Industrial | 14,800 |
| Mining | 4,000 |
| Thermoelectric Power | 133,000 |
Note: Values do not sum to 322,000 Mgal/d because of independent rounding.
- Total withdrawals were 322,000 million gallons per day (355 billion gallons per day).
- Thermoelectric power, irrigation, and public supply account for 90 percent of total withdrawals.
- Withdrawals declined since 2010 in all categories except irrigation.
- Freshwater withdrawals were about 88% of the total.
- Surface water supplied 78 % of all withdrawals
Keep in mind that not all water use is consumptive. For example, almost all water used in thermoelectric cooling is used for just that - cooling. Most of it ends up either as steam or as warm(er) water downstream of the power plant. Most of the water used for irrigation is consumptive (62%, according to the USGS), in that it ends up being incorporated into the crops. When water moves from one part of the water cycle to another, it can be days (water lasts about 9 days on average in the atmosphere) to thousands of years (e.g., in the ocean) before it moves to another part of the cycle. (Refer to this description of residence time [121] from the National Center for Environmental Research.)
Water Footprint
Given that most water in the world is used to grow crops and generate electricity, it follows that most of the water we use is used indirectly. Every time you use something that must be grown as a crop (food, cotton, wood, etc.) or use electricity (assuming it is from a power plant), you contribute to water use. This "hidden" water of everyday products and processes is considered the water footprint. The Water Footprint Network [122] defines water footprint as "the amount of water used to produce each of the goods and services we use" (Credit: Water Footprint Network [123]).
A water footprint - like an ecological footprint - can be calculated for individual products, individual people, or groups of people (communities, cities, countries, etc.). The folks at the Water Footprint Network provide a lot of information about water footprints [124]. Feel free to take a look at the Water Footprint Network's product gallery [125]to see the (often surprising) water footprint of many common items.
Summary and Final Tasks
Summary
By now you should be able to:
- analyze the credibility of information sources;
- identify characteristics of the Anthropocene;
- explain how the greenhouse effect increases the average surface temperature of the earth;
- identify evidence for anthropogenic climate change;
- identify characteristics of the 6th Mass Extinction;
- explain the benefits of biodiversity;
- analyze the sustainability impacts of freshwater availability; and
- apply the precautionary principle to sustainability considerations.
Reminder - Complete all of the Lesson 3 tasks!
You have reached the end of Lesson 3! Double-check the to-do list on the Lesson 3 Overview page [126] to make sure you have completed all of the activities listed there before you begin Lesson 4.
Lesson 4: EM SC 240N Lesson 4 Review
Overview
The purpose of this lesson is for you to review key concepts from Lesson 4 (Energy In-Depth) in EM SC 240N. I strongly encourage you to at least browse through Lesson 4 [127] of EM SC 240N, though that is not required.
Learning Outcomes
By the end of this lesson, you should be able to:
- analyze global and regional carbon emissions trends;
- describe the sustainability benefits and drawbacks of various energy sources, including coal, oil, natural gas, nuclear, solar, wind, and hydroelectricity;
- explain the economic considerations of various energy sources using levelized cost of energy;
- identify reasonable estimates of remaining supplies of a variety of energy sources; and
- apply the precautionary principle to energy use.
Lesson Roadmap
| To Read | Lesson 4 Online Content | You're here! |
|---|---|---|
| To Do |
|
|
Questions?
If you have any general course questions, please post them to our HAVE A QUESTION discussion forum located under the Discussions tab in Canvas. I will check that discussion forum regularly to respond as appropriate. While you are there, feel free to post your own responses and comments if you are able to help out a classmate. If you have a question but would like to remain anonymous to the other students, email me through Canvas.
If you have something related to the material that you'd like to share, feel free to post to the Coffee Shop forum, also under the Discussions tab in Canvas.
Sustainable Energy?
Okay, now let's tie this all together. Modern society is inextricably tied to the availability of energy, as we explored in Lesson 1. We just went through more than two full lessons outlining a lot of reasons to be concerned about the sustainability of modern society, in terms of the 3E's of sustainability and otherwise. Putting these two broad concepts together begs the question: What is sustainable energy?
At the risk of sounding glib, the short answer is that there is no short answer. You will probably not be surprised to know that there is no single or even "correct" answer, that is to say, an answer that everyone can agree with. This has a lot to do with the fact that a singular definition of sustainability remains elusive, but in addition to that there is a lot of uncertainty with regards to both the long- and short-term impacts of energy use, and even how much energy (non-renewable in particular) is left to harvest. I want to be clear that the analysis that follows is not meant to answer the question once and for all, but to help frame some of the key considerations to make when answering the question. As you'll see, I've divided the analysis into sections for a number of energy sources, and subsections that provide information regarding supply, feasibility, and sustainability impacts.
Important Note to Keep in Mind
One last thing you should consider prior to reading through this lesson: No matter what mixture of energy sources/technologies that we decide to use, we cannot continue to emit CO2 like we are for long. As detailed in the previous lesson, the reality of anthropogenic climate change and its negative impacts have near universal agreement among experts. You may have read about a United Nations study in 2018 that asserted that humanity will likely need to cut global emissions by 40% - 50% by 2030 (that's really not long from now!) and would need to be 100% carbon neutral by 2050 in order to prevent the worst impacts of climate change (here is an NPR summary [128] and here is the official "Summary for Policymakers" [129] from the UN). In case you were wondering, global emissions have only increased since the start of the Industrial Revolution (see below). In addition, a report authored by 13 federal agencies [130] in the U.S. found that consequences for the U.S. will be dire if emissions are not significantly reduced. This report was particularly notable because it was released by the Trump Administration, which is no friend to climate regulation. (It was only released because it is mandated by Congress, and was immediately downplayed by the Administration, but still.)
Please keep this in mind as you read through these summaries. There is near consensus that humans must significantly reduce net emissions to near zero by mid-century, or we face a very dire future. No energy solution should be considered sustainable in the long term if it emits any carbon dioxide unless carbon reduction technologies are sufficient to offset these emissions. Right now, it is much cheaper to not emit in the first place than to capture and store them.
Coal
Supply

As you can see in the chart above from the EIA, there is a range of estimates of how much coal is available, each having a varying level of accuracy. Feel free to review the coal page [135] in EM SC 240N for an explanation of these, but the quantity that is most commonly used to indicate "how much is left" is estimated recoverable reserves. The estimated recoverable reserves [136] are the portion of the demonstrated reserve base that can be realistically recovered, taking into consideration restrictions (e.g., "property rights, land use conflicts, and physical and environmental restrictions"). Consider it a very good scientific estimate of how much we can mine in the foreseeable future. The demonstrated reserve base [137] also includes coal that could conceivably be mined commercially, but other issues (e.g., technological and political) make it unrealistic.
So how much coal is left?
- The EIA states that: "Based on U.S. coal production in 2016 of about 0.73 billion short tons, the recoverable coal reserves would last about 348 years, and recoverable reserves at producing mines would last about 23 years." This number is derived by dividing the estimated recoverable reserves (254 billion according to the most updated numbers) by the annual use (0.73 billion): 254 billion/0.73 billion = 347.9 years, rounded to 348 years.
- According to the World Coal Association, there are between 110 years and 121 years of reserves available worldwide. This is also based on estimated recoverable reserves.
Tons of Tons and Tonnes
There are many benefits to living in the United States, but having easy to understand energy units is not one of them. We use a mixture of Imperial and English units, with the system usually referred to as U.S. Customary units. Most of the rest of the world uses metric units, which are also considered SI units (Systéme international d'unités). Got all that? Good. (Here is an explanation [138] of how convoluted the non-metric units are if you are so inclined.)
Coal in the U.S. is usually measured in tons, which is a unit I'm sure you have heard of, and likely used, before. A U.S. ton is equivalent to 2,000 pounds. However, to prevent confusion with an Imperial ton, the U.S. ton should be referred to as a short ton. A long ton, on the other hand, weighs 2,240 pounds. Finally, the metric ton, which is also known as the tonne, is equivalent to 1,000 kg, or about 2204.6 lbs. To summarize:
- 1 short ton (U.S. Customary Unit) = 2,000 lbs.
- 1 metric ton (1 tonne) (metric unit)= 2,204.6 lbs.
- 1 long ton (Imperial unit) = 2240 lbs.
Credit: Encyclopaedia Britannica [139] and U.S. EIA [140]
Feasibility
The following are some facts about the feasibility of continued coal use:
- Coal has been used en masse as an energy source since near the beginning of the Industrial Revolution in the late 1700s. The infrastructure for coal mining, transportation, and use (mostly in power plants) is well-established and if it were not for the environmental and social impacts, coal would be a good source of energy.
- Coal is relatively inexpensive per ton, but coal is rapidly being replaced by natural gas and to a lesser extent, renewable energy. This is partially due to the lower emissions of natural gas, but mostly due to basic economics [141]. Energy generators want to make a profit like everyone else, and right now, natural gas and some renewables are simply less expensive, particularly in the U.S.
- Over 40% of global electricity is generated with coal, according to the World Energy Council [142]. and is the primary source of electricity for many industrializing countries like China and India and industrialized countries like the U.S. It is also used for steel production, which is an essential component of modern industrial production (buildings, bridges, etc.).
Sustainability Impacts
Now the bad news: coal has a lot of negative environmental and social impacts.
Optional Reading
- "Coal and the Environment [143]." U.S. EIA
- "Coal's Devastation [144]." The Atlantic.
- "U.S. Mine Disasters Fast Facts [145]." CNN (You can just browse the article.)

Probably the most important sustainability issue with coal is that it is so carbon-intensive. It emits about twice the carbon dioxide per Btu as natural gas and is responsible for more carbon dioxide emissions than any other energy source, and the energy sector is the largest source of carbon dioxide emissions worldwide. [147] There are other concerns, according to the EIA, including mercury pollution and acid rain. While coal companies are generally very careful to replant any vegetation destroyed by mining, it can irrevocably compromise the landscape.
One possible solution to this is carbon capture and sequestration (CCS) [148], which is a process that can capture CO2 and bury it (i.e., sequester it) in underground rock formations. Under ideal circumstances, up to 90% of the carbon dioxide will turn into solid rock and thus not pose a leakage threat. (This is usually what is referred to as "clean coal" technology, though it is notable that only the carbon emissions are reduced in "clean coal" plants. Mining waste and particulates and other emissions still make this a relatively "dirty" source of energy.) While promising, there is some indication [149] that CCS might not be as effective as once hoped. It is only beginning to be demonstrated on a commercial scale [150], and some plants have had major issues [151], so the jury's still out.

In short, coal is a reliable energy source and is generally a relatively cheap source of energy as long as externalities are not included. Coal does provide good-paying blue collar jobs, and the loss of coal industries can be devastating to local towns. If externalities were to be included, the price would undoubtedly increase, especially if the social cost of carbon were included. CCS provides some hope for reducing the carbon dioxide emissions of coal use, but other significant sustainability problems will persist.
Natural Gas
Unless you've been hiding under a rock for at least the past 10 years, you have heard about natural gas in the news. If you have heard about it, it was most likely in relation to hydraulic fracturing, or simply "fracking." This is a VERY controversial topic at the moment, and with good reason (as we'll see below). Because of this, you have to be careful where you get your information (good thing you are taking this course!). Our old friend Hank provides a pretty clear and unbiased description of fracking in the video below.
In case you hadn't heard, we humans use a lot of oil and gas these days. Just a couple of sorts of hydrocarbons, organic compounds made out of hydrogen-carbon atoms. They are a magnificent source of stored energy running a car engine or a fighter jet or a weed whacker or a power plant. Hydrocarbons are pretty useful. A lot of the world's precious petroleum comes from the Middle East, but that puts a few of the world's countries in the position of having all of the useful oil and gas. So, of course, the rest of us are interested in hunting down some domestic sources. Actually turns out the Middle East doesn't have the hydrocarbon market cornered, they just have a lot more liquid petroleum than most places. But a lot of the rest of the world has reserves of natural gas. Gaseous hydrocarbons like methane, propane, and butane.
Usually found deep underground in giant beds of shale, rock that was formed from the floors of ancient oceans, natural gas is likely how your water gets heated and maybe even your air. Burning it for electricity is cleaner and more efficient than coal and unlike oil when it spills, it just vents into the atmosphere instead of spreading out in huge slicks over the ocean. The problem with natural gas has always been how do we get at it? We know it's there, but we can't get it!
Since the forties, oil companies have known that breaking up the rocks in deep underground formations can increase the productivity of wells. See it's not just one big pocket of black gold down there; oil and gas can occur in thousands of little pockets, and by fracturing the rocks around these pockets the gas is released and can be collected. Usually, this fracturing involves pumping millions of gallons of chemically treated water into deep shale formations. We're talking a mile or more underground at extremely high pressures. This fluid cracks the shale or widens existing cracks freeing the hydrocarbons and making a path for them to flow toward the well. So that's how it's done basically, and some people are so unbelievably pumped about this technology they're building little graven images to it, going to natural gas wells on Sunday mornings.
But then, some scientists are like not so fast you guys, cuz fracking isn't all butterflies and cupcakes. For starters, it uses a whole lot of water. It takes up to seven million gallons to frack a single well, and at least 30 percent of that water is trapped in the shale thousands of feet below the groundwater aquifer so it's gone for good. Fracking fluid isn't just water, it's sand which helps keep the cracks open once they form but also chemical additives which can vary from well too well and are often confidential. These additives do things like thicken the water to help suspend the sand or prevent mineral buildup in the pipe and some are things might find under your kitchen sink. Others like benzene in methanol are pretty toxic.
Some concerns about the contents of these fracking fluids not to mention radium, corrosive salts, and other stuff that comes back up from a mile underground, have led places like Pennsylvania to prohibit fracking outfits from sending their wastewater to local treatment plants, and although fracking when done correctly shouldn't contaminate drinking water aquifers, that doesn't mean it hasn't happened.
Subterranean systems are mysterious, and it's impossible to tell how interconnected the shale deposits might be with groundwater. If the fracturing is too effective, groundwater aquifers and shale deposits containing newly injected fracking fluid can mix. Although it's hard to say how many cases of contamination have been caused by improperly installed or maintained fracking wells, improperly bored or sealed wells have contaminated drinking water in several sites in the US resulting in energy companies being fined for polluting water supplies. While natural gas is a far cleaner fuel than coal, the fact that it doesn't spill and instead vents to the atmosphere is also problematic for climate change. Methane is a potent greenhouse gas and if it isn't burned as it vents from fracking wells, it can contribute even more to global warming.
And finally earthquakes. It's crazy, but some US states like Oklahoma, Texas, and Colorado have been experiencing a significant rise in seismic activity, which seems to be corresponding to the fracking boom. Some studies are suggesting that the disposal of wastewater back into used wells are causing the pressurized water to seep through cracks onto old fault lines causing many more earthquakes than normal even in places where seismic activity is rare.
So fracking is creating a new oil and gas boom in the US, sure, but it might not be all it's fracked up to be. Sorry, we didn't make any Battlestar Galactica jokes. So, if you want you could put those down in the comments. If you have any questions or comments or just want to argue about it, the comments are there for that as well. There are also sources. If you'd like to check those out, that would be good. And if you want to keep getting smarter with us here at Sci Show, you can go to youtube.com/scishow and subscribe.
One popular misconception is that fracking has only been around since the early 2000s or so. As Hank explains, this is simply not the case. Hydraulic fracturing has been known to increase the output of gas (and oil!) wells since the mid-1900s. The main innovation that has caused the recent fracking boom is directional drilling (sometimes called horizontal drilling). Until relatively recently, oil and gas wells were generally drilled in a straight line. But directional drilling allows operators to change the direction of the drill bits so that they can trace the path of underground rock layers (which are rarely straight up and down). This allows for significantly more gas output per well and is what mainly facilitated the fracking boom.

Supply
Like coal, it is impossible to determine the amount of natural gas reserves available in the U.S. or worldwide. Most of the data you will see are based on "proved reserves," which the EIA defines as "estimated volumes of hydrocarbon resources that analysis of geologic and engineering data demonstrates with reasonable certainty are recoverable under existing economic and operating conditions." (Credit: US EIA [153]). Basically, proved reserves are a reasonable estimate of the amount of natural gas that is believed to be in the ground that can be recovered given current technology, and for a profit.
Because the proved reserves are based partially on technology, as technology has advanced - especially with fracking - the proved reserves have generally increased. This is clear in the chart below. The upward trend in available gas would seem odd to the uninitiated since it is a finite resource. But it's important to keep in mind that the chart reflects proved reserves, not the actual amount in the ground.

I'm sure you noticed the dramatic drop in proved reserves from 2011 to 2012 and 2014 to 2015. 2015 has a somewhat simple explanation. The price of natural gas dropped significantly from 2014 to 2015, which "(caused) operators to revise their reserves downward", according to the EIA [156].

In the chart above, shale gas refers to gas that is locked up in the pores of shale in underground layers, as described in the fracking video above. Tight gas refers to gas that is locked up in other formations like low-permeability sandstone. For a full explanation of the terms, see this EIA website [158].
So how much gas do we have left? The EIA provides the following analysis and explanation [159]:
At the rate of U.S. natural gas consumption in 2016 of about 27.5 Tcf per year, the United States has enough natural gas to last about 90 years. The actual number of years will depend on the amount of natural gas consumed each year, natural gas imports and exports, and additions to natural gas reserves.
Optional Readings
- "How Much Natural Gas is Left? [154] US EIA.
- "Just How Long Will U.S. Gas Supplies Last? [160]" Peter Kelly-Detwiler, Forbes Magazine.
Feasibility and Sustainability Issues
Like coal, the natural gas infrastructure is well-established, including wells, pipelines, and power plants. As you saw previously, natural gas is relatively cheap. The recent boom in natural gas production has provided a lot of high-paying relatively low-skilled jobs and has generated millions of dollars in royalties for landowners. Increased use and cheaper (up front) cost of natural gas has allowed the widespread replacement of coal-fired power plants, which has resulted in natural gas increasing its share of U.S. electricity production from 18% in 2005 to 32% in 2015. During the same period, coal's share has dropped from 51% to 34%. This is a major change in just over a decade!

One major benefit of this is that it has contributed to reduced CO2 emissions that come from electricity generation in the U.S. These emissions are at their lowest level since 1993. The EIA explains that: "A shift in the electricity generation mix, with generation from natural gas and renewables displacing coal-fired power, drove the reductions in (CO2) emissions." This is a major benefit of natural gas. As indicated previously, burning natural gas results in approximately half of the emissions from an equal amount of coal energy.

But this is not the whole story regarding emissions. Remember that while natural gas emits about half of the CO2 as an equivalent amount of coal when burned, natural gas itself is about 30 times as powerful as carbon dioxide in terms of greenhouse effect impact over a 100 year period and about 80 times as powerful over a 20 year period. One result of this is that methane leaks throughout the natural gas supply chain (from the well to the end user) counteract some of the positive impacts of natural gas being a relatively clean-burning fuel.
Some other considerations regarding natural gas, mostly from this article by John Wihbey [164] include:
- Regarding fracking and contamination of water: Widespread water contamination was not found, but there are verified cases of water supplies being tainted.
- Up to 5-7 million gallons of water are used per well, much of which is unrecoverable; the water that is recovered is often contaminated with hazardous chemicals and substances;
- The disposal of fracking wastewater by injecting into the underground formations, including oil wells, is almost without a doubt causing earthquakes. Usually, this is not serious, but some fracking operations have been shut down due to earthquake risk.
- It is certain that there are fugitive emissions coming from oil and gas operations, but how much is up for debate. It does appear that most of the total leakage is from a few major emitters, but overall it can be difficult to monitor all leaks because of the huge number of wells in the U.S.
- Natural gas-fired power plants can also be energy to supplement renewable energy like wind [165]. Natural gas-fired power plants can increase and decrease output quickly, much more so than coal or nuclear. So, if energy generation from solar or wind drops suddenly, natural gas can make up the difference through increased output.
- Whenever batteries or other forms of electricity storage become economic, the above-listed benefit of natural gas will no longer be relevant.
In short, natural gas is really a mixed bag of sustainability implications, especially with regards to hydraulic fracturing. The primary benefits from a sustainability perspective are that there is no doubt that it has reduced CO2 emissions, but to what extent natural gas leaks have counteracted that is in question; and also that it has created an economic boom, at least in the short term. There are many downsides, particularly with regards to environmental damage (water, air, land), but also with regards to quality of life for some people near wells.
Oil
Supply and Feasibility
In terms of feasibility, oil is so ingrained in modern society and its infrastructure is so well-established that there is no risk of not being able to integrate oil supplies into the economy and society. However, oil supply projections have a very interesting history, and like the price, projections of supply have been volatile. First of all, like natural gas, the calculation of proved reserves is subject to limitations of using current technology, economics, and known reserves, each of which can change from year to year. Like natural gas, for oil, proved reserves refer to "those quantities of petroleum which, by analysis of geological and engineering data, can be estimated with a high degree of confidence to be commercially recoverable from a given date forward, from known reservoirs and under current economic conditions" (Credit: CIA Factbook [166]). The result (again, like natural gas) is that even though oil use is increasing globally every year, there are paradoxically more proved reserves. Please note that the chart below represents global proved reserves.

How is it possible that we can continue to use more oil each year, yet the estimated remaining supplies keep increasing? The primary reason is improving technology. We have so far been able to exploit new resources as the market demands more oil. The most recent increase in proved reserves, especially in the U.S., is from shale oil that can be extracted through hydraulic fracturing (aka fracking). There has been an oil boom that has come in lock-step with the recent natural gas boom, all due to fracking. Access to additional "unconventional" reserves via tar sands in Canada has also contributed to the increase in proved reserves and supply.
Suggested Reading
Dr. James Conca provides a very good explanation of the somewhat complex workings of the global oil market in the article below. As you will see, the price of oil and the economic feasibility of technology is not as simple as supply and demand. He also throws in a nice lesson on how fossil fuels are formed for good measure. Also, if, like me, you have found yourself wondering whether oil deposits are more like a jelly donut or tiramisu, he'll help you out with that as well.
- "No Peak Oil For America Or The World [169]" James Conca, Forbes Magazine
There are a few important things to point out from this article:
- Dr. Conca makes it clear that despite dire warnings of "peak oil" since the 1970s: "For every barrel of oil consumed over the past 35 years, two new barrels have been discovered." In other words, technology has increased the available oil despite the fact that humans have been using it at an increasing rate for over a century.
- For the past 15 or so years, fracking is the main reason that proved reserves have increased.
- Dr. Conca notes that: "Unfortunately, the environmental cost of unconventionals is even greater than for conventional sources." This is important to keep in mind, as fracked oil has the same negative impacts as fracked natural gas.
So, how much oil is left, and how long will it last?
- In 2017, BP released its well-regarded annual Statistical Review of World Energy [170] and determined that there is enough oil to satisfy global needs for just under 51 years [170], but only if we continue on our current trajectory. This is not a very long time if you think about how important oil is to society.
- Also, keep in mind that as we approach this point of exhaustion, the price of oil - and all of the goods that depend on it, which is basically, you know, everything - will increase.
Sustainability Issues
There are many sustainability considerations when it comes to oil. The following are some of the sustainability benefits:
- Oil is extremely important to the functioning of modern society. A little under 40% of all of the energy used in the U.S. is from oil, and in addition to that, oil is used in the manufacture of common things like plastic, car tires, and asphalt.
- Around 150,000 people [171] in the U.S. work in the oil and gas extraction industry, and possibly millions more [172] are "supported" by oil and gas.
- A lot of this helps provide some quality of life improvements, and even some equity advantages (e.g., cheaper food). But it does come at the expense of other sustainability aspects, particularly the environment.
However, there are of course drawbacks, including the following:
- One of the problems with not knowing how much oil is left is that it makes it easier to justify not planning for its eventual unavailability. When oil shocks happen, they have a severe negative impact on the economy. If we knew exactly how much oil we had left, society would be able to prepare for its demise. But because we do not know this with certainty, very little has been done to prepare for it. This is a sustainability issue for many reasons. Primary among them is that if we do not reduce our dependence on oil, there will be a lot of suffering when the next oil shock happens.
- Recall from the chart on the Sustainability of Coal page from this lesson that oil is second only to coal in global carbon emissions. There is no practical way to prevent the emission of carbon dioxide when an oil product like gas is burned.
- There are a number of other emissions [173] associated with the burning of oil products like diesel and gasoline, including nitrogen oxides and volatile organic compounds (which cause lung damage), sulfur dioxide (acid rain and some health impacts), particulate matter (asthma, bronchitis, visual pollution, possibly lung cancer), and others (Credit: U.S. EIA: Oil and the Environment [173]).
- All of the issues associated with fracking, in particular, the heavy use of water (see the Natural Gas page), are the same for shale oil.
- Another unconventional source of oil is Canada's oil sands (sometimes referred to as tar sands). 97% of Canada's known reserves [174] come from oil sands. Oil sand extraction is particularly damaging to the natural environment and has a very low EROI. Canada is the U.S.'s largest supplier of foreign oil (over 4 million barrels per day [175] in 2017), almost all of which is from oil sands.
- Oil is often associated with the so-called "resource curse [176]" when it is controlled by corrupt governments. This problem has historically been especially acute in African countries like Nigeria [177], but oil revenues have propped up many undemocratic regimes elsewhere, e.g., Middle Eastern Countries (Iran, Iraq) and South American Countries (like Venezuela).
Optional Reading
- "Equatorial Guinea Country Profile - Overview [178]." BBC News. When reading this, please keep in mind that Equatorial Guinea was a Portuguese, then Spanish colony for over 500 years prior to independence in 1968. It was used as a source of slaves by the Spanish for the last 200 years or so of that time. This level of exploitation is probably the most important factor in why countries like Equatorial Guinea are subjected to the "resource curse." The exploitation prevented them from developing the necessary political and economic infrastructure and personal freedom that would provide a buffer against exploitation by dictators.
- "The Dark Side of the Shale Bust [179]." Nick Cunningham, oilprice.com.
- "5 Years After BP Oil Spill, Effects Linger And Recovery Is Slow [180]." Debbie Elliott, NPR.
Oil is an extremely useful resource, and it is a very important aspect of the modern economy, and by extension, society. Considering that current projections assert that we only have about 50 years of supplies left, we should probably try to maintain our resources for as long as possible, and avoid an abrupt collapse. But we also should be conscious of the sustainability impacts of its extraction and use.
Nuclear
Nuclear energy has been a hot-button issue for a very long time, both domestically and internationally. It provides a significant portion of the global electricity supply, as you will see in the image below.

Supply
Nuclear energy is non-renewable. Uranium is by far the most-used nuclear fuel. As with other non-renewable fuels, all of the uranium that is on earth now is all that we will ever have, and estimates can be made of the remaining recoverable resources. At current rates of consumption, we will not run out of uranium any time soon. But this depends very highly on a number of variables, including keeping consumption at current levels, technology not advancing, estimates of reserves changing, and so forth.
The World Nuclear Association (WNA), an industry association, provides a very thorough explanation of possible complicating factors [183], but they state that at current rates of consumption, the world has enough reserves to last about 90 years. The Nuclear Energy Agency (NEA [184]), like the WNA, [184]is effectively an industry group and has a wealth of expertise at its disposal. They indicate that as of 2009, the world had about a 100 year supply of uranium. So it appears that as long as the rate of use does not increase there is a little less than 100 years of nuclear fuel supplies left.
Feasibility
According to the World Nuclear Association, there are 454 operable reactors worldwide with a further 54 under construction [185]. The technology is well known by now, and despite the extreme danger posed by nuclear meltdowns, there have been very few major incidents. You are probably familiar with the Fukushima Daichi meltdown that happened in 2011, and perhaps heard of Chernobyl in Ukraine in 1986 (still the worst nuclear disaster to date), and maybe even Three Mile Island in the U.S. in 1978. Here is a partial list of nuclear accidents [186] in history from the Union of Concerned Scientists (UCS). But putting aside this risk at the moment, nuclear energy has shown itself to be a viable source of electricity, and likely will continue to be used for the foreseeable future. Among other things, nuclear power plants generally have a useful lifetime of around 40-60 years, so we are "locked in" until mid-century at least.
Sustainability Issues
Nuclear energy is a mixed bag in terms of the question of sustainability. You may recall that nuclear is considered a carbon-free source, and since it is a proven and reliable source, it is seen by many as a good option. Note that despite being considered "carbon-free," nuclear energy results in some lifecycle emissions because of the materials used in mining, building the power plant, and so forth. (Lifecycle emissions are all the emissions generated by all processes required to make an energy source, including things like mining of materials, manufacturing of equipment, and operating equipment.) But according to the National Renewable Energy Laboratory (NREL) [187] it has approximately the same lifecycle emissions as some renewable energy sources.

Some other sustainability considerations include:
- Nuclear energy is a very reliable source of electricity, and power plants can operate at near full capacity consistently.
- However, nuclear energy is very expensive in terms of direct costs.
- Since they are so expensive, there is an incentive to keep a plant online for as long as possible to recoup costs, thus people are effectively "locked in" once a plant is built.
- The waste from nuclear reactors can remain dangerous for thousands of years [188], which can result in large externalities.
- There is, of course, the risk of another disaster which, however rare the possibility, could be catastrophic.
- There are also some issues with the equity impacts of uranium, particularly in terms of mining [189]. There is not an easy answer here, as there are reasonable and strong pros and cons.
- Regarding the cost of nuclear: The high up-front cost makes nuclear power one of the most expensive types of electricity available. For a technical discussion of this, feel free to read through this description of the levelized cost of electricity [190] from the EIA, which indicates that over the lifetime of the energy source, nuclear is more expensive than geothermal, onshore wind, solar, hydroelectric, and most types of natural gas plants.
Optional Reading
The first article below is a good example of why it pays to pay attention to citations and be well informed on a topic, in regards to finding good information sources. The article is on a website that I've never heard of before, so at first, I was suspicious of the content. However, they provide legitimate sources for the information presented, and I have enough prior knowledge to know that the arguments they put forth are legitimate. Overall, it's a good summary of some of the pros and cons of nuclear energy.
- "Pros and Cons of Nuclear Energy [191]." UnderstandSolar.com
- "Unable to Compete on Price, Nuclear Power on the Decline in the U.S. [192]" Brian Mann, PRI.
- "Nuclear, Carbon Free but Not of Unease [193]." Henry Fountain, New York Times.
- "Nuclear Power Prevents More Deaths Than It Causes [194]." Mark Schrope, Chemical, and Engineering News.
Overall, nuclear is reliable and almost carbon-free but is expensive and non-renewable. Also, because power plants are so expensive to build, once they are built they are generally used for as long as possible, as long as they are still economic. When accidents happen, they can be catastrophic, but they are extremely rare. However, the waste product from nuclear power plants is dangerous for thousands of years, and right now we have no way of safely disposing of it - it is kept in storage, usually at the power plants themselves.
Renewables
Supply
The supply aspect is very straightforward for wind and solar: they are inexhaustible! As stated in Lesson 1, both of them get their energy from the sun; and if the sun stops shining, we have more important issues to deal with than not having a source of renewable electricity. The amount of solar energy that hits the earth in one hour is enough to power the world for an entire year (this is a commonly held fact, but here is one source [195]). There is no shortage of solar energy!
As for hydroelectric, though it also gets its energy from the sun, it is limited due to its dependence on the availability of flowing water. As of 2014, about 17% of the world's electricity came from hydroelectricity. According to the International Energy Agency [196], there is about 5 times as much technical potential for hydroelectric worldwide as is currently generated today. We certainly would not want to exploit all of it, given some of the environmental impacts of large hydroelectric facilities (see below), but this number does provide a frame of reference.
Feasibility
The feasibility is a mixed bag.
- An oft-cited paper by Mark Jacobsen and Mark Delucchi of Stanford University [197]showed that through wind, water (hydroelectricity), and solar, all of the world's energy needs could be met (note that this is all energy, not just electricity) by 2030, or in a less aggressive scenario, 2050. According to their research, this could be done using existing technologies and would require the use of about 1% of all dry land on earth. They assert that the barriers to accomplishing this are "social and political, not technological and economic." There are a lot of other details to this study - way too many to get into here.
- There is no shortage of critiques to this study, including this critique from Ted Trainer of the University of New South Wales [198], who is an advocate of renewable energy. He cites possible underestimates in their cost calculation, underestimates of the amount of energy required to provide a high quality of life, among other things. If nothing else, this plan would require an alteration to the global energy infrastructure at a pace and scale that has never been seen before. It is likely possible with enough political and social will, but it would take a lot of both.
- Irrespective of these studies, it is universally acknowledged that there is more than enough renewable energy available to provide all of humanity's needs. For starters, recall from the solar page that all of humanity's energy needs are supplied by only one hour of sunlight.
One sign that bodes well for renewables is that the cost has come down significantly in recent years.
- It appears that in the U.S. the cost of generating electricity from onshore wind and solar- assuming they are sited and installed properly - is cost-competitive with fossil fuels, even without incentives.
- Residential-scale solar is still relatively expensive, but utility-scale (large arrays) are cost-competitive today. Utility-scale refers to large arrays, usually hundreds or thousands of panels in size.
This is all based on the levelized cost of electricity (LCOE), which was noted in the nuclear lesson. The LCOE is the amount it costs to generate each unit of energy (usually measured in $/megawatt-hour) on average over the lifetime of an electricity source. To calculate the LCOE, you take the total lifecycle costs and divide by the total electricity output over the lifetime of the source. This is of course not including externalities, which would likely make renewable energy cheaper right now, especially if the social cost of carbon were to be considered. See the chart below for details. Note that information for utility-scale vs. residential-scale solar was not made available for the U.S., but refer to this chart from Lazard [199] for global data, which also includes residential and utility-scale solar.
| Plant Type | Total System LCOE ($/MWh) |
|---|---|
| conventional combined cycle natural gas | 48.3 |
| advanced combined cycle natural gas | 48.1 |
| advanced combustion turbine natural gas | 79.5 |
| advanced nuclear | 90.1 |
| geothermal | 43.1 |
| biomass | 102.2 |
| onshore wind | 48.0 |
| offshore wind | 124.6 |
| solar PV | 59.1 |
| hydroelectric | 73.9 |
Optional Reading
- "Wind and Solar Are Our Cheapest Electricity Generation Sources. Now, What Do We Do? [201]" Michael O'Boyle, Greentech Media. You only need to read until you hit the "How can this impact overall system costs?" subheading. This article is from 2017, but the cost of most renewables has only gotten cheaper since then, as you'll see if you read the optional article below.
- "Renewable Electricity Levelized Cost Of Energy Already Cheaper Than Fossil Fuels, And Prices Keep Plunging [202]." Energy Innovation.
The bottom line in terms of cost is that right now, well-sited wind and utility-scale solar are the cheapest form of electricity available, other than only the least expensive natural gas power plants. (Please note that energy efficiency is cheaper than all energy sources!) Other renewable sources such as small hydroelectric, biomass, geothermal, solar thermal, and commercial-scale solar are very cost-competitive with coal and natural gas, and generally less expensive than nuclear. All of this does NOT include subsidies, by the way!
Sustainability Issues
All three of these sources are carbon-free, so they are ideal with regards to anthropogenic climate change. Even after consideration of the embodied energy of these sources, the lifecycle carbon footprint is minimal for renewables, as you can see in the chart below. In terms of climate change concern, there is really no debate: these renewables are great choices.
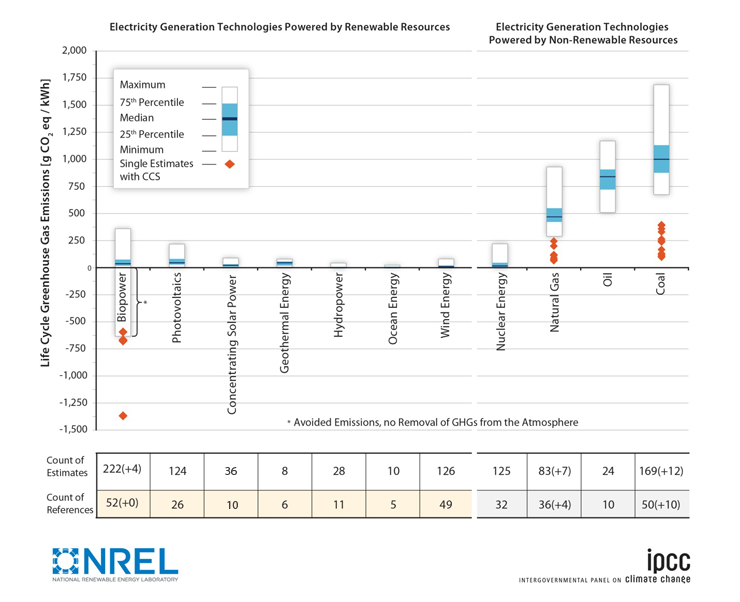
However, there are some other considerations to make in terms of sustainability. First, large hydroelectric facilities are not very environmentally friendly. Depending on the location, there can be problems with flooding of habitats and even towns, compromising fish migration, altering stream content and temperature, impacting scenic areas, and other considerations. The articles below provide some insight into some of these potential problems. Note also that not all hydro has the same problems - by using different types of hydroelectric facilities such as run-of-river and micro-hydro [204], environmental and social impacts can be minimized.
Optional Reading
- "Hydropower Explained: Hydropower and the Environment [205]." U.S. EIA.
- "China Admits Problems with Three Gorges Dam [206]." Michael Wines, New York Times.
- "Run-of-river hydro, Indonesia [207]." (Video).
- "Solar Power Explained: Solar Energy and the Environment [208]." U.S. EIA.
- "Environmental Impacts of Wind Power [209]." Union of Concerned Scientists.
In terms of social equity, there are a few important considerations to make. First of all, do people have access to energy, and can they afford it? This is a tricky question to answer, as it depends on a lot of factors, many of which were indicated above. Some equity and other considerations include:
- Solar panels used to be prohibitively expensive, but new business models are making them much more affordable, even effectively free to the customer.
- Wind and hydro can usually be purchased through utilities at the same or lower rates than fossil fuels.
- One very important equity consideration is that fossil fuel power plants are often sited near low-income areas of the country and world, and thus the negative health impacts are unevenly distributed, with the least powerful bearing the brunt. (The term "environmental justice" hopefully comes to mind for you right about now!) Add to the previous point that the environmental destruction from coal mining is especially unevenly distributed.
- Wind turbines can be a nuisance, as indicated in the article above, but is relatively minor compared to power plants.
- Solar is usually unobtrusive, though some people do not like "the look" of the panels.
- Large hydro can have a major social cost, as you may have seen in the article above. Flooding of houses and even whole towns can result from dams being built, though this is more the exception than the rule in industrialized countries. As always, these impacts are disproportionately felt by low income and marginalized people.
One of the benefits of conventional energy generation is that the infrastructure is largely set up, at least in industrialized countries. In the U.S., for over 100 years, we have built an energy infrastructure based on large power plants and fossil-fuel based vehicles. This gives conventional energy sources an advantage in terms of providing access. That said, wind, hydro, and solar can all utilize the existing infrastructure. Hydroelectric dams provide the same service as fossil-fuel power plants, but usually on a slightly smaller scale, so they are a good fit. They also provide a very consistent stream of electricity as long as no droughts are occurring, and they can increase and decrease production pretty rapidly, unlike solar and wind.
Probably the biggest current problem with solar and wind is that they are intermittent - the sun does not always shine, and the wind does not always blow. This is a major issue because we currently do not have the storage capabilities to provide the energy on command. One common problem with wind and solar are that they are often highest in areas with low population densities. In the U.S., for example, the greatest on-shore wind resources are in the Great Plains in the Midwest, where the population density is very low.
 [210]
[210]
One of the benefits of solar is that as long as there is not too much shading, many households can satisfy their energy needs using existing rooftop spaces. However, not every location is ideal for solar. The intermittency of wind and solar is also a major problem, as noted above. This will change if/as battery technology becomes more accessible, and as the grid is upgraded.
Summary
Overall, the biggest advantages of renewable energy sources are:
- they are inexhaustible (hydro has limits though), carbon-free, and have very minimal environmental impacts (notwithstanding large hydro);
- they also tend to be more democratic, in that many of them are suitable for scaling down to a personal level. This is not possible with current technology for fossil fuel-based electricity generation;
- most of them are also cheaper than almost all forms of non-renewable energy, as long as they are properly sited.
The main disadvantages of solar, wind, and hydro are:
- they are intermittent, and so without storage cannot be relied upon to deliver energy when needed;
- they are not able to be deployed in every location, e.g.; shaded areas for solar, calm areas for wind, and dry areas for hydro;
- large-scale hydro has a lot of negative environmental impacts, and there are some environmental and social problems with wind.
The last thing I'd like to note is that the most sustainable energy is the energy that you don't use. Remember that energy efficiency is sometimes called the "fifth fuel?" That is very much applicable to these considerations. Also, as noted above, energy efficiency has been found to have a lower LCOE than any other energy source! [212] The more we can reduce our energy use while getting the same benefits from the energy service, the better off we will be.
Summary and Final Tasks
Summary
By now you should be able to:
- analyze global and regional carbon emissions trends;
- describe the sustainability benefits and drawbacks of various energy sources, including coal, oil, natural gas, nuclear, solar, wind, and hydroelectricity;
- explain the economic considerations of various energy sources using levelized cost of energy;
- identify reasonable estimates of remaining supplies of a variety of energy sources;
- apply the precautionary principle to energy use.
Reminder - Complete all of the Lesson 4 tasks!
You have reached the end of Lesson 4! Double-check the to-do list on the Lesson 4 Overview page [213] to make sure you have completed all of the activities listed there before you begin Lesson 5.
Lesson 5: EM SC 240N Lesson 5 Review
Overview
The purpose of this lesson is for you to review key concepts from Lesson 5 (Rhetorical Analysis) in EM SC 240N. I strongly encourage you to at least browse through Lesson 5 [214] of EM SC 240N, though that is not required.
Learning Outcomes
By the end of this lesson, you should be able to:
- define rhetoric, ethos, pathos, and logos;
- analyze claims made in speech, writing, and imagery through the lens of the rhetorical triangle;
- define greenwashing;
- identify the greenwashing content of advertising claims;
- identify lies of commission, lies of omission, and character lies;
- define the term homo economicus; and
- analyze principles of Behavioral Economics.
Lesson Roadmap
| To Read | Lesson 5 Online Content | You're here! |
|---|---|---|
| To Do |
|
|
Questions?
If you have any general course questions, please post them to our HAVE A QUESTION discussion forum located under the Discussions tab in Canvas. I will check that discussion forum regularly to respond as appropriate. While you are there, feel free to post your own responses and comments if you are able to help out a classmate. If you have a question but would like to remain anonymous to the other students, email me through Canvas.
If you have something related to the material that you'd like to share, feel free to post to the Coffee Shop forum, also under the Discussions tab in Canvas.
Rhetorical Strategies
Please read the following sentences, and think about the message(s) each one is giving you. Imagine that you don't know anything about the person who is making the statements other than what you read. Treat each example separately.
- I think solar panels are a wonderful technology, don't you?
- I have been in the energy business for almost 40 years, including 30 in the oil and gas industry. But like you, I'm a cost-conscious homeowner with bills to pay. I've never seen technology as potentially game-changing as solar panels. Those things are going to change the world, and better yet, they will save you money.
- Did you know that Tesla Energy will install and maintain solar panels on your roof for no extra cost? You don't have to lift a finger, and you will end up paying less for electricity than you do now. You can save money and get inexpensive, clean electricity. And all of it is guaranteed by contract! I had them install panels on my house, and couldn't be happier. They'll do the same for you.
- You know, every time I see that old coal-fired power plant I think of all of the innocent children living nearby that are probably having asthma attacks because of the pollution. That's why I added solar panels to my roof.
Each of these statements exhibits an attempt to convince you that solar panels are a good idea, but each in a different way. Think about the language devices employed in each of the sentences. What part of your psyche does it attempt to address? Is it logic, emotion, or something else? Are they obvious attempts to gain your agreement, or do they seem reasonable?
Rhetoric
Each of these sentences uses a different rhetorical strategy. Rhetorical strategies are the subject of this lesson, specifically the rhetorical triangle. At the root of all of this is rhetoric, so let's start there. This is just a quick video introduction - no need to take any notes or anything like that.
About 28 centuries ago, people really admired wisdom. They called it Sophos and people admired it so much they were willing to pay for it. They would hire Sophists to teach them all manner of things particularly law and politics, so the Sophists were traveling teachers and poets who roamed the countryside of Greece, and they taught anyone willing to pay to learn. As time went on, these Sophists became the most effective lawyers and gave advice to those governing the new Athenian democracy.
After a while, however, Socrates and his student Plato brought up the idea that the Sophists were not all that wise. In fact, they argued, what they were good at was structuring their lessons to simply sound wise. In essence, Socrates and Plato said the Sophists spoke so persuasively and so falsely that they could make listeners believe black was white. Also, Socrates and Plato objected to the fact that the Sophists charged for their services while they being both wise and noble dispensed their wisdom for free. They created such an uproar that even to this day the term Sophists is an insult. "You're a Sophist."
Not long after, Aristotle, a student of Plato, finally developed some rules for publicly dispensing wisdom and using language persuasively. He put down all his rules in a book, which he called The Art of Rhetoric. In The Art of Rhetoric, Aristotle separated out the wisdom from the skill needed to dispense it. He wrote down rules for arguing whence it required arguers to be ethical as well as persuasive. Aristotle laid out three appeals: logos, pathos, and ethos. He said the arguer should be logical, appeal to emotion, and build his trustworthiness with the audience by being ethical. He also listed 13 tricks or fallacies to avoid in arguing and laid out the ethics he thought an arguer should have.
Later, the Romans based their concepts on the Greeks. A Roman named Cicero came out with a text in the first century listing five canons of argument: (1) invention - creating ways to be persuasive; (2) arrangement - structuring an argument effectively; (3) style - presenting an argument so as to appeal to emotions; (4) memory - speaking extemporaneously; and (5) delivery - effective presentation. Cicero had so much to say that he put it into five books. When you understand that the Romans were very eager to practice law and politics, you understand why they cared about public speaking and argument enough to need five books.
Cicero's five canons influenced Europe for centuries. All students were taught grammar, logic, and rhetoric. After the Roman Empire fell, rhetoric existed only in the writing of letters and sermons. After a bit, people started preaching, and rhetoric became oral again. During the Renaissance, however, oral rhetoric became very popular once more (that's Shakespeare's time) far beyond preaching. The art of rhetoric became essential to lawyers, politicians, priests, and writers. Anyone who wished to persuade a wide audience sought to train in it, and this continues today.
Now, we've skipped over more than 1500 years of rhetoric and argument, but you have the basics. Today, unfortunately, the word rhetoric has taken on some of the negative connotations of sophistry. People think of it as eloquent speech designed to deceive, especially when politicians are involved. Calling something rhetoric is a pejorative.
And that is the history of argument in just over three minutes
Optional Viewing
Purdue University's Online Writing Lab [215] (OWL) provides a lot of publicly available resources that are designed to help students and others become better writers. They do not allow embedded videos, so please click on the link below if you'd like to watch.
- "Introduction to Rhetoric [216]." Purdue OWL.
Rhetoric/rhetorical arguments are designed to convince an audience of whatever the speaker is trying to say, or as Purdue OWL notes, it is "about using language in the most effective way." You most often hear this when referring to a politician, or at least someone acting politically or disingenuously, for example: "That speech was all rhetoric." When you hear or read this phrase, it is meant in a negative way and implies that the speaker was using language to trick the audience into believing the argument they were presenting. As noted in the video above, this negative connotation goes back centuries. But rhetoric has a few connotations, not all of them negative. It can refer to "the art of speaking or writing effectively," and "the study of writing or speaking as a means of communication or persuasion." These two definitions do not necessarily connote deceit. But it can also mean "insincere or grandiloquent language" (Credit: Merriam-Webster [217]).
So, contrary to popular belief, rhetorical arguments are not always "insincere." That said, in this course, we are most concerned about seeing through rhetoric (rhetoric in the negative sense, that is) to evaluate arguments. Please note that rhetorical strategies can also be deployed visually - for example in images, photos, and video - and audibly. Advertisers do this all the time.
Ethos, Pathos, and Logos
Rhetoric is used to persuade people, and there are three general strategies used to do this: ethos, pathos, and logos. Please watch the video as an introduction to these strategies. We will then go into more detail in each in the following lessons.
Persuasion is an art. Great speakers throughout time have been able to change their listeners' minds and even move their audiences into action through the art of persuasion. Consider these persuasive speakers and how they changed the world through what they said.
For example, JFK in his speech where he said: "Ask not what your country can do for you but what you can do for your country." Or Ronald Reagan, twenty years ago when he said: "Mr. Gorbachev, tear down this wall," or Obama who inspired a nation to believe in hope instead of fear. Nelson Mandela, Gandhi, and even Oprah who persuades people every day to know better and to do better, or how about these leaders: Hitler, Stalin, Jim Jones, who brainwashed his congregation leaving 900 of them unknowingly to their deaths through a mass suicide order? Now, obviously, not all of these speakers are viewed as positive voices of change. These last examples even change the world for the worst, but let's face it: they did it through the art of persuasion.
Now, considering the fact that persuasion can be used for many purposes, it is important that individuals exercise ethical persuasive methods when seeking to persuade an audience. Let's face it: you could get an audience to believe anything you want them to if you have the right facts, a persuasive approach, and sometimes a willing audience. Some people accuse Obama of this, others accuse Rush Limbaugh of the same thing, but the fact remains that both of these men have been persuasive to certain people and groups by using information and motivational appeals. However, presenting facts on only one side of an issue without being transparent about the other side of the issue is sometimes unfair and unethical in seeking to persuade an audience. Think about it: I'm sure you've been on the receiving end of gossip: perhaps someone twisted a truth about you into something that wasn't true because they didn't share the whole truth or the full story. When people use information to make it say what they want it to say without sharing the other side, this can sometimes be considered unethical persuasion. It is important to use information and motive or motivational appeals ethically.
So let's talk about some specific motivational appeals summarized by the Greek philosopher Aristotle thousands of years ago. He believed that to be a truly effective speaker or writer, you had to appeal to three things when giving information to an audience or reader. The first is ethos or credibility. Ethos refers to the way in which a person convinces someone else to believe him or her simply by his or her character, credibility, and trustworthiness. We tend to believe and follow people we can respect. One can often increase ethos by being knowledgeable about your topic so that you have the authority and right to speak on the subject matter you are presenting. Another way to increase ethos is to appear thoughtful, fair, and respectful of alternative points of view. Your accuracy and thoughtfulness in crediting your sources, professionalism, and caring about your speech and its structure, your proper use of grammar, and your overall personal neatness are all part of the appeal to ethos.
The second motivational appeal described by Aristotle is pathos. Pathos refers to persuading by appealing to an audience's emotions, values, and beliefs. Word choice affects the audience's emotional response, and emotional appeals can effectively be used to enhance persuasion. This means that your speech should not only be someone else's words or research. You must tie together your research by crafting your speech with your own words in a way that is persuasive and interesting for your audience.
The third emotional appeal is logos. As you may assume from the term, logos is an appeal to reason or logic. This will be the most important technique you will use in your persuasive speech, and it was Aristotle's favorite. It includes the internal consistency and clarity of your speech. It requires that you make a claim and use quality reasons and evidence to support your claim. Just like a lawyer crafts his or her argument with a logical flow that appeals to the minds of the jury, so too must you put together a speech that has a logical flow of persuasion. Giving reason is the heart of persuasion and cannot be emphasized enough. You simply cannot and should not seek to persuade without strong information and a strong logical flow of that information.
Using ethos or credibility, pathos or emotional appeals, and logos or logic is important for any persuasive speaker. If you're seeking to truly persuade an audience, it's important to have all three: like one leg missing from a three-legged stool would cause the stool to collapse, so will your argument or persuasion collapse if you're missing one of these important motivational appeals. Remember, persuasion is not just standing in front of an audience and rattling off facts in hopes that your information will get an audience to change. The speaker must play an active role in persuasion. You are part of your persuasive message and your credibility, emotional appeals, and logic are important when preparing your speech.
So, good luck as you prepare to persuade. Changing minds, hearts, and actions isn't easy, but with the right attitude and preparation, you can succeed. Prepare for your own success and have fun while doing it.
Optional Reading
Purdue University has an excellent online writing lab. It has a lot of very helpful information, including how to use rhetorical strategies.
- "Ethos, Pathos, and Logos Definitions and Examples [218]," PathosEthosLogos.com
- "Using Rhetorical Strategies for Persuasion [219]," Purdue University Online Writing Lab
Good to Know
Ethos, pathos, and logos are rhetorical strategies, but these are not rhetorical devices. Rhetorical devices are specific methods that can be deployed to make a persuasive argument, whereas rhetorical strategies are general strategies. You have likely picked up on many of these devices when listening, reading, or speaking. Politicians are particularly fond of them. The "Mental Floss" website [220] goes over some of them. If you Google around, you will find more.
Ethos
Two of the previous sources provide concise definitions of ethos:
- Purdue OWL defines ethos as "the ethical appeal...based on the character, credibility, or reliability of the writer" (Credit: Purdue Online Writing Lab [219]).
- Pathosethoslogos [218]notes that ethos is "ethical appeal, means to convince an audience of the author’s credibility or character. An author would use ethos to show to his audience that he is a credible source and is worth listening to."
Purdue provides the following examples of ways that you can establish ethos. I highlighted a few things that are most important to consider:
- Use only credible, reliable sources to build your argument and cite those sources properly.
- Respect the reader by stating the opposing position accurately.
- Establish common ground with your audience. Most of the time, this can be done by acknowledging values and beliefs shared by those on both sides of the argument.
- If appropriate for the assignment, disclose why you are interested in this topic or what personal experiences you have had with the topic.
- Organize your argument in a logical, easy to follow manner. You can use the Toulmin method of logic or a simple pattern such as chronological order, most general to the most detailed example, earliest to the most recent example, etc.
- Proofread the argument. Too many careless grammar mistakes cast doubt on your character as a writer.
Pathosethoslogos provides the following advice:
Ethos can be developed by choosing language that is appropriate for the audience and topic (also means choosing proper level of vocabulary), making yourself sound fair or unbiased, introducing your expertise or pedigree, and by using correct grammar and syntax."
There are many ways to establish ethos (credibility) with your audience. Some of the most common are listed above, but there are others. What it boils down to is that whether you are speaking, writing, or trying to communicate in any way, anything you do to try to convince your audience that you are a credible, reliable source of information, is ethos. Any time that someone is trying to establish credibility, they are using ethos.
Okay, now let's get back to our original examples. Which of these sentences relies the most on ethos, and why do you think so?
- I think solar panels are a wonderful technology, don't you?
- I have been in the energy business for almost 40 years, including 30 in the oil and gas industry. But like you, I'm a cost-conscious homeowner with bills to pay. I've never seen technology as potentially game-changing as solar panels. Those things are going to change the world, and better yet they will save you money.
- Did you know that Tesla Energy will install and maintain solar panels on your roof for no extra cost? You don't have to lift a finger, and you will end up paying less for electricity than you do now. You can save money and get inexpensive, clean electricity. And all of it is guaranteed by contract! I had them install panels on my house, and couldn't be happier. They'll do the same for you.
- You know, every time I see that old coal-fired power plant I think of all of the innocent children living nearby that are probably having asthma attacks because of the pollution. That's why I added solar panels to my roof.
If you said the second example, then give yourself a pat on the back. The language used in that narrative is a clear attempt to establish the author's credibility, in a few ways.
- First of all, saying that "I have been in the energy business for almost 40 years" is meant to be a strong indication that I know energy. This is an attempt to establish credibility. If the person said that they were an accountant for 40 years or a recent college grad with a History degree, would it have the same impact?
- The assertion that the person worked in the oil and gas industry is a more subtle attempt to establish credibility because the renewable and non-renewable industries are usually competitors. The impact of the statement would probably be different if they said they worked in the solar industry, or if you knew they sold solar PV systems.
- The third attempt at ethos is made when the person tries to establish common ground with the reader by stating they are a cost-conscious homeowner (this strategy is pointed out by the Purdue article).
Remember, any way that a speaker or writer can establish credibility and believability is ethos. There are myriad ways of doing this, including using appropriate language, citing legitimate sources of information, dressing appropriately, speaking/writing with confidence, avoiding grammatical and/or spelling errors, and more.
So, now that we have ethos figured out, here's a little curveball: Appeals to ethos can change from situation to situation, even if it is the same speaker or writer trying to convey the same message. The video below from our friends at Purdue University does a really good job of explaining this and goes over ethos in general as well.
Optional Viewing
- The video creator does not allow the video to be embedded in other websites, so please click on this link to watch the video [222].
The narrators sum up ethos nicely by stating that: "In every rhetorical situation, ethos means a quality that makes the speaker believable." This "quality" can and does change all the time. Even if you don't have the credentials that render you credible on the topic, you should do your best to establish credibility by doing things like using reliable sources, proper language, and so forth. You've probably heard the truism that as a speaker or writer you need to "know your audience." Establishing ethos is one of the reasons why. You want your audience to believe you, and ethos can help make that happen. Politicians are particularly (or notoriously, depending on whom you ask) good at doing this. An example of this can be seen below.

Notice the stark difference in physical appearance in the photos of Barack Obama above. What messages is he sending with regards to ethos? The left photo shows the classic "sleeves rolled up" look, which politicians use to speak to "regular folks," usually in public settings like fairs, construction sites (they'll also don a hard hat for this), local restaurants, and so on. The ethos-related messaging is something like: "Hey, I'm just a regular, hard-working guy like you. I understand your problems." But by wearing a dress shirt instead of, say, a polo shirt, an air of authority and professionalism is still presented.
The photo to the right presents a much different attempt at ethos. He is projecting an image of power and authority by wearing a suit and tie, being the only person in the shot, and sitting in a well-appointed office. Even his posture is different than the other photo. Note that both an American flag and flag with the Presidential Seal is in the background. Both project authority, among other things. Do you notice anything else in the background? Do the family pictures convey a message? This is a subtle reminder that he has a family with two young children, and thus is relatable (this is probably also an example of pathos).
One Final Note
It can be easy to view ethos as a way to "trick" audiences into being persuaded by someone. This can certainly happen and often does. This is a common problem with politicians, as they never want to appear not credible. But it is important for you to know that ethos can be legitimately established. Knowing as much as possible about the source of information is an important aspect of determining credibility. For example, if I want to know about drought conditions across the U.S. [225] I refer to the National Oceanic and Atmospheric Administration (NOAA) [226] since I know that monitoring water conditions is one of their focuses and that they are tasked with presenting an unbiased, scientific perspective. In short, I know that they are credible.
If the Administrator of NOAA [227](one had not been confirmed yet [228], as of September 2018) was to give a speech or write an article, (s)he would be remiss if (s)he did not let the audience know her/his position. (S)he has credibility, but still may need to establish ethos. Doing this does not mean that (s)he is trying "trick" anyone, but it does mean that (s)he is trying to strengthen her/his argument, which if you recall is the purpose of rhetoric. Ethos is only established if the audience thinks that you and/or your argument, is credible, and that can be done without being dishonest or "tricky" in any way.

Check Your Understanding
Describe one specific example of something that could establish OR compromise ethos, depending on the audience.
There are many possible examples. One really prominent one that comes to mind is that just being Donald Trump or Barack Obama will bring a very strong positive or negative reaction, depending on who is in the audience. Me having long hair and a beard can compromise my ethos in certain circles (e.g., with police officers or other authority figures), but can help establish it in others (e.g., at music festivals).
Pathos
Please watch the commercials below before continuing.
This Commercial shows a man with a baby driving around the McDonald's drive-thru early in the morning. Instead of stopping at the drive-thru window as someone would normally do, the man continuously drives around the McDonald's in the drive-thru lane without stopping. The reason that he does this is because there is a sleeping baby in the back seat, and he does not want the baby to wake up. The McDonald's employees don't understand what is going on at first, but eventually, they catch on and try their best to help him. The steps the employees take to help them include talking really fast and quietly into the intercom when the man drives by the intercom and making a sign that shows his total at the front of the store so he can see it as he drives by. Eventually, the employees make his order, and he swaps it really fast with the money that he uses to pay for the order. He then fist pumps in front of the restaurant before he drives back onto the road.
This commercial begins by showing a man getting his mail. It also shows a guy working on a cable line that takes off his sunglasses to reveal that he is a robot. Once he takes his mail inside he pulls out his cable bill. He tries to pull his bill out of the envelope, but the bill is very long and continuously comes out by itself. The man is noticeably startled by this. The commercial then cuts to a woman in bed woken up by an alarm. She then picks up the phone and begins crying into it. She then grabs the phone and rips it from the wall where it is plugged in and throws it on the floor and begins hitting it and crying. The commercial then cuts to a screen that says "It's time for better TV," and then it cuts to a screen that says PlayStation Vue.
This video shows how children copy adults no matter what they do. The video starts out with more harmless things and then it gradually gets to very concerning, evil things. The video starts out showing a little girl copying and following an older man talking on his phone while walking. Then it shows a woman with another little girl copying her on a payphone. Next, it shows a man waiting for the train with a little boy copying him. After that, it shows a woman going up an escalator smoking a cigarette with a little girl following her also smoking a cigarette. Then it shows a man drinking and then littering with his can and a little boy follows and does the same thing. Later, it shows a girl stumbling in an alleyway about to throw up with a little girl following her and copying her. After that, it shows a woman sticking her middle finger up at another driver while driving and a little boy in the back seat is also sticking up his middle finger at the other driver. Then it shows a man pointing and yelling at a dry cleaner employee and a little boy next to him does the same thing. After that, it shows a man and a little boy throwing rocks at an animal. Then it shows a woman and a little girl drunkenly yelling at a baby in a crib. Finally, it shows a man getting into an argument with a woman that turns physical, and the video stops as the man and a little boy following him are about to throw a punch. The video then says "Children See, Children Do", and then it shows a man helping another woman pick up her things after dropping them. The screen then reads "make your influence positive, "and then the commercial ends.
What was your reaction to each of these videos? Was your reaction to each similar in any way? Different? If you have not already, take a moment to think about how each commercial tried to persuade you through its emotional content.
Optional Viewing
Please click on the link below for an explanation of pathos.
- Video Explanation of pathos [231] from Purdue University Online Writing Lab
As noted in the video, pathos can be defined as "the emotional quality of the speech or text that makes it persuasive to the audience." Though most often associated with sympathy, sadness or similar "sad" emotions, pathos can utilize the full range of human emotion, including anger, joy (e.g., through laughter or inspiration), frustration, suspicion, curiosity, scorn, repulsion, jealousy, desire, compassion, hope, love, and more.
Please take a few minutes and think about all the ways that the commercials at the top of the page attempt to elicit an emotional response. Do these attempts make the commercials more persuasive? Why or why not?
The McDonald's commercial uses one of advertising's favorite pathos tools - the baby [232]. Babies tend to elicit all kinds of positive emotions - e.g., happiness, sympathy, love, and compassion. When in doubt, find a way to put a baby (or puppy) in your advertisement! (No, seriously. Next time you see some advertisement, see how often a baby or puppy appears.) The commercial also uses humor and (for parents, anyway) empathy. Even the music evokes pathos. Note that the baby is essential to the plot of the commercial, but I submit that (s)he has absolutely nothing to say about whether or not I should eat at McDonald's. Pathos does not need to be logically consistent with the rest of the work. It is meant to play on the audience's emotion(s). This is one thing that distinguishes the first ad from the second.
The second ad uses kind of an odd mixture of suspense, dread, and humor to get its point across. The humorous aspect in and of itself has little connection to the product. (It should be noted that there is some humor in the first commercial as well, e.g., the girl hurriedly sliding over the counter in the middle of it.) However, the negative emotion created by the man's reaction to the cable bill and the woman's to the telemarketer could be said to have a direct connection to the real-life experience of issues related to cable TV. Of course, this is all seriously overdramatized (at least for me, but I suppose everyone reacts to their bills in their own way), but milder versions of the emotions expressed are not far-fetched.
The third ad uses pathos (sympathy, sadness, anger, etc.) to get its point across, but the pathos is very much consistent with the message of the video. Speaking for myself, the imagery used in the third video makes it much more impactful than an article providing statistics about how parents' behavior can negatively impact children. In other words, the pathos served its purpose.
I consider the pathos in the McDonald's ad to be "fake pathos," which was described in the video from Purdue. From my perspective, the McDonald's ad is a clear attempt at emotional manipulation (though I don't think they want the viewer to think that), and thus compromises the ethos of the company because it calls into question their credibility. Call me a cynic, but I don't think that the goal of making the ad was to spread joy and laughter. As the folks from Purdue mentioned, that is the risk you run if your pathos is not genuine. The Sony commercial is overdramatic, but it's so "over the top" that it's quite clear that it is done in jest and (again, speaking for myself) does not compromise ethos. Regardless of how genuine or fake the pathos is, it is still used to create an emotional response. To a large extent, the impact on ethos is subjective.
Pathos in Writing
Pathos is the most commonly used rhetorical strategy in advertising (both print and video) because it is often relatively easy to do with imagery. See below for an interesting example from the World War II era.

Pathos can also be conveyed in writing. As noted in the video, this often boils down to word choice, in particular, adjective choice. In fact, word choice often provides the reader with insight into the motivations of a writer.
Suggested Reading
The two articles below are about the same issue - the revised "Clean Power Plan [234]" announced by the Obama Administration in August of 2015, which has since been revoked by the Trump Administration. This plan was designed to reduce CO2 emissions from power plants in an effort to "take real action on climate change" by requiring states to meet emissions standards set by the federal government. This would impact some states more than others - states who get a high percentage of their electricity from coal would be particularly impacted. As you can well imagine, this is not without controversy. When reading the articles below, pay special attention to word choices that can elicit emotion, especially when other, more neutral words could have been used. Note that both are from reputable websites, but that both are opinion pieces.
- Climate-Change Putsch [235]," Wall Street Journal (the article is unattributed, but it appears it was written by the Editorial Page Editor Paul Gigot). This was accessed via Kentucky Industrial Utility Customers [236].
- "Obama Administration Issues 'Strong and Smart' Final Clean Power Plan - Biggest U.S. Carbon Emission Reduction Measure in History [237]," by Ken Kimmell, President of the Union of Concerned Scientists.
- The pathos flies off the page before the article gets started! Note that the subtitle is "States should refuse to comply with Obama's lawless power rule." The use of the adjective "lawless" is very evocative. It is not necessary to the facts of the article (though it does coincide with the author's opinion), but does set the emotional tone of the article nicely.
- Note the highlighted text. All of these word choices are examples of pathos, meant to "get a rise" out of the reader. Comments are in parentheses: "Rarely do American Presidents display the raw willfulness (meant to elicit disgust at power-hungriness) that President Obama did Monday in rolling out his plan to reorganize the economy (a common conservative talking point, and not a compliment) in the name of climate change. Without a vote in Congress or even much public debate, Mr. Obama is using his last 18 months to dictate (again, suggests power run amok) U.S. energy choices for the next 20 or 30 years. This abuse of power (power monger!) is regulation without representation. The so-called (suggests skepticism) Clean Power Plan commands (power word) states to cut carbon emissions by 32% (from 2005 levels) by 2030. This final mandate is 9% steeper ("higher" or a rephrasing could be used) than the draft the Environmental Protection Agency issued in June 2014. The damage (suggests assault) to growth, consumer incomes and U.S. competitiveness will be immense (especially strong adjective)—assuming the rule isn’t tossed by the courts or rescinded by the next Administration."
- More highlights: "States have regulated their power systems since the early days of electrification, but the EPA is now usurping this role to nationalize (suggests power-grab by the government; suggestive of socialism) power generation and consumption. To meet the EPA’s targets, states must pass new laws or regulations to shift their energy mix from fossil fuels, subsidize alternative energy, improve efficiency, impose (suggests forcing against one's will) a cap-and-trade program, or all of the above. Coal-fired power will be the first to be shot (suggests violence), but the EPA is targeting all sources of carbon energy. As coal plants have retired amid seven years of EPA assault (violent word again), natural gas recently eclipsed coal as the dominant source of electric power. This cleaner-burning gas surge has led to the cheapest and fastest emissions plunge in history, but the EPA isn’t satisfied."
- Other word choices include "central planning," "punishing" states, "bull-rush" states, "distorting the law" beyond recognition, "intimidate" the states, global warming "stampede," and climate change is too important to "abide by relics like the rule of law or self-government."
- “We congratulate President Obama and Administrator McCarthy for their bold and visionary leadership (elicits respect and admiration), and EPA staff for a final plan that is fair, cost-effective, and builds off of proven, successful policies (indicates the correctness of policies) that many states have already put into action."
- “The Clean Power Plan provides us with our best shot (again, implies correctness) to meet our international climate goals and lead (indicates good leadership) the rest of the world towards a strong international climate agreement. This will also be a catalyst for a clean energy economy at home that will benefit all states through a more diverse energy supply, cleaner air, and homegrown job growth."
- “We are pleased the facts (implies that they are correct) about cost-effective (very positive term) carbon reductions won out, as evidenced by the increased role of renewables in the plan. UCS has said all along that rapid growth in renewables is feasible and affordable, a fact that is supported by the shift to clean energy already underway."
- “And as a former RGGI chair, I know first-hand that states can cut carbon pollution and grow their economies far more effectively when they work together rather than if they act alone. With the final rule, EPA encourages states to collaborate, which makes perfect sense (a clear suggestion that they are right) — the electricity market crosses state lines, therefore the best solutions are regional in nature."
- “We also note that the final rule wisely (Hey, they are doing smart things!) includes measures—such as early action credits for investments in renewable energy and an extended initial compliance date—to limit the risks (negative connotation) of a rush to gas. Natural gas is still a fossil fuel, with risks of methane leakage in its production and distribution, therefore a large-scale shift to natural gas will make it more difficult for the United States to make the deeper emission reductions needed by mid-century. The rule also takes significant steps to help low-income communities cut their energy bills and join in the benefits (very positive terminology) of a transition to a low-carbon economy."
Optional Reading
Here is another short article about the Clean Power Plan. See if you can pick up on any use of pathos from the author, or not.
- "Could Obama's Clean Power Plan Lower Your Electric Bill? [238]," by Daniel White, Time Magazine
Was pathos used by the author? The only instances of pathos are used to describe what other people are saying - e.g., "slashing jobs," "driving up prices" - the author himself writes dispassionately about the topic. This demonstrates good reporting, using more ethos and logos (see next section) to persuade the audience.
Optional Activity
Add and/or change some words from the Time Magazine article to evoke more pathos in the following paragraph. Have some fun with it!:
"In a report released last week, public policy professor Marilyn Brown found that boosting renewable energy sources such as wind and solar power would reduce energy costs in the long run as they become more readily available. Even if energy costs did go up in the short run, she argued that would cause consumers to invest more in things like energy-efficient appliances, which would again lead to lower electricity bills over time."
Please note that I am not advocating one opinion over the other on this topic, nor am I saying that either of the authors is telling untruths. I am merely pointing out word choices that convey pathos. Perceptive readers will pick up on such word choices, which may compromise ethos. Pathos can be an effective persuasive technique, but generally only if the reader agrees with the author's arguments. As critical thinkers, you should be skeptical of anyone that uses pathos in such a way that appears to try and persuade you to believe one thing or another, whether or not you agree with the overall point.
Finally, back to the statements at the beginning of this lesson. Which one is most pathos-filled?
- I think solar panels are a wonderful technology, don't you?
- I have been in the energy business for almost 40 years, including 30 in the oil and gas industry. But like you, I'm a cost-conscious homeowner with bills to pay. I've never seen technology as potentially game-changing as solar panels. Those things are going to change the world, and better yet they will save you money.
- Did you know that Tesla Energy will install and maintain solar panels on your roof at no extra cost? You don't have to lift a finger, and you will end up paying less for electricity than you do now. You can save money and get inexpensive, clean electricity. And all of it is guaranteed by contract! I had them install panels on my house, and couldn't be happier. They'll do the same for you.
- You know, every time I see that old coal-fired power plant I think of all of the innocent children living nearby that are probably having asthma attacks because of the pollution. That's why I added solar panels to my roof.
Of course, the last one is the correct choice. The use of children's suffering and in particular the use of the word "innocent" are both meant to elicit pity, and ultimately sympathy. Even if it is true, the statement is unnecessarily emotive. I could have just kept to the facts and stated that said power plant has been shown to cause asthma problems for children. This is a strong reason to be concerned. It is still an example of pathos but does not lay it on quite as thick.
Logos
Logos can be thought of as "the logical quality of a speech or text that makes it persuasive" (Credit: Purdue University Online Writing [239]Lab [240]). Often this is straightforward - when you read, hear or see an argument, ask yourself if it makes logical sense. Is the reasoning sound? Does the author make any unfounded conclusions? Is she confusing cause and effect or coincidence with causality? All of these can contribute to, or subtract from, logos.
Optional Reading/Viewing
The folks at the Purdue Online Writing Lab provide a good explanation of logos.
- An Introduction to Logos [239]. Purdue Online Writing Lab (video)
- Please also read the logos section [219] (stop at "Avoid Logical Fallacies," but you can read on for some insight into extra credit questions) of the OWL's rhetorical strategies introduction.
It is very important to note that logos is not necessarily how logical (sound) or accurate (true) the argument is. It is the attempt at logic made by the way the argument is structured. Of course, a sound and true argument is more likely to establish logos, but it depends on the perception of the audience. Examples of how to establish logos include:
- making a logical argument (whether it is true or not),
- arranging images in a way that makes sense to the reader,
- having a logical flow (beginning, middle, end, e.g.) to a story or sentence, and
- citing outside sources that the audience trusts (this is more ethos, but can establish logos as well because it can make your argument seem more logical).
In short, anything that appeals to the audience's sense of logic (as opposed to emotion or the author's credibility) is considered logos.
As noted in the reading above, two common ways of doing this are through inductive reasoning and deductive reasoning. Inductive reasoning takes a specific example or examples, then assumes that a generalization can be made based on that example or those examples. In other words, inductive reasoning goes from the specific to the general. The following are examples of inductive reasoning:
- Every time I forget to water my cucumber plants during the hot part of the summer, they shrivel up and die. I guess cucumbers need water to survive.
- All the storms I've seen blow in from the west, so all storms must move from west to east.
- I had a friend from Switzerland who was really nice, so all Swiss people must be nice.
- After the Obama Administration gave a guaranteed loan to the solar company Solyndra, it failed and the taxpayers lost money. Therefore, all loan guarantees should be stopped because they will lose money.
Inductive reasoning can be correct or incorrect (the first example above is correct, and the other three are not, by the way) - it is up to the audience to determine whether or not the logic is valid. But inductive reasoning is an attempt at logos, irrespective of its validity. The persuasive effectiveness of logos depends on a myriad of factors and can change from audience to audience. The same goes for deductive reasoning. Deductive reasoning is the application of a general belief, and applying it to a specific example, i.e., it goes from the general to the specific. Some examples of deductive reasoning are below:
- Every time the gas prices drop significantly, sales of SUVs go up. The price of gas is expected to decrease dramatically this year, so sales of SUVs will increase.
- I've seen hundreds of swans, and they've all been white. Therefore, the next swan I see will be white.
Like inductive reasoning, deductive reasoning can be false (neither of the above statements can be verified, but they can certainly be false), even if they are sound. If I've seen hundreds of swans and they have all been white, then assuming that the next swan I will see will be white is sound reasoning based on my experience, but it may be false because there are other colors of swans out there. Again, it is up to the audience to determine whether or not the logic is sound and/or true, but it is an example of logos either way.
Logos Strategies
As is the case for pathos and ethos, the effectiveness of the rhetorical strategy depends on many factors, and can (in fact, often does) change from audience to audience. With logos, sometimes seemingly sound arguments are neither sound nor true. This is referred to as a logical fallacy. Logical fallacies are encountered all of the time, and you may even use them, accidentally or otherwise. Logical fallacies will undermine your persuasiveness if they are found by the audience, and in turn, impact your ethos as well as your logos. The reading from Purdue linked to previously goes over some of these arguments and provides some examples. There are many possible strategies, sometimes known as "logical appeals," to making a logical argument. Some of them can be seen in the reading below.
Optional Reading
Dr. George H. Williams, Associate Professor of English at the University of South Carolina, put together some good examples of logical strategies. Please read the "Logos" section in the reading below.
- Ethos-Pathos-Logos-The-3-Rhetorical-Appeals [241], Dr. George H. Williams
- (Optional) If you have not yet, read through the "Avoid Logical Fallacies [242]" section of the OWL reading. Note the logical fallacies included: slippery slope, hasty generalization, post hoc ergo propter hoc, genetic fallacy, begging the claim, circular argument, either/or, ad hominem, ad populum, and red herring.
Given all of this, which of the examples below are the strongest attempt at logos? Do any of the other sentences exhibit logos?
- I think solar panels are a wonderful technology, don't you?
- I have been in the energy business for almost 40 years, including 30 in the oil and gas industry. But like you, I'm a cost-conscious homeowner with bills to pay. I've never seen technology as potentially game-changing as solar panels. Those things are going to change the world, and better yet they will save you money.
- Did you know that Tesla Energy will install and maintain solar panels on your roof at no extra cost? You don't have to lift a finger, and you will end up paying less for electricity than you do now. There is no better way to save money and get clean electricity for your home. And all of it is guaranteed by contract! I had them install panels on my house, and couldn't be happier. They'll do the same for you.
- You know, every time I see that old coal-fired power plant I think of all of the innocent children living nearby that are probably having asthma attacks because of the pollution. That's why I added solar panels to my roof.
The first sentence is a pretty weak attempt at persuasion. The second example is really just an opinion, with an attempt at ethos. You could say that some attempt was made at logos because the argument is structured in a logical way (self-introduction, demonstrates similarity to you, then offers an opinion). The fourth one is similar in logos to the second one - it has a logical structure - but it is much stronger on pathos. The third example is the strongest. The argument follows a logical flow of statements. Something of an "either/or" argument is presented when the speaker states that "there is no better way to save money and get clean electricity." It's subtle, but inductive and deductive reasoning is used. Because the speaker is happy with their work, it is assumed that everyone will be happy (inductive), including you (deductive).
Check Your Understanding
If you make a true argument with impeccable logic, it will establish logos.
(a) Yes
(b) No
(c) It depends
Greenwashing and The 3 Types of Lies
Optional Viewing/Reading
Watch the video below and see if you pick up on any rhetorical strategies.
The BP ad begins by showing four babies in a car driving down a road. The baby driving looks at the gas gauge and realizes that the gas tank is basically empty. The babies then look for a gas station, but the first two that they pass seem evil and/or broken down. Suddenly, the baby driving points and they see a BP gas station where everything is happy. It then shows "gas stations, a little better, baby" on the screen followed by the BP logo as the commercial ends.
So, what did you find?
Pathos
This commercial is filled with pathos. The babies (are some children?) are meant to evoke happiness/warmth/etc. The song is jaunty and catchy - I don't know about you, but I actually like it. The imagery (other than the "bad" gas stations) is colored with pastels, giving it a very soft look. The BP gas pump is whistling(!) and the kids are smiling after they go to the BP station. There is a small attempt at humor at the end (the "baby" part of "gas stations, a little better, baby"). All of this is pathos.
Ethos
The only thing I could detect was at the end when BP put its brand on the screen "Beyond Petroleum." This is a weak attempt at establishing credibility, and I imagine not purposeful. They do that at the end of every commercial. There is no scientific information or even scientific-sounding information. No people in lab coats or statistics cited. Really, very little in the way of ethos.
Logos
There is not much in the way of logos either. The story does have a logical progression - happy kids run out of gas, pass gas stations with inferior gas, kids refuse the "bad" gas, then find a BP station and end up happy and high-fiving. I know, this story is ridiculous on its face, but it does tell a story with some logic to the structure. BP is also saying that their gas is better, or at least a little better. You could also say that showing wind turbines at the end of the commercial is an attempt to associate renewable energy with BP, so perhaps the audience might think that BP supports wind turbines. This is a bit of a logical leap but could be considered logos.
There are a number of rhetorical strategies being deployed in this commercial, which to be honest, is to be expected. Please note that this is not meant to single out BP - as noted earlier in this lesson, print and video advertising is rife with rhetoric, pathos in particular. But is there anything that does not quite "sit right" with you when watching the video? Does it feel like part of the story is missing? Anything odd about an oil company using so much green imagery?
Greenwashing
Suggested Reading
This article provides a good introduction to what greenwashing is and how to spot it. Please read before continuing.
- "Greenwashing [243]" from Investopedia. Note the examples of greenwashing at the end of this article.
- (Optional) "About Greenwashing [244]." EnviroMedia Social Marketing.
Greenwashing can be thought of as:
- "the use of marketing to portray an organization's products, activities or policies as environmentally friendly when they are not."
- Greenwashing Index adds that it can also include "when a company or organization spends more time and money claiming to be “green” through advertising and marketing than actually implementing business practices that minimize environmental impact."
So, why would a company spend the time and money to convey a green image, and risk being viewed as insincere? As you might have guessed, it's good for business. Investopedia notes that: "The general idea behind greenwashing is to create a benefit by appearing to be a green company, whether that benefit comes in the form of a higher stock price, more customers or favored partnerships with green organizations."
Being (or at least putting on the appearance of being) "green" or sustainable has become a very good marketing strategy. Think about all of the times you've seen the term "green" or "sustainable" associated with a product or process. It is happening in basically all sectors of the economy - food, energy, transportation, housing, business, cleaning products, events, sports stadiums, and even fashion. Business pursuing sustainability is not a bad thing. If we are going to achieve a sustainable future, the business community will have to be on board, if not leading the way. The problem is when a business is using sustainability more as a marketing ploy than a legitimate attempt at addressing sustainability.
So, how do you know if a company is making a legitimate attempt at addressing sustainability? In short: it's complicated. The folks in the Greenwashing Index offer some good suggestions on how to investigate claims (see the "How Do I Spot It?" section in the reading):
- "If you see a green ad, take a look at the company as a whole. Can you easily find more information about their sustainable business practices on their website? Do they have a comprehensive environmental story? Is there believable information to substantiate the green claims you saw in the ad? If not, buyer beware."
- "Google the company name plus the word 'environment' and see what pops up. This is far from scientific, but if consumers or environmental advocates have a beef with the company’s track record, something’s bound to pop up."
- "'I know it when I see it.'...those are words to live by for the consumer and green marketing claims. If you spot a green ad, how does it strike your gut? Does it ring true and authentic, or is it obviously hype? Smart shoppers abound globally, and your own scrutiny of green marketing claims is one more item to throw into your shopping cart."
The best way to fight greenwashing is to become educated about sustainability and take the time to learn about companies.
Optional Reading/Video
The video below illustrates some facts about BP that could be found with a little research.
This video is the same video as what was shown above, but with speech bubbles thrown in that give you some true facts about BP. The speech bubbles are transcribed here. In 1991 BP was cited as the most polluting company in the U.S. So by 1997 we decided to re-brand our name to Beyond Petroleum. But in 1999 we got caught for illegally burning gases and were fined 1.7 million dollars in addition to the 22 million dollars we already owed for the last 6 years. So in 2000, we designed a green and leafy Helios Logo! But we then got fined another 10 million dollars by the EPA for more polluting that year. Therefore, we claimed that we would invest 8 billion dollars in alternative energy pursuits through 2015. This sounded great...as long as we didn't mention grossing over 248 billion dollars a year. We got away with pledging less than 4 percent of an annual budget! And after spending another $200 million on our green PR campaign, the public bought it. We even bought-err- I mean, GOT support from the National Wildlife Federation. So in 2005 we made it into Mother Jones' Top 10 Worst corporations for a pipeline burst in Alaska, and don't forget about the other explosion at a Texas refinery killing 15 and wounding over 100. Yeah, we got fined again in 2009 for another 87 million dollars for failing to correct these safety hazards even after the accidents. We made up for the fines by cutting investments in renewable energy by 30 percent in 2009. Then in April 2010, our green image busted another leak, which was a big one, all over the Gulf of Mexico! Their decades of green cosmetics, greed, and noncompliance precipitated an unfathomable consequence, and we are only one oil company! The video then shows the BP logo leaking oil all over itself.
Even though BP is not directly making any claims other than being "a little better," the rhetorical strategies outlined above are used to indicate the company's "green-ness." To be fair, BP has been one of the more aggressive oil companies in regards to renewables. According to Bloomberg Business [245], they achieved their goal of investing $8 billion in renewables between 2005 and 2015. They heavily invested in wind farms, though they have recently put many of them up for sale. They had a solar division for decades, and only recently shut it down. They are still fairly heavily invested in biofuels. Whether or not it's wise for BP to invest in renewable energy may be debatable [246], but the point is that renewables are a tiny sliver of their business, so focusing marketing on that aspect is greenwashing.
You may be thinking "What are they supposed to do - advertise the negative climate change implications of their business?" That would be a fair question. But it is possible to be a little more reasonable in the message the company sends. If they oversell their "greenness," it is greenwashing.
Optional Reading
This article from the Worldwatch Institute provides some examples of greenwashing, and some tips for how to avoid it.
- "5 Surprising Ways That "Green" Products Are Trying to Trick You [247]" Gaelle Gourmelon, The Worldwatch Institute.
Greenwashing is not only used by energy companies. Watch the ad below and see if you can pick up on any rhetorical strategies, and think about whether or not it is greenwashing (hint: think about what you know of the electricity industry from Lesson 1).
Okay, one more example. Once again, keep an eye out for rhetorical strategies.
(casually dressed man) As global warming becomes more of a concern, all of us in the petroleum industry are doing what we can to show that we care about the environment. Many of us have changed our logos from something like this (traditional logo) to this — see it looks like a flower.
(casually dressed woman) And we in the plastics industry are doing our part by putting the word recyclable on all of our products. Where to recycle, how to recycle, or what to recycle it into haven't been thought of yet, but we're spending millions researching where on our product the recycle logo is the most visible.
(man) And I'm wearing a sweater instead of a suit so I must love nature. And look where I'm standing; isn't it beautiful. Now, when you think of oil refineries, hopefully, you'll think of this.
(woman) We're doing our part to look environmental, but we need you to meet us halfway and believe we're environmental even when we lobby against pollution restrictions like the Kyoto Accord.
(man) So when you hear about an oil spill that's killing thousands of birds or an oil spill that's destroying marine life or any oil-related disaster, think of deer laying in a field (additional inaudible comment).
(woman) Look! Dolphins! The more you think about these things, the less you're thinking about the island of plastic garbage in the middle of the Pacific that's twice the size of Texas.
(man) Because a clean ocean is a great photo opportunity for...
(man and woman together) the children.
(another man's voice) This message from the Canadian resource association of petroleum and plastic producers. You can't spell greenwashing without green.
You probably figured out that this last one is a parody (a pretty funny one, if you ask me). But it actually makes some really good points by bringing light to the touchstones that many advertisers put in their commercials to persuade you. Again, this is not meant to single out the petroleum and plastic industries, as these techniques are used by many companies. But it is the only parody video I know of.
Again, the best way to detect greenwashing is to learn as much as possible about sustainability and to research companies' claims. The best way to reduce the incidence of greenwashing is for consumers to push back against companies that do it. By "voting with your dollars" you hurt profits, which is a good way to get a company's attention.
Why Should We Care?
Hopefully, it's pretty clear what greenwashing is, and how to spot it. But why does it matter? Of course, advertisers are not telling us the whole truth, and are just trying to get us to buy their products. After all, that is literally their job (the part about getting us to buy their stuff is, anyway). The main problem with greenwashing is that it can trick people into doing things that they think is promoting sustainability, but it is actually not, or worse - it is promoting things that are bad for sustainability.
Most often, the best way to address sustainability is to not buy anything at all. But given that it's nearly impossible to go through life without buying things and that consumer spending constitutes somewhere around 70% of U.S. GDP [248], making wise consumer choices is important. Greenwashing makes this much more difficult.
Check Your Understanding
Why would a company risk being viewed as one that greenwashes?
There could be many reasons, but usually, it is so they can make money. Items that are perceived as sustainable often charge more money (e.g., organic produce), but also are attractive to many consumers. It can also increase the general sustainable perception of the company, which some investors like (e.g., it can increase a company's or brand's q-score [249].)
The Three Types of Lies
Hopefully, by now you see that there are a number of rhetorical strategies available to help convince people of an argument. Though this can be seen as manipulative in many cases, often times it does not involve actual lying. But what is lying, exactly? Merriam Webster's online dictionary [250] provides two relevant definitions of a lie:
lie (intransitive verb)
- to make an untrue statement with intent to deceive
- to create a false or misleading impression.
Seems pretty cut-and-dry, but for the purposes of this lesson, it is helpful to know that there are different types of lies. The three most commonly referred to are lies of commission, lies of omission, and lies of influence, aka character lies. The reading below neatly summarizes these and provides some examples.
Optional Reading
These three types of lies are well-known, and there are many readings that illustrate them. This one from Vanessa Van Edwards is very concise and offers a number of examples. I suggest going through the examples she provides to test your understanding.
- "Different Types of Lies [251]," by Vanessa Van Edwards, Science of People
The three types of lies are as follows, as described in the reading above:
- Lies of commission: "If someone tells you something that is not a fact then we call this a lie of commission. This type of lie is telling someone something that is simply not true."
- Lies of omission: "Another type of lie is one where you leave out an important part of information, hence the name lie of omission. In this lie, someone omits an important detail from a statement. These are nasty lies because they’re harder to spot and take less effort from the person who is lying."
- Character lie, aka lie of influence: "Sometimes people will tell you something completely unrelated to the truth to cover up a lie. This is what we call a character lie or a lie of influence. These lies are meant to make you believe the liar or to make the liar seem like such a great person that they are unlikely to be suspected of lying."
Now that you have a good idea of what each of these three types of lies entails, take a second to think about which type of lie fits which of Webster's definitions above.
Behavioral Economics
Try and think back to the very brief "Economics 101" lesson that was part of the explanation for externalities. If you recall, I noted that most economic decisions are based on weighing the private benefit against private cost in an effort to maximize private benefit (remember the thrift store table?). This effectively summarizes the neoclassical economic model we've been using in the Western World for the past 150+ years, and it has changed very little in that time. When economics models people's decisions in this manner, the generic person in the model is often referred to as "Economic Man" or "homo economicus," the latter of which is an obvious play on the term homo sapiens. Economic Man was described by Craig Lambert in Harvard Magazine [252] thusly:
Economic Man makes logical, rational, self-interested decisions that weigh costs against benefits and maximize value and profit to himself. Economic Man is an intelligent, analytic, selfish creature who has perfect self-regulation in pursuit of his future goals and is unswayed by bodily states and feelings.
As Lambert says, this is the "standard model...that classical and neoclassical economics have used as a foundation for decades, if not centuries." Most economic models are based on this assumed behavior, but there is at least one major problem with this. Lambert sums up the problem concisely: "But Economic Man has one fatal flaw: he does not exist."
So what does he mean by this?
- Well, for starters, the world is littered with irrational behavior. Some are relatively harmless like making an impulse buy of something you don't need (come on, admit it - we've all been there!), but some are more serious, like engaging in potentially life-changing or -threatening behavior such as smoking or risky sexual activity.
- And of course we don't always act in self-interest, for example donating to charity, making decisions such as water conservation that benefit the "greater good," and so forth.
There are many more examples, as you will read below. But the question is, how do we include this type of irrational behavior into economic models? In a more general sense, it begs the question: "How can we explain such behaviors?" Enter Behavioral Economics. Some of the principles of Behavioral Economics are described below by Alain Samson in The Behavioral Economics Guide 2015 [253]. (I added the emphasis in bold.)
In last year's BE Guide, I described Behavioral Economics (BE) as the study of cognitive, social, and emotional influences on people's observable economic behavior. BE research uses psychological experimentation to develop theories about human decision making and has identified a range of biases. The field is trying to change the way economists think about people’s perceptions of value and expressed preferences. According to BE, people are not always self-interested, cost-benefit-calculating individuals with stable preferences, and many of our choices are not the result of careful deliberation. Instead, our thinking tends to be subject to insufficient knowledge, feedback, and processing capability, which often involves uncertainty and is affected by the context in which we make decisions. We are unconsciously influenced by readily available information in memory, automatically generated feelings, and salient information in the environment, and we also live in the moment, in that we tend to resist change, be poor predictors of future preferences, be subject to distorted memory, and be affected by physiological and emotional states. Finally, we are social animals with social preferences, such as those expressed in trust, altruism, reciprocity, and fairness, and we have a desire for self-consistency and a regard for social norms
It's worth noting that the 2017 Nobel Prize in Economics was awarded to Richard Thaler, who is considered one of the fathers of Behavioral Economics. Here is an article from The Atlantic ("Richard Thaler Wins the Nobel in Economics for Killing Homo Economicus") [254]that explains some of his theories, if you are so inclined. These theories are starting to hit the mainstream!
Optional Reading
Read the Introduction to the Behavioral Economics Guide 2015 by Dan Ariely. This can be found in the link below, and in Canvas in the Lesson 5 Module.
- "Introduction: Behavioral Economics: An Exercise in Design and Humility [255]," Dan Ariely
The Behavioral Economics Guide provides an excellent introduction to this topic, but the following sums it up pretty well:
- "...if people were simply perfectly rational creatures, life would be wonderful and simple. We would just have to give people the information they need to make good decisions, and they would immediately make the right decisions. People eat too much? Just give them calorie information and all will be well...People text and drive? Just let them know how dangerous it is. Kids drop out of school, doctors don’t wash their hands before checking their patients. Just explain to the kids why they should stay in school and tell the doctors why they should wash their hands. Sadly, life is not that simple and most of the problems we have in modern life are not due to lack of information, which is why our repeated attempts to improve behavior by providing additional information does little (at best) to make things better.
- There are lots of biases, and lots of ways we make mistakes, but two of the blind spots that surprise me most are the continuous belief in the rationality of people and of the markets. This surprises me particularly because even the people who seem to believe that rationality is a good way to describe individuals, societies and markets, feel very differently when you ask them specific questions about the people and institutions they know very well. On one hand, they can state all kinds of high order beliefs about the rationality of people, corporations, and societies, but then they share very different sentiments about their significant other, their mother-in-law (and I am sure that their significant other and mother-in-law also have crazy stories to share about them), and the organizations they work at.
The main thing Ariely is trying to get at here is that people make decisions that are irrational and/or are not good for their own well-being all of the time, and if you ask them they admit it. Yet, modern economic models assume that people always act rationally and in their own self-interest. He provides a lot of examples of this, including texting while driving, overconsumption of alcohol, overindulging in social media, over-eating and more. The point is that there are a lot of damaging behaviors that people engage in despite "knowing better." This is indicative of something being amiss in economic models.
The Greenwashing Connection
You may be wondering how this all fits into this week's lesson. Okay, here goes: As it turns out, though the field of Behavioral Economics is only recently gaining steam in academics, and to a lesser extent public policy, advertisers have known about irrational behavior for decades. Though they did not call it Behavioral Economics, they have been using its principles to sell stuff to people. And if you ask the right person, they will openly acknowledge this.
Lucky for you, the good folks at Freakonomics Radio [256] have interviewed such a person, and some others familiar with this topic in a recent show. In a more general sense, Behavioral Economics provides insight into how people can be influenced to act irrationally, and even against their own interests. The applications go well beyond advertising! I'm looking at you, in particular, politics. If you have time, I strongly suggest listening to or reading the podcast in the box below. It's done in a really engaging way and is full of good information.
Optional Reading/Listening
When reading or listening to the show below, pay special attention to the terms social norming, loss aversion, positivity, and perception of scarcity. Note this telling quote from one of the key players in this podcast, and who says it: "The problem with economics is that it’s designed for the perfectly rational, perfectly informed person possessed of infinite calculating ability. It isn’t really designed for the human brain as it is currently evolved."
- "The Maddest Men of All [257]," by Stephen J. Dubner, Produced by Christopher Werth. Click on the link and listen to the podcast, or read the full transcript below.
- (Optional) Read the full transcript of "The Maddest Men of All." [258]
In the podcast, Dubner interviews Rory Sutherland, vice chairman in the U.K. of Ogilvy and Maher, a global marketing and advertising firm. Sutherland is an avowed proponent of behavioral economics (BE) and makes it clear that the advertising agency has been using BE principles for decades, though they never had a specific name for it. The following are a few important elements from the podcast. (There is a LOT more good information, by the way!):
- "Sutherland: The problem with economics is that it’s designed for the perfectly rational, perfectly informed person possessed of infinite calculating ability. It isn’t really designed for the human brain as it is currently evolved...The fact is that those conditions exist in the real world somewhere between very rarely and never.
- They go over some examples of how BE has been applied in advertising and other business functions, and include descriptions of the following strategies. Note that for these strategies to work, people must only perceive that they are true:
- Social norming [259] is basically peer pressure. People tend to want to do things that they perceive that others are doing. Advertisers can use phrases such as "many people like you" or portray "everyday" people in their advertising to help accomplish this.
- Loss aversion refers to the fact that "we generally experience more pain with loss than we experience pleasure with a commensurate gain. Meaning: we hate to give up what we have even if what we have isn’t all that valuable to us." People don't want to give things up, even if they don't need it.
- Perception of scarcity refers to making people believe that if they don't act now (or soon) that they may miss out on an opportunity. "For a limited time!" and "Labor Day sale!" "One day only!" are all examples of this.
Hopefully, next time you are looking at advertisements, listening to politicians, or even just listening to others speak, you will pick up on techniques like social norming, loss aversion, positivity, and perception of scarcity.
Summary and Final Tasks
Summary
By now you should be able to:
- define rhetoric, ethos, pathos, and logos;
- analyze claims made in speech, writing, and imagery through the lens of the rhetorical triangle;
- define greenwashing;
- identify the greenwashing content of advertising claims;
- identify lies of commission, lies of omission, and character lies;
- define the term homo economicus; and
- analyze principles of Behavioral Economics.
Reminder - Complete all of the Lesson 5 tasks!
You have reached the end of Lesson 5! Double-check the to-do list on the Lesson 5 Overview page [260] to make sure you have completed all of the activities listed there before you begin Lesson 6.
Lesson 6: Solar and Anaerobic Digestion
Overview
In this lesson, we'll go over solar and anaerobic digestion in a little more detail. We will see some of this in our travels, and I want you to have a better understanding of some of the basics.
Learning Outcomes
By the end of this lesson, you should be able to:
- identify different types of solar technologies;
- explain the basic process by which solar panels generate electricity;
- explain the difference between irradiance and irradiation;
- calculate energy use/generation given power and time;
- evaluate the impact of tilt and orientation on solar PV output;
- calculate the output of a solar array;
- explain how anaerobic digestion converts organic material to biogas; and
- identify some of the benefits of anaerobic digestion.
Lesson Roadmap
| To Read | Lesson 6 Online Content | You're here! |
|---|---|---|
| To Do |
|
|
Questions?
If you have any general course questions, please post them to our HAVE A QUESTION discussion forum located under the Discussions tab in Canvas. I will check that discussion forum regularly to respond as appropriate. While you are there, feel free to post your own responses and comments if you are able to help out a classmate. If you have a question but would like to remain anonymous to the other students, email me through Canvas.
If you have something related to the material that you'd like to share, feel free to post to the Coffee Shop forum, also under the Discussions tab in Canvas.
Solar Energy
As was detailed in an earlier lesson, solar energy is electromagnetic (aka radiant) energy that is generated by the (nuclear) fusion of hydrogen atoms into helium atoms in the sun. The amount of radiant energy that is released by an object is related to its temperature, and since the sun is so hot (~10,000º F!) [261], it is able to reach the ~94,000,000 miles (the distance depends on the time of year) to the earth. It is a massive amount of energy! A commonly cited statistic is that enough solar energy reaches the earth each hour to provide all of humanity's energy for an entire year. There is no shortage of solar energy.
Types of Solar Energy Technologies
Without the sun, life on earth would not be possible. It provides energy for vegetation to grow and provides sufficient heat to allow water to exist in liquid form, among other things. But there are many ways that humans can use this radiant energy more deliberately. The following is an overview of the major types of solar technologies. We could spend weeks analyzing each of these - keep in mind that this is just an overview.
- Solar photovoltaics (solar PV): Certain materials have the natural property of converting energy from the sun into electricity. When the sun hits these materials, electrons start to flow, creating a direct current (DC). This is the photovoltaic effect. This is described in more detail below.
- Solar thermal: This is a broad term for systems that use energy from the sun to heat water (or other material) for a variety of purposes. One common application is heating water for domestic hot water or swimming pools.
- Concentrated solar: There are a variety of ways to concentrate solar power for use. All of them gather solar energy over a wide area (usually by using mirrors) and concentrating it into a smaller location. This very high level of power is then often used to generate electricity. The DOE has a good explanation of some technologies here [262].
- Passive solar: Passive solar is a type of solar thermal that uses passive system design (e.g. south-facing windows, strategically-placed overhangs) to passively heat interiors of buildings. This is a great low-tech way to use solar energy! (Click here for more information about passive solar from the DOE.) [263]
Solar Photovoltaics and Availability of Solar
The rest of the solar lesson will focus on solar photovoltaics or solar PV. As noted above, photovoltaic technology (aka the photovoltaic effect) converts radiant solar energy into electricity. View the short video below from the U.S. Department of Energy for a brief explanation. Note that the narrator of the video indicates that photons provide the energy that is converted into electricity. NASA describes [264] the relationship between photons and electromagnetic energy thusly: "Electromagnetic radiation can be described in terms of a stream of mass-less particles, called photons [265], each traveling in a wave-like pattern at the speed of light [266]." So photons are generally considered to be what carries the energy that is emitted in waves.
All right, we all know that the sun's energy creates heat in light, but it can also be converted to make electricity, and lots of it. One technology is called solar photovoltaics or PV for short. You've probably seen PV panels around for years, but recent advancements have greatly improved their efficiency and electrical output. Enough energy from the sun hits the earth every hour to power the planet for an entire year. Here's how it works.
You see, sunlight is made up of tiny packets of energy called photons. These photons radiate out from the Sun and about 93 million miles later, they collide with a semiconductor on a solar panel here on earth. It all happens at the speed of light. Take a closer look and you can see the panel is made up of several individual cells, each with a positive and a negative layer, which create an electric field. It works something like a battery, so the photons strike the cell and their energy frees some electrons in the semiconductor material. The electrons create an electric current which is harnessed by wires connected to the positive and negative sides of the cell. The electricity created is multiplied by the number of cells in each panel and the number of panels in each solar array. Combined, a solar array can make a lot of electricity for your home or business. this rooftop solar array powers this home, and the array on top of this warehouse creates enough electricity for about a thousand homes.
Okay, there are some obvious advantages to solar PV technology. It produces clean energy. It has no emissions, no moving parts, it doesn't make any noise, and it doesn't need water or fossil fuels to produce power. And it can be located right where the power is needed, in the middle of nowhere, or it can be tied into the power grid. Solar PV is growing fast and it can play a big role in America's clean energy economy anywhere the sun shines.
Okay, so a solar panel converts radiant to electrical energy by using the unique properties of a semiconductor, usually, silicon combined (doped) with other elements (usually boron and phosphorous). But how much energy and power does a panel generate? As you might guess, it depends on a lot of factors. The following is an overview of some of these factors.
- First, a quick primer on power vs. energy.
- Energy is the ability to do work. It is a discrete amount of "something," and that "something" makes things happen (makes things move, generates sound, generates heat, etc.). If one thing has more energy than another thing, then it is hypothetically capable of doing more "stuff." In the U.S., energy is usually measured in Btus, or if it's electrical energy, kilowatt hours (kWh). One kWh is 1,000 Wh, which is also a unit of energy. The international unit of energy is the Joule (J).
- Power is the rate at which energy is converted. Practically speaking, it indicates how quickly you are "using" energy or the rate at which energy is being provided. Power is usually measured in watts (W) or horsepower (HP). A light bulb that uses 100 W of power is converting 100 Joules of electricity into heat and light each second. A 200 W light bulb is converting energy twice as quickly. A 1,000,000 W power plant (1 MW) is providing energy twice as quickly as a 500,000 W (500 kW) power plant. (Note that the light bulbs and power plants are all just converting one form to another, but from our perspective, one is "using" energy and one is "generating" energy. It's a matter of perspective.)
- Energy = power x time. For example:
- If you use a 100 W light bulb for 1 hour, you use (100 W x 1 h = ) 100 Wh.
- If you use a 100 W light bulb for 1 hour each day for a year, you use (100 W x 1 hr/day x 365 days/yr = ) 36,500 Wh = 36.5 kWh.
- If you use 10 light bulbs, each 100 W, for 1 hour you use (10 bulbs x 100 W/bulb x 1 hr = ) 1,000 Wh or 1 kWh.
- If a 5,000 W (5 kW) solar array operates at full capacity for 1 hr, it generates (5,000 W x 1 hr = ) 5,000 Wh or 5 kWh of electricity. This is the energy that is generated by the panels, but some of that energy will be lost by the time it is used.
- If a 1,000,000,000 W (1 GW) power plant operates at full capacity for 24 hours, it would generate (1 GW x 24 hr = ) 24 GWh of electricity.
- If a 100,000 Btu/hr furnace operates at full capacity for 2 hours, it would use (100,000 Btu/hr x 2 hr = ) 200,000 Btu of energy.
- Irradiance is the amount of solar power (not energy) incident on a given surface area at any given time. This is usually measured in Watts per square meter (W/m2). All else being equal, more irradiance results in more output from a panel. Irradiance levels change throughout the day, as you can see in the image below. These charts illustrate the average hourly irradiance in State College, PA in July and December. As you can see, the peak irradiance in July averages about 750 W/m2. This is the irradiance on a horizontal surface. If you could tilt the surface (say, a solar panel) so it is perpendicular to the sun, the noon irradiance would be more than 1,000 W/m2. So if you want to imagine 1,000 W/m2, think of how your skin feels on a really hot summer day at Penn State. Hopefully, this gives you a "feel" for irradiance.
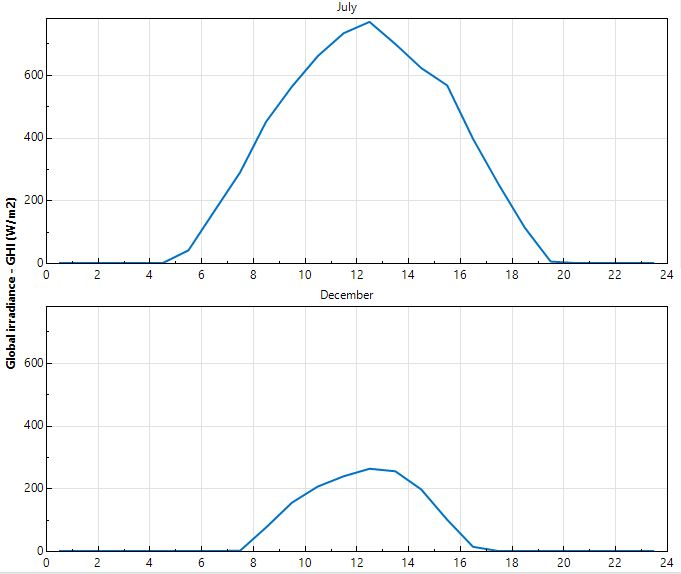
- Irradiation is the amount of solar energy that hits a surface over a given period of time. This is usually measured in kWh/day/m2 or kWh/yr/m2. See the chart below for a map of irradiation in the U.S., which illustrates the average daily irradiation levels throughout the year in the U.S. Of course the irradiation will change throughout the year (more in the summer and less in the winter), but this chart provides a clear idea of the overall amount of solar energy that is available all year. (Note that you could easily find the average annual irradiation by multiplying the daily irradiation by 365.) Keep in mind that this is the average daily irradiation on a surface that is "latitude tilt," which will be explained in more detail below. The chart provides an indication of solar potential. (Note that due to panel inefficiency and a few other factors, a solar panel will only convert a fraction of this solar energy into electricity.)

Solar PV
We will experience some solar PV installations and technology while traveling, so I provide some more details about it below.
- In order to maximize panel output, the panel should be as close to perpendicular to the sun's rays as possible, which allows it to capture the most solar energy possible at a given time. (Here is a really good interactive animation [270] of why a perpendicular panel captures the most sunlight.) Most solar panels are fixed, i.e., they don't move. This means that you need to choose your location carefully. For fixed panels, there are two factors to consider in this regard:
- Azimuth/orientation is the compass direction that the panel faces. Typically, 0º is due north, 90º is east, 180º is south, and 270º is west.
- Tilt is the angle above the horizon to which the panel is tilted.
- Shading is a very important consideration as well. All else being equal, more shading means less output.
- In the Northern Hemisphere, the rule of thumb to maximize the output of a fixed panel is that the panel should be faced due south (180º orientation) and at "latitude tilt." You may recall from a Geography class that latitude is how far north or south a location is from the equator. The equator is 0º, the tropics are at 23.5º, and the North and South Poles are at 90º north and south, respectively.
- For example, State College, PA is at just over 40º north, so the ideal array tilt is about 40º, and the ideal azimuth is 180º (south).
- Anchorage, Alaska is at about 61º north, so the ideal tilt and azimuth are about 61º and 180º (south), respectively.
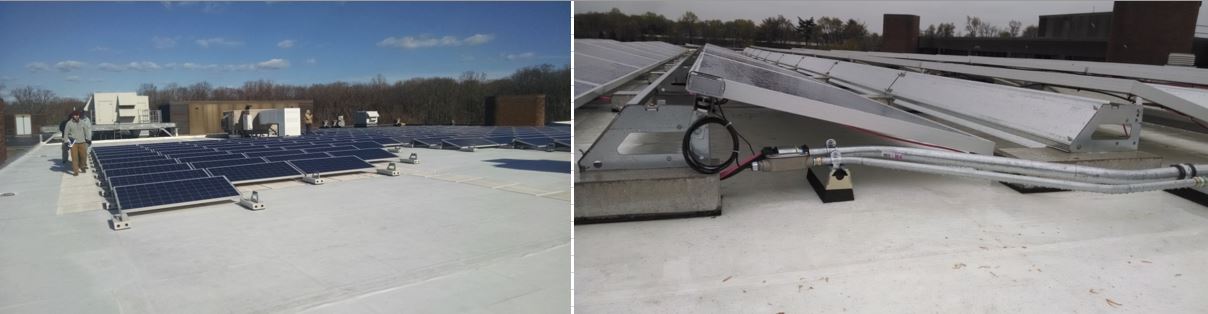
A few more terms that are important to know:
- A solar cell is the smallest current-generating part of an array. They can be any size but are normally around 6 inches by 6 inches. It's difficult to see, but in the image above there are 72 cells in each panel (12 rows, each with 6 cells).
- A solar panel (aka module) is a number of cells wired together in a single panel. They can be any size but are usually about 5 feet by 3.25 feet [271].
- A solar array is a number of panels wired together. The image above shows part of a solar array, which as I noted has 270 total panels.
- Capacity refers to the rated maximum output of a panel or array. Under optimal conditions, a 250 W panel will output about 250 W of electricity. Note that this is only the immediate output. By the time the electricity goes to the building or the grid, some of it is lost due to a variety of factors (usually 10% - 15%).
- The array above has 270 panels, and each panel has a capacity of 305 W. Thus, the capacity of the array is (305 W x 270 = ) 82,350 W, which is 82.35 kW.
- A solar panel outputs DC (direct current) electricity. DC means that the electricity flows in one direction. Household outlets (and the electric grid) use AC (alternating current) electricity, which rapidly alternates direction of flow (60 times per second in the U.S., in case you are interested), so electricity from an array must be converted to AC if it is to be used in a building or distributed to the grid. An inverter is a piece of equipment that converts DC to AC and is a standard part of most solar arrays.
- A grid-tied array is one that is connected to the grid. A standalone or off-grid system is not tied to the grid.
The Impact of Tilt and Orientation
Recall that the rule of thumb is that the optimal tilt is "latitude tilt," and the ideal orientation in the Northern Hemisphere is due south (180º). This begs the question: what happens if the tilt and orientation are not optimal? The answer, as you might guess, is "it depends." This impact can be quantified by something that is called tilt and orientation factor (TOF). The tilt and orientation factor is a decimal that indicates what percent of the maximum solar output you would receive throughout the year at said tilt and orientation. So if you install an array and it has a TOF of 0.85, that means that it will only be able to output about 85% of the energy it would output if it were at the ideal tilt and orientation.
Wilmington, Delaware is at about 40º north. As it turns out, the ideal tilt is closer to 35º (rules of thumb are only rules of thumb, after all!). The tables below show the TOF at different tilts and azimuths. The first table illustrates the TOFs of different tilts, all with an orientation of 180º. The second table shows the TOFs at different azimuths, all at a tilt of 35º (the ideal tilt). (You can investigate the TOF for locations throughout the U.S. by going to the Solmetric website [272].)
| Tilt (º) | Azimuth (º) | TOF |
|---|---|---|
| 0 | 180 | 0.87 |
| 5 | 180 | 0.905 |
| 10 | 180 | 0.935 |
| 15 | 180 | 0.959 |
| 20 | 180 | 0.978 |
| 25 | 180 | 0.991 |
| 30 | 180 | 0.999 |
| 35 | 180 | 1.0 |
| 40 | 180 | 0.996 |
| 45 | 180 | 0.985 |
| 50 | 180 | 0.969 |
| 55 | 180 | 0.947 |
| 60 | 180 | 0.92 |
| 65 | 180 | 0.888 |
| 70 | 180 | 0.851 |
| 75 | 180 | 0.81 |
| 80 | 180 | 0.764 |
| 85 | 180 | 0.715 |
| 90 | 180 | 0.662 |
| Tilt (º) | Azimuth (º) | TOF |
|---|---|---|
| 35 | 90 | 0.797 |
| 35 | 100 | 0.833 |
| 35 | 110 | 0.897 |
| 35 | 120 | 0.898 |
| 35 | 130 | 0.926 |
| 35 | 140 | 0.951 |
| 35 | 150 | 0.972 |
| 35 | 160 | 0.986 |
| 35 | 170 | 0.996 |
| 35 | 180 | 1.0 |
| 35 | 190 | 0.997 |
| 35 | 200 | 0.989 |
| 35 | 210 | 0.976 |
| 35 | 220 | 0.956 |
| 35 | 230 | 0.932 |
| 35 | 240 | 0.905 |
| 35 | 250 | 0.874 |
| 35 | 260 | 0.839 |
| 35 | 270 | 0.803 |
Calculating Solar Output
Okay, now we're ready to calculate the solar output. There are a number of software programs and a formula or two that can do this, but the National Renewable Energy Laboratory (NREL) provides a free one that is well-regarded in the energy industry called PVWatts [273]. In the video below, I demonstrate how to calculate the annual output of the array in the images above, which has the following specs:
- address: 400 Stanton Christiana Rd, Newark, DE
- 82.35 kW capacity
- 13º tilt
- 222º azimuth
Alright so, I'm going to demonstrate how to use the PVWatts Software from NREL. So, here is the home page. You can Google PVWatts and this will come up. And so, first thing you do is you type in the address. So this is based on the array that's detailed on the course website. So my address here is 400 Stanton Christiana Road in Newark. Ok, so you just click enter. And click go. And so, it used to be that it would come up with a map here, but they changed some things about this. So what it does, it just tells you the latitude and longitude of where you are. And so, I just happen to know that this is the right latitude and longitude, so I'm going to click to go to system info here. Ok, and here is where I can enter the specifics of the system. So, you can see the first window here is the DC system size, so this is the capacity. So mine is a 82.35 kW, you notice this is in kW, so be very careful about that. The module type, you have a couple different kinds. This is standard module. The fixed open rack is fixed meaning it's not, it doesn't move so there's no tracking. I mean you could do one to two-axis tracking here. The system losses, this shows you the overall losses from the rated capacity. So, I'm going to click on this loss calculator just to show you some of the variables here.
So this comes up, you can see that here. So right now the estimated system losses are 14%. And you can see that these are the actual, the individual factors in those losses. So soiling meaning you know, dust and stuff that gets on the panel. Shading, so it's assuming there's some shading part of the time. In this case, 3% of the time. You know, is there snow? Is there panel mismatches? Panels have small imperfections so they might have slightly different voltages. So there's wiring losses anytime you run electricity through a wire. There's heat losses. Connections to this is just sort the you know, the connections between the modules and other components. There's some degradation that occurs through panels getting warm, and it's also they just degrade a little bit over time. This name-plate rating there's slight imperfections, you know, the panels are usually guaranteed to be, have this capacity within a certain percentage. And then if they're older, you would actually, panels degrade over time. And the availability just means sometimes the system goes down for repairs or whatever, ok? And so you can actually change this. So like if I said this is in a perfect location without any shading at all I could put zero in here and you notice this drops to 11%. So we'll just go with our standard 14% and then you can click save. Ok? So that's where all the system losses come from. Now you can enter in your total. In this case, I have 13 degrees. Your azimuth, remember, is your also the same as your orientation. This one happens to be 222 degrees.
Ok, so now, you can also add some cost considerations. There's some other parameters you can feel free to mess around with those. In this case, this is actually commercial and I'm just going to, I happen to know our utility rate at our school. It's about 8 cents a kilowatt hour. Ok. Good, good, good.
Now you could also draw the system. Actually, you can't anymore. You used to be able to draw your system on a rooftop using Google Maps, but you can't do that.
Ok, so now we click to go to the results. And, here you go. So based on the system specs that I put in there, I'm going to generate about 106,000 kWh per year. Keep in mind that, you know, it says 106,365. This, you know, you should take this as a round number. You could have a really good solar year. There's a bunch of extra, you know, energy generated. You could have a bad year the system could go down a lot. There's I don't know a bunch of extra moisture and dust in the air, whatever. So this is just a really good estimate. Ok. Yeah, see it even gives you the range here. Based on this location, 101 to 110 kWh per year. So this actually gives you the month to month break down. Ok. So here's your actual output in AC. Remember panels produce DC, so this is AC output. And this is based on the cost information that I put into the specs on the previous sheet. So it's saying that, you know, I would earn about, or save about 8500 dollars a year with this system. Now what's really cool about this, is you can actually download these results. So, you can download this exact information but in spreadsheet form. And you can even download the hourly results which is really cool. I mean you get this Excel spreadsheet with 8,760 rows in it. It tells you the estimated output under normal typical meteorological conditions throughout an average year. So that's pretty cool. And then you can use, you know, make charts and so forth in Excel. Ok, so that's a basic tutorial on how to use PVWatts.
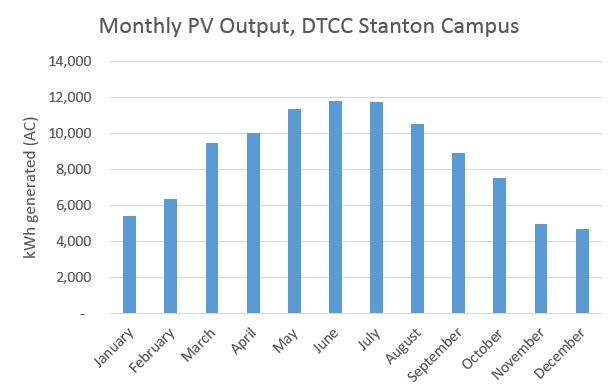
A Few More Notes
Hopefully, by now you have a relatively good grasp on some of the considerations that go into designing and calculating the output of solar PV. Solar PV really took off in the early- to mid-2000s, led by residential array installations, which generally had capacities of a few kW. The solar industry in the U.S. is not dominated by utility-scale solar, which is much cheaper per W to construct because of economies of scale. Utility-scale arrays can be thousands of watts (multiple MWs) in capacity!
Finally, there are a few ways that people can use and pay for solar PV:
- Systems can be purchased and owned by individuals. This can be done out-of-pocket or using loans. Out-of-pocket purchases usually generate the highest return.
- Power purchase agreements allow people or businesses to pay a third party to build an installation on their own roof. The individual or business then pays the third party for the electricity generated at a contractually agreed-upon rate. This is the model that SolarCity (now Tesla Energy) used to rise to prominence. This is a popular model because it requires no up-front cost (among other reasons).
- Community-owned solar or just community solar is used increasingly in the U.S. and elsewhere. Community solar allows individuals to "buy into" a solar array that is installed somewhere else, or perhaps on a shared roof or field space. This provides access to individuals and businesses that would not otherwise be able to use solar due to factors such as not having a suitable site (e.g., a heavily shaded roof) or living in rented space. (The SEIA provides a good overview of community solar here [274], and NREL provides a more robust explanation here [275].)
- Most utility-scale installations effectively act as power plants, and the electricity is sold to the grid.
Anaerobic Digestion
You may recall from EM SC 240N that bioenergy is energy that comes from living or recently living things. Common examples include wood from trees used for heating and ethanol from corn used as a gasoline additive. Another form - and one that we will see while traveling - is called anaerobic digestion. "Anaerobic" refers to "without air" and the "digestion" part refers to the microorganisms that digest organic material. Putting it together, anaerobic digestion refers to microorganisms breaking down organic material when no oxygen is present. The following descriptions of anaerobic digestion are from the EPA's Anaerobic Digestion website. All points of emphasis (bold letters) are mine:
Anaerobic Digestion
Anaerobic digestion is the natural process in which microorganisms break down organic materials. In this instance, “organic” means coming from or made of plants or animals. Anaerobic digestion happens in closed spaces where there is no air (or oxygen). The initials “AD” may refer to the process of anaerobic digestion or the built system where anaerobic digestion takes place, also known as a digester.
The following materials are generally considered “organic.” These materials can be processed in a digester:
- Animal manures;
- Food scraps;
- Fats, oils, and greases;
- Industrial organic residuals; and
- Sewage sludge (biosolids).
All anaerobic digestion systems adhere to the same basic principles whether the feedstock is food waste, animal manures or wastewater sludge. The systems may have some differences in design but the process is basically the same
Byproducts of Anaerobic Digestion
Biogas is generated during anaerobic digestion when microorganisms break down (eat) organic materials in the absence of air (or oxygen). Biogas is mostly methane (CH4) and carbon dioxide (CO2), with very small amounts of water vapor and other gases. The carbon dioxide and other gases can be removed, leaving only the methane. Methane is the primary component of natural gas.
The material that is left after anaerobic digestion happens is called “digestate.” Digestate is a wet mixture that is usually separated into a solid and a liquid. Digestate is rich in nutrients and can be used as fertilizer for crops
Uses of Anaerobic Digestion Byproducts
Biogas is produced throughout the anaerobic digestion process. Biogas is a renewable energy source that can be used in a variety of ways. Communities and businesses across the country use biogas to:
- Power engines, produce mechanical power, heat and/or electricity (including combined heat and power systems);
- Fuel boilers and furnaces, heating digesters and other spaces;
- Run alternative-fuel vehicles; and
- Supply homes and business through the natural gas pipeline
How biogas is used and how efficiently it’s used depends on its quality. Biogas is often cleaned to remove carbon dioxide, water vapor and other trace contaminants. Removing these compounds from biogas increases the energy value of the biogas...Biogas treated to meet pipeline quality standards can be distributed through the natural gas pipeline and used in homes and businesses. Biogas can also be cleaned and upgraded to produce compressed natural gas (CNG) or liquefied natural gas (LNG). CNG and LNG can be used to fuel cars and trucks.
Digestate is the material that is left over following the anaerobic digestion process. Digestate can be made into products like:
- Bedding for livestock;
- Flower pots;
- Soil amendments; and
- Fertilizers.
When properly processed, dewatered digestate can be used as livestock bedding or to produce products like flower pots.
Digestate can be directly land applied and incorporated into soils to improve soil characteristics and facilitate plant growth. Digestate can also be further processed into products that are bagged and sold in stores. Some emerging technologies can be employed post-digestion to recover the nitrogen and phosphorus in digestate and create concentrated nutrient products, such as struvite (magnesium-ammonium-phosphate) and ammonium sulfate fertilizers.
The video below from Michigan State University does a great job of explaining how they use anaerobic digestion to convert organic cafeteria and farm waste into useful energy and fertilizer. To view the transcript (and the video on YouTube, click this link [276].)
The South Campus anaerobic digester at Michigan State University aims to reduce odor and emissions from manure, food waste and biosolids, create a closed cycle for recycling organic material, and generate renewable energy. The digester will use a mix of dairy manure, dining hall food waste, biosolids (which are nutrient-rich organic materials), and other organic material from campus in the greater Lansing area. Once delivered, the food waste and biosolids will be treated (heated and pasteurized) at 160 degrees Fahrenheit for one hour to eliminate any potential pathogens. The material will then be mixed with manure from the MSU Dairy Teaching and Research Center and pumped into the digester.
The anaerobic digester is a sealed, airtight tank, which can hold 300,000 gallons. Organic material will be heated to 100 degrees Fahrenheit and will remain in the digester for 20 to 30 days. Inside the tank, mixers in the digester evenly distribute microorganisms. These microorganisms break down the mixture, producing biogas and nutrient-rich digestate. Biogas, which is roughly 60% methane, is a form of renewable energy which will be used to generate electricity. The system will generate enough electricity to offset the MSU DTRC, around 300 kilowatts per hour, with enough left over to help power MSU. The capturing and use of biogas will generate energy, shrink the carbon footprint of campus, and improve sustainability. What's left in the process is digestate, the nutrient-rich mixture that will be held in the final, storage tank until it can be utilized. Mixers in the storage tank will minimize settling for the potential 2.7 million gallons of digestate. Any unused biogas can also be stored in the sealed headspace. The nutrient-rich digestate will be used to fertilize croplands or other biological treatment processes to fuel research opportunities.
By utilizing anaerobic digestion technology, the organic materials from MSU will become resources. Renewable energy is created, while odors are reduced and emissions are eliminated. This project is one example of how Michigan State University is actively working to improve sustainability.
Thermodynamically speaking, the energy conversion process is:
- Sunlight is converted to biomass by plants.
- Plants are either used in the digester and converted to methane and CO2 or...
- Biomass is eaten by animals and converted to another form of biomass.
- Organic waste from animals is used in the digester and converted to methane and CO2.
- The methane can then be used for electricity and/or heat.
It is extremely important to keep in mind that this is a natural process, and thus will occur any time organic material is subjected to low- or no-oxygen conditions. One important implication of this is that organic material that ends up buried in a landfill will convert partially to methane because there is very little oxygen underneath all of that "junk." As I'm sure you recall, methane is about 30 times more potent than CO2 in terms of its global warming impact. If you took the same organic material and let it biodegrade in the open air (i.e., with access to oxygen) it would release mostly CO2. The sad irony of this is that well-meaning people and companies can actually make the (climate change) problem worse if their biodegradable containers end up in the landfill. This methane can be captured, and in many places in the U.S. and throughout the world is. This is also why impoundment hydroelectric facilities (big dams) can cause methane emissions - organic material collects upstream of the dam, and low-oxygen conditions often occur near the bottom of the reservoirs, causing methane to be released. Systems thinking, everyone!
Anaerobic Digestion Examples
Digesters can be pretty much any size. I've seen one as small as a car inner tube that was used to power a gas grill and heat a small greenhouse. Some of them can be larger, as you'll see below.
The pictures below are from a cooperatively-owned anaerobic digester in Lemvig, Denmark. I'm particularly fond of this because the entire setup is owned equally by about 25 farmers, and is a non-profit operation. All of the organic waste from the farms is transported to the digester, including leftover vegetation and various types of manure. The biogas is used to generate electricity in a turbine which is either sold to the grid or used in the digester, and the "waste" heat is used to run the anaerobic digester. The remaining heat is used for district heating for the town - it heats up water, which is then run through underground pipes to be used to heat homes. This type of generator is considered cogeneration, which means it is used to generate electricity and useful heat. Recall that most power plants are about 35% efficient because so much energy is wasted as heat. Believe it or not, this cogeneration system is over 90% efficient when you include all of the "waste" heat that is captured and used! All digestate is then returned to the local farms and used as organic fertilizers. It is truly a closed-loop system!
The images below show details of a smaller installation in Kussnacht, Switzerland. This installation is run by a single farmer (Seppi), who collects organic waste from his farm, other local farms, and area restaurants. Like the one above, Seppi collects the biogas and uses it in a cogeneration system that is about 90% efficient (50% heat, 40% electricity, and 10% is wasted). He runs a 100 kW generator and uses the electricity on his farm and sells the leftover to the grid. The heat is used to run the digester, and to provide space and water heating to his farm. He uses some digestate on his farm and gives the rest back to local farmers for free.
It just so happened that at the time of our visit (I brought students there for a study abroad experience), his previous digester had burnt down due to a generator fire. The upshot of this is that we were able to see inside the digester he was building, which you will see below.
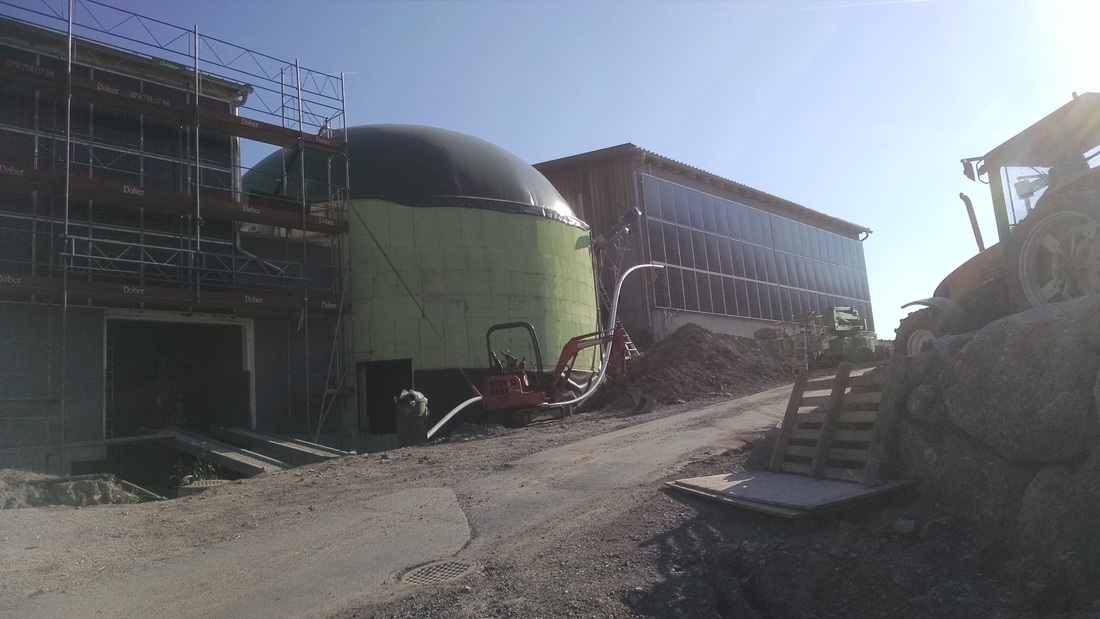
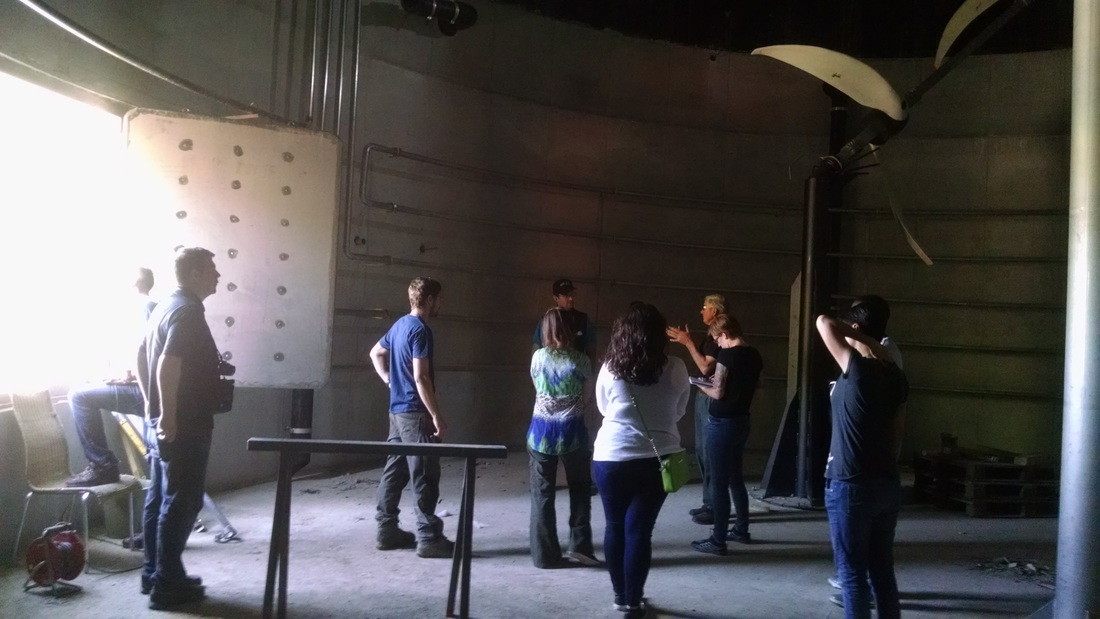
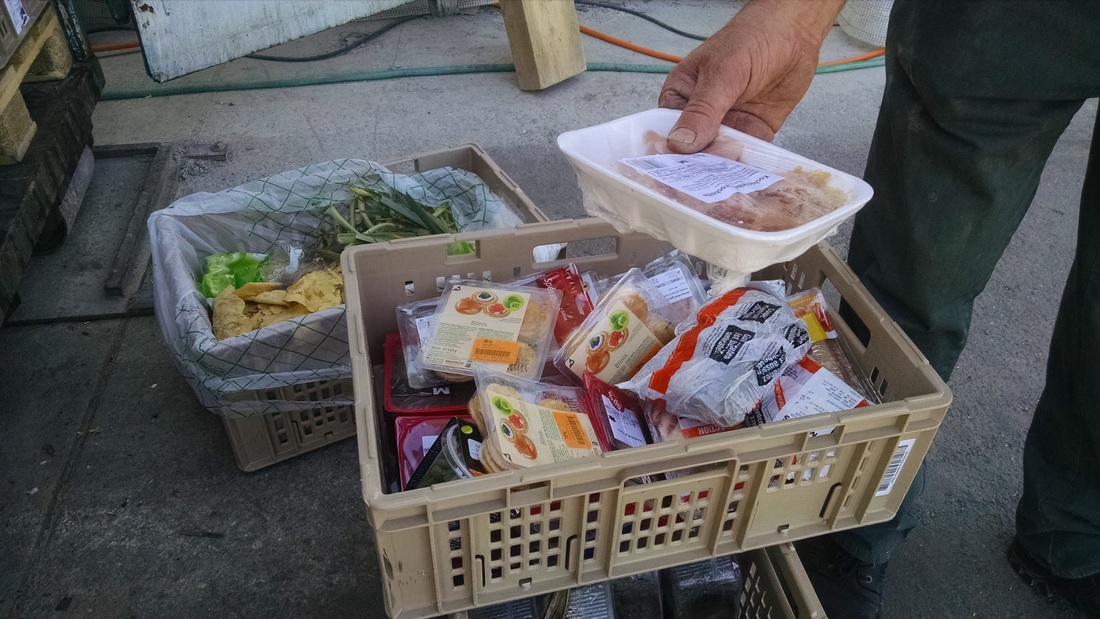
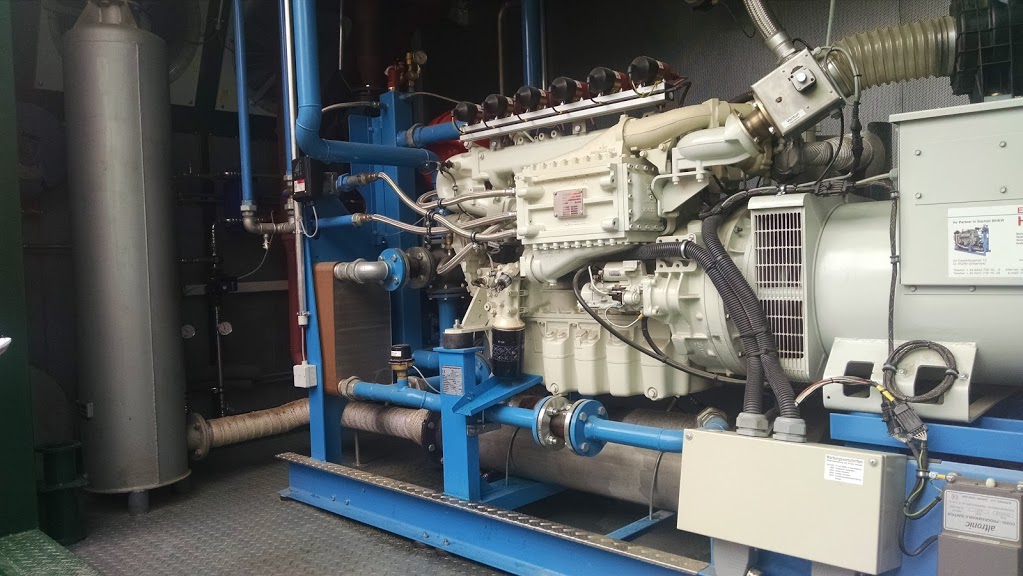
Summary and Final Tasks
Summary
By now you should be able to:
- identify different types of solar technologies;
- explain the basic process by which solar panels generate electricity;
- explain the difference between irradiance and irradiation;
- calculate energy use/generation given power and time;
- evaluate the impact of tilt and orientation on solar PV output;
- calculate the output of a solar array;
- explain how anaerobic digestion converts organic material to biogas; and
- identify some of the benefits of anaerobic digestion.
Reminder - Complete all of the Lesson 6 tasks!
You have reached the end of Lesson 6! Double-check the to-do list on the Lesson 6 Overview page [277] to make sure you have completed all of the activities listed there before you begin Lesson 7.
Lesson 7: Wind and Microhydro
Overview
In this lesson, we'll go over some of the basics of wind and microhydroelectric energy, including how to do some basic output calculations.
Learning Outcomes
By the end of this lesson, you should be able to:
- analyze wind energy maps;
- identify components of wind turbines;
- describe how solar energy is converted to wind and hydropower;
- calculate the output of a wind turbine;
- identify components of microhydro systems; and
- calculate the output of a microhydro system.
Lesson Roadmap
| To Read | Lesson 7 Online Content | You're here! |
|---|---|---|
| To Do |
|
|
Questions?
If you have any general course questions, please post them to our HAVE A QUESTION discussion forum located under the Discussions tab in Canvas. I will check that discussion forum regularly to respond as appropriate. While you are there, feel free to post your own responses and comments if you are able to help out a classmate. If you have a question but would like to remain anonymous to the other students, email me through Canvas.
If you have something related to the material that you'd like to share, feel free to post to the Coffee Shop forum, also under the Discussions tab in Canvas.
Wind Energy
As you may recall, the wind is caused by differential solar heating across the surface of the earth (as well as the shape of the earth), which causes large- and small-scale high and low-pressure systems to form. Air moves from areas of higher pressure to areas of lower pressure, which is what causes wind to occur. (If you are interested, this National Geographic site [278] explains some of the finer points of this process, including a lot of pictures.)
Wind, then, is just air that is moving. Simply put, this air has kinetic energy because wind has mass and is moving. (Anything in motion with mass has kinetic energy.) Because of the First Law of Thermodynamics, the energy in the wind must come from somewhere else. This "somewhere else," is solar energy. This energy (and power) can be quantified. See later in this lesson for an explanation of how to calculate this.
Wind Resources in the U.S.
Average wind speeds vary widely by geographical location. Take a few minutes to inspect the wind speed charts from the National Renewable Energy Laboratory below. Note the location of the greatest and smallest wind speeds, and think about the physical characteristics of those areas (e.g., flat, mountainous, on-shore, off-shore, etc.). Click here for a larger version of the 30 m wind speed image [279] and click here for the 80 m image. [280] Note that the average wind speed is higher at 80 m at the same location. Wind speed generally increases with height due to the decreasing influence of friction from the earth's surface and things on it. Modern turbines are generally tall enough to take advantage of 80 m wind speeds.
In addition to variability being a barrier to wind deployment, the location of wind resources is as well. In general - and certainly, in the U.S. - the best onshore wind resources are not located near major population centers. Approximately 50% [281] of the U.S. population lives within 50 miles of the coast, but as you can see in the maps below, this is generally not where the greatest onshore wind is located. This is a problem because transporting electricity over power lines results in energy loss (as heat) due to electrical resistance in wires. The longer the electricity has to travel, the more energy is lost. To minimize this loss, large (and very expensive) power lines must be built. As you can imagine, this type of infrastructure is lacking in areas of the country that do not have large populations.
However, it is clear from the second map that significant offshore wind resources are available very near the coast. Unfortunately, offshore wind is still expensive (remember from a previous lesson [282] that the LCOE is the highest of those listed). That, combined with resistance from local inhabitants had kept the offshore wind at bay until 2016 when the first offshore wind farm (albeit a very small one) in the U.S. was opened in Rhode Island [283]. There are over two dozen in the planning stages [284] as we speak. This is likely an area of growth in the near future.


Wind Turbines
To Read and View Now
- Read through the "Types of Wind Turbines" section of How a Wind Turbine Works [286], and click through the animation from U.S. DOE.
Now for some terminology and other considerations:
- Wind turbines convert wind to electricity. This is different than a windmill, which converts wind energy into mechanical energy that is used for another purpose (e.g., pumping water or in the "old days," grinding grain).
- A wind farm is a number of turbines that are installed in the same area, usually by the same company.
- Like solar panels, turbines have a capacity, which refers to the maximum electrical output of the turbine. A 2 MW turbine will output 2 MW of power at its peak. The amount of power is dictated by the velocity of the wind.
- Remember that energy = power x time, so if a turbine is operating at 2 MW for 1 hr, it will output (2 MW x 1 hr = ) 2 MWh of electricity. 2 MW is now considered a moderately large utility-scale turbine.
- A residential-scale turbine is much smaller, usually being a few hundred watts to a few kilowatts in size. For an example, see the image of the 2.4 kW residential turbine below. If this turbine is generating 2.4 kW for 10 hr, it would generate (2.4 kW x 10 hr = ) 24 kWh of electricity.
- Similar to solar, energy generation by a turbine is maximized by pointing the turbine so it is perpendicular to the wind. Large turbines have a mechanism that rotates the turbine so it faces the wind. This movement is called yaw.
See below for a diagram of key components of wind turbines:

There is a lot to digest here. The components I'd like you to know are as follows. All quoted text is from the U.S. Department of Energy [287]:
- Blades: "Lifts and rotates when wind is blown over them, causing the rotor to spin." The blades convert wind energy into motion energy (the rotating rotor).
- The hub (which is not indicated in the image) is the "nub" in front of the blades. Turbine heights are usually expressed using "hub height," which indicates how far above the ground the center of the hub is.
- The "blades and hub together form the rotor."
- The rotor spins the low-speed shaft, which is then (usually) converted to a higher rotation speed through a gear box.
- The high-speed shaft is attached to the other side of the gear box, which spins the generator. The generator converts this motion energy into electrical energy. Unlike solar panels, wind turbines generate AC electricity.
- The nacelle "sits atop the tower and contains the gear box, low- and high-speed shafts, generator, controller, and brake. Some nacelles are large enough for a helicopter to land on."
- The tower "supports the structure of the turbine." Modern turbines use cylindrical towers made of steel.
- Not pictured, but some modern turbines skip the gear box and use direct drive technology, spinning the generator at the same rpm as the low-speed shaft.
The basic energy conversion process is as follows:
- Solar energy is converted to wind energy.
- Wind energy is converted to motion energy by the blades, which rotates the shaft.
- The rotational velocity of the shaft is increased through the gear box. This does not increase the energy, and in fact, loses some due to frictional heat loss in the gear box.
- The gear box spins another shaft, which spins the generator.
- The generator generates an electrical current.
Turbines come in a very wide variety of sizes and capacities. The images below show some of this. (We will see the second turbine in Golden, CO!)


Wind Energy and Power Calculations
The power in the wind is given by the following equation:
Power (W) = 1/2 x ρ x A x v3
- Power = Watts
- ρ (rho, a Greek letter) = density of the air in kg/m3
- A = cross-sectional area of the wind in m2
- v = velocity of the wind in m/s
Thus, the power available to a wind turbine is based on the density of the air (usually about 1.2 kg/m3), the swept area of the turbine blades (picture a big circle being made by the spinning blades), and the velocity of the wind. Of these, clearly, the most variable input is wind speed. However, wind speed is also the most impactful variable because it is cubed, whereas the other inputs are not.
The following are calculations for power available in the wind at three different velocities for the Northwind 100C turbine. This is the newer version of the Northwind 100A on the previous page. The calculations will show what happens when you double, then triple the velocity. Take a moment to think about how much available power will increase if you double and triple the velocity:
- The standard [294] density of air is 1.225 kg/m3
- The turbine has a 24 m diameter, which means the radius is 12 m. Thus, the swept area of the turbine is: (pi)r2 = 3.14159(122) = 452.4 m2
- We'll start with a 6 m/s wind.
- The power in the wind at 6 m/s is: 1/2 x ρ x A x v3 = 0.5 x 1.225 kg/m3 x 452.4 m2 x (6 m/s)3 = 59,851 W = 59.85 kW
- At 12 m/s: 1/2 x ρ x A x v3 = 0.5 x 1.225 kg/m3 x 452.4 m2 x (12 m/s)3 = 478,808 W = 478.8 kW (8 times as large)
- At 18 m/s: 1/2 x ρ x A x v3 = 0.5 x 1.225 kg/m3 x 452.4 m2 x (18 m/s)3 = 1,615,979 W = 1,616 kW = 1.616 MW (27 times as large)
As you can see, when the velocity doubles, the power increased by a factor of 8 and when the velocity triples, it increases by a factor of 27. This is because the velocity is cubed: 23 = 8 and 33 = 27.
Calculating Wind Turbine Output
The output of a wind turbine is dependent upon the velocity of the wind that is hitting it. But as you will see, the power is not proportional to the wind velocity. Every turbine is different. In order to determine the output of a specific turbine at a given wind velocity, you need its power curve. The power curve and corresponding data for the Northwind 100C can be seen below:

| wind speed (m/s) | 1 | 2 | 3 | 4 | 5 | 6 | 7 | 8 | 9 | 10 | 11 | 12 |
|---|---|---|---|---|---|---|---|---|---|---|---|---|
| power output (kW) | -0.5 | -0.5 | 1.2 | 7.2 | 14.5 | 24.7 | 37.9 | 58.7 | 74.8 | 85.1 | 90.2 | 94.7 |
| wind speed (m/s) | 13 | 14 | 15 | 16 | 17 | 18 | 19 | 20 | 21 | 22 | 23 | 24 | 25 |
|---|---|---|---|---|---|---|---|---|---|---|---|---|---|
| power output (kW) | 95.3 | 95.1 | 94.2 | 92.9 | 91.2 | 88.9 | 87.1 | 84.1 | 81.3 | 78.6 | 75.1 | 74.3 | 71.7 |
As you can see, even though this is a 95 kW turbine, it only provides (approximately) that much power at a very limited number of wind speeds - about 12 m/s through about 15 m/s. Counterintuitively, the power output decreases if the wind speeds up past that point. For safety reasons, the turbine will stop spinning if the wind speed is higher than 25 m/s.
Assuming the turbine is operating properly, the output calculation is pretty straightforward. You just multiply the output at a given velocity by the number of hours the wind is blowing at that velocity. For example, let's assume that the wind hitting a Northwind 100C in a given day has the following velocities. (Note that in reality, the wind would likely change much more frequently than this. I just wanted to make the math relatively easy.):
| velocity (m/s) | number of hours at that velocity |
|---|---|
| 6 | 4 |
| 8 | 8 |
| 12 | 5 |
| 15 | 4 |
| 16 | 3 |
| 16 | 3 |
The total output at 6 m/s would be: 24.7 kW (the output at 6 m/s from the power curve table) x 4 hrs = 98.8 kWh.
Based on the power curve table above, the total output for this day would be:
| velocity (m/s) | number of hours at that velocity | total output (kWh) |
|---|---|---|
| 6 | 4 | 98.8 |
| 8 | 8 | 469.6 |
| 12 | 5 | 473.5 |
| 15 | 4 | 376.8 |
| 16 | 3 | 278.7 |
| 16 | 3 | 278.7 |
| Total | 24 | 1,697.4 |
Capacity Factor
One last consideration to make for wind turbines (or any energy source) is something called capacity factor. Capacity factor indicates how much energy is generated by a source relative to the maximum amount of energy it could provide. This is expressed as a percentage, and is usually determined over the course of a single year. This provides insight into how well-sited the turbine is, but in general indicates how available an energy source is throughout the year. The closer to 100%, the more the energy source is available throughout the year.
The formula is capacity factor = actual output/maximum possible output.
For a wind turbine, the maximum possible output would be the capacity x 8760 hr (there are 8760 hrs in a year). So for the Northwind 100C, the maximum output is: 95 kW x 8760 hr/yr = 832,200 kWh/yr (or 832.2 MWh). If the actual output over the course of a year was 250,000 kWh, the capacity factor would be:
- capacity factor = actual/maximum output = 250,000 kWh/832,200 kWh = 30%
The average capacity factor of the U.S. wind fleet hovers around 32% - 34% [296], but new turbine designs have been tested in the 60%+ range, like this forthcoming 12 MW behemoth [297] by GE. It's not unusual to see 40% and up capacity factors for well-sited wind farms.
Microhydro
Hydropower
Like moving air, moving water has kinetic energy (it has mass and it is moving). But water is much denser than air - this is obvious to anyone who has waded across a deep stream or played in ocean waves. If you recall, air has an average density of 1.225 kg/m3. One cubic meter of water, on the other hand, has a mass of 1,000 kg, or one metric ton (aka one tonne). It may be hard to believe, but a cube of water that is about 3.3 feet on each side weighs over 2,000 pounds!
Where does this kinetic energy come from? Take a second to think about it...Water only flows downhill, so if you see moving water it came from a higher elevation. This kinetic energy is thus converted from gravitational potential energy. How did it get this gravitational potential energy? Well, something had to take the water up to the higher elevation. The only natural way this happens is through evaporation, which is almost always caused by the sun, in a number of different ways: Water that is heated by the sun may evaporate. Wind also evaporates water, but remember that wind gets its energy from the sun. Plants evapotranspirate water, but again, they get their energy from the sun. Even the minor amount exhaled by humans is solar energy since all of our energy comes from the sun. The only major exception is that some evaporative heat is provided by geothermal energy from the earth, e.g., in volcanoes. At any rate, almost all hydropower/energy comes from the sun
How a Hydropower Plant Works
Humans have been using hydropower for thousands of years [298]. According to the U.S. Department of Energy, the Greeks used water to spin wheels to grind grain over 2,000 years ago. Modern humans figured out how to convert hydropower to electricity by using a turbine and generator (see below), which is called hydroelectricity, for obvious reasons. The first known use of hydroelectricity [299] was in 1878 to power a single lamp in Northumberland, England. Larger plants were installed in 1881 in the U.S., and the first commercial-scale plant was built in the U.S. in 1893 in Redlands, California.
All hydroelectric power plants operate on the same principle. Moving water spins a turbine, which spins an electric generator. See below for an illustration of an impoundment facility, which uses a dam to create a reservoir of water.
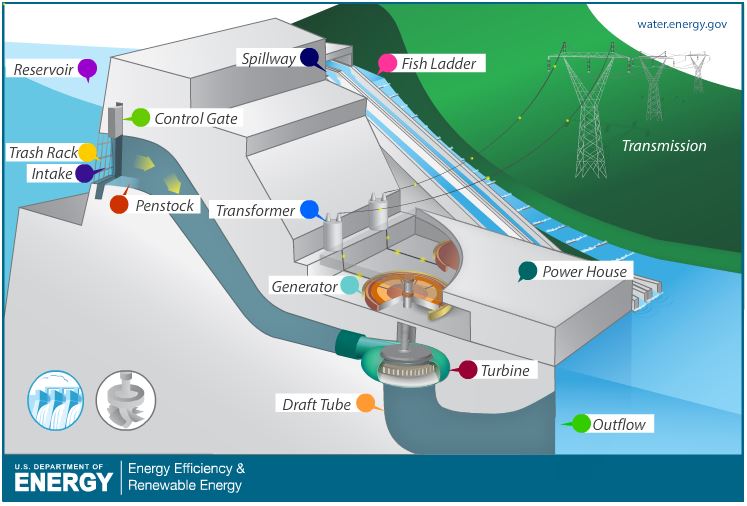 [300]
[300]
Explaining all components in this image goes beyond the scope of this lesson, but feel free to click on the image above or here for a clickable image [301] to learn more about each. The important terms for this lesson are:
- The penstock is a conduit through which the water flows from a higher to a lower elevation.
- The turbine spins due to the force of the water flowing out of the penstock.
- The turbine spins the generator, which generates electricity.
This basic process - flowing water spins a turbine, which spins a generator - is common to all types of hydroelectricity installations. There can be any number of other components, and the size/scale may be different, but this core process is the same.
Microhydroelectricity
Like all other electricity sources, hydroelectric power plants have a rated capacity. Large impoundment facilities can have capacities on the order of GWs (billions of watts). The largest facility in the world - the Three Gorges Dam in China - has a capacity of 18 GW. According to the U.S. Department of Energy, a microhydro system has a capacity of up to 100 kW [302]. Most systems are much smaller. A residential-scale microhydro system is more likely to be a few kWs in size.
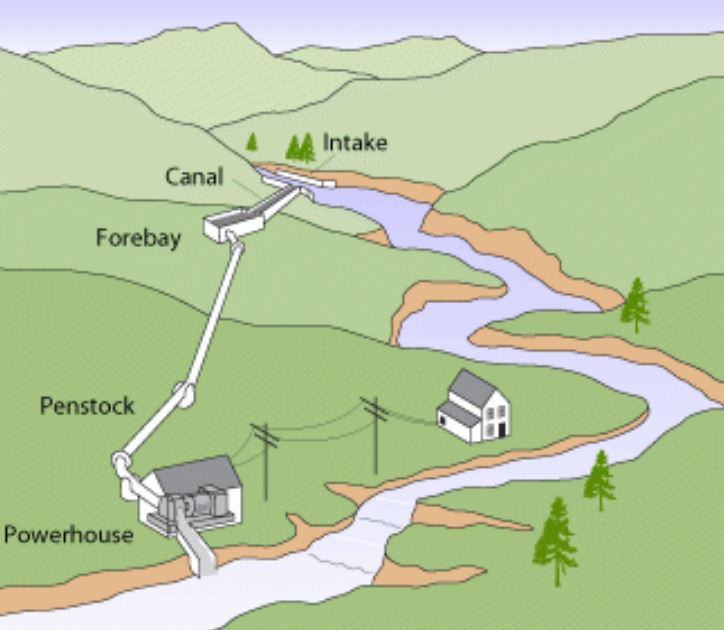 [300]
[300]
A typical microhydro system is illustrated in the image above. Systems can vary significantly in style and size, but according to the U.S. DOE, the following components are commonly seen in most systems [304]:
- The water is often diverted from a stream. If so, it is usually transported to a forebay, which is akin to a small impoundment facility that creates a small reservoir.
- There is some kind of conveyance that provides the water to the turbine. In the illustration above, this is done by a penstock, which is often made of PVC pipe. This could also be done by a channel.
- The water spins a turbine, which spins a generator, which provides electricity. This is all contained in the powerhouse in the image above. There are a number of different types of turbines, most of which require a jet of water that is sprayed through a nozzle at the end of the penstock. If you are interested, see details in this reading from the U.S. DOE [304].
Energy and Power in Water
As described above, the kinetic energy in flowing water starts out as gravitational potential energy. The gravitational potential energy of a given amount of water at any elevation can be calculated using the following equation:
- Pe = m x g x h
- Pe = potential energy in Joules
- m = the mass of the water in kg
- g = the acceleration due to gravity (m/s2)
- h = the height of the water in m (usually called the "head")
The force of gravity is essentially a constant (it gets a little bit smaller with height). Thus, all else being equal, as height and mass increase, the potential energy increases. Keep in mind that this equation only illustrates the maximum kinetic energy available to a hydropower system. In reality, there are always losses by the time the kinetic energy is converted to electricity.
The power available in water at height is given by a similar equation:
- P = Q x g x h
- P = power in watts
- Q = discharge of water in kg/s (this is also mass per unit time)
- g = acceleration due to gravity (m/s2)
- h = head (m)
Again, this is only the hypothetical maximum - it is impossible to capture all of this power in a turbine. This equation is almost the same as the potential energy equation - you just substitute discharge for mass. Since the discharge is kg/s, or mass divided by time, if you compare the two equations, the power equation is the energy equation divided by seconds. This makes sense if you think about it: the potential energy is given in Joules, and the power equation is given in watts. Recall that 1 J/s = 1 W. Makes sense, right?
Calculating Microhydro Output
It turns out that calculating the approximate power output of a microhydro system is not terribly difficult. According to the U.S. DOE, a typical system has an efficiency of about 53%. This includes losses from the nozzle, the wiring, the generator, and a few other things. The power of a microhydro system with this efficiency is approximately:
- power = net head x flow /10
- power = electric power in W
- net head = the gross head in ft including the head loss in the penstock
- flow = flow of water in gal/min
- 10 = conversion factor (this can range from 8 - 12, with 10 being about average)
To determine the gross head, you measure how many feet above the generator the penstock starts. Note that this is not the same as the length of the penstock. The penstock is sloped, and thus will be longer than the head. The head loss is based on a few factors, including the diameter of the penstock, the pressure inside the penstock, and the number of turns and fittings there are in the penstock. According to Homepower Magazine, 30% is a typical amount of head loss, which means you would calculate the gross head time 0.7 to determine the net head. The flow of a stream through a penstock can vary wildly, from a few gallons per minute to a few hundred (or more). To provide some context a garden hose usually has a flow of about 20 gallons per minute, though this can also vary significantly depending on a number of factors.
Let's say I have a property in which I can create a diversion channel and forebay 100 ft above a power house, and I measure my flow at 50 gpm. Assuming a good system design which includes a head loss of 30%, my output would be:
- power = net head x flow / 10
- power = 100 ft x 0.7 x 50 / 10 = 350 W
- If I could get this to operate all day, I would get (350 W x 24 h/day = ) 8400 Wh or 8.4 kWh/day
Further Reading/Viewing
This lesson only scratches the surface of microhydro systems. There are many designs and factors to consider. Each site is different. For a more detailed explanation, see this website from the U.S. DOE [305], and for a good case study, see this example from Homepower Magazine ( [306]starting on p. 32). There are dozens of videos on YouTube that detail specific systems, many of which are worth checking out if you are interested.
If you are interested in learning more about the power and energy available in water for hydroelectric, see this video presentation I put together [307]for another course.
Site Visits
Starting this week and moving forward — each week, I will provide links to some of the locations/organizations we will visit. This is not required reading. I suggest browsing through them if/when you have time. This may help inspire your final project proposals!
- Solar Energy International [308] (SEI), Paonia
- GRID Alternatives [309], Denver
- Rocky Mountain Institute [310], Boulder
- Blue Terra Waste Solutions [311], Denver and Longmont
Summary and Final Tasks
Summary
By now, you should be able to do the following:
- analyze wind energy maps;
- identify components of wind turbines;
- describe how solar energy is converted to wind and hydropower;
- calculate the output of a wind turbine;
- identify components of microhydro systems; and
- calculate the output of a microhydro system
Reminder - Complete all of the Lesson 7 tasks!
You have reached the end of Lesson 7! Double-check the to-do list on the Lesson 7 Overview page [312] to make sure you have completed all of the activities listed there before you begin Lesson 8.
Lesson 8: Waste Management
Overview
The focus of this lesson is on ways to sustainably manage natural resources.
Learning Outcomes
By the end of this lesson, you should be able to:
- define natural resources;
- describe why the term "natural resources" is anthropocentric;
- analyze the difference between linear and circular resource flows;
- describe the differences between reduction, reuse, and recycling; and
- identify components of the circular economy and cradle to cradle certification.
Lesson Roadmap
| To Read | Lesson 8 Online Content | You're here! |
|---|---|---|
| To Do |
|
|
Questions?
If you have any general course questions, please post them to our HAVE A QUESTION discussion forum located under the Discussions tab in Canvas. I will check that discussion forum regularly to respond as appropriate. While you are there, feel free to post your own responses and comments if you are able to help out a classmate. If you have a question but would like to remain anonymous to the other students, email me through Canvas.
If you have something related to the material that you'd like to share, feel free to post to the Coffee Shop forum, also under the Discussions tab in Canvas.
Natural Resource Use
I'm sure you've heard the term "natural resources" used many times, e.g., when someone talks about "preserving natural resources" or when you hear about "natural resource management." It's a pretty innocuous term, and seemingly straightforward. If you asked someone what natural resources are, they would probably say something about "resources provided by nature, such as trees, minerals, and food" or something to that effect. (This is actually a pretty good definition, by the way!) When thinking about the definition, it's easy to focus on the "nature" component and look past the "resources" part. Specifically, it is important to note that "natural resources" is an anthropocentric (human-centered or focused) term. It is a concept that only exists because of humans because it refers to things that impact humans. To demonstrate this, let's look at a few definitions of natural resources:
things such as minerals, forests, coal, etc. that exist in a place and can be used by people
~Cambridge Dictionary [313]
industrial materials and capacities (such as mineral deposits and waterpoer) supplied by nature
~Merriam-Webster [314]
a naturally occurring source of wealth, as land or water; the natural wealth of a country, consisting of land, forests, mineral deposits, water, etc.
~dictionary.com [315]
Any way you slice it, without humans natural resources don't exist, they would just "be" or just be "nature." This is important to keep in mind as we go over this lesson: by definition, natural resources only exist as a concept because they can be used by humans.
Hidden Resource Use
Personal consumption expenditures (household spending on goods and services) constitutes nearly 70% of U.S. GDP [316]. Much of this is on services, but Americans now spend nearly 4.5 trillion dollars on "goods," which includes everything from food, to energy, to cars, houses, clothing, and other goods. See the charts below from the Federal Reserve Bank of St. Louis [317] for these consumption trends over the past 60+ years. They are an excellent, reliable resource for economic data. (For a good explanation of goods and services, see this explanation [318]from thebalance.com.)
The moral of the story: Americans buy a lot of stuff! This has many implications, but one is particularly important with respect to this lesson. Namely, almost all of this spending requires the use of natural resources. Obviously, things like cars and clothes require raw natural resources to produce, though you may be surprised at how many. Take a look at the infographic below from Allianz to get some idea of how many different natural resources from all over the world are needed to make a car.
 [320]
[320]
All goods require some mixture of raw natural resource extraction, manufacturing, processing, shipping, packaging, use, and disposal. All of this requires energy and resources. Most of this use, as indicated in the infographic above, is hidden. I will give you one more quick example: I used to assist with industrial energy audits on a part-time basis while in college. One of the places we audited was a "feed mill," which is essentially a factory that produces chicken feed. (Related note: Delaware is considered the poultry capital of the U.S.) The facility looked a lot like the one in the image below.
I was dumbfounded at how much energy and resources went into just producing feed for chickens! While I was there, there was a constant arrival of tractor trailers hauling raw ingredients - corn, soybean, nutrient mixes, and other things - and the machinery was massive and energy-intensive. According to Delmarva Poulty Industry, Inc. [324] (Delmarva includes parts of Delaware and the eastern shores of Virginia and Maryland), the Delmarva chicken industry had the following specifics in 2017:
- 605 million chickens (4.2 billion pounds) produced
- They purchased "87 million bushels of corn, 36 million bushels of soybeans, 1.6 million bushels of wheat," all for chicken feed. Imagine all of the water, fertilizer, and energy that went into the production of these crops.
- They "purchased $240 million in packaging and processing supplies."
The point here is not to go in-depth into the poultry or automobile industries, but to indicate that nearly everything you purchase is the product of a tremendous use of resources, much of which is hidden. But services such as healthcare and education also require the use of resources. Medical facilities need chairs, tables, x-ray machines, paper, and so forth, and use a lot of energy. Even an online class requires physical resources, in particular, electricity and all of the lifecycle resources used to generate that energy (mines, power plants, power lines, equipment to manage it all, etc.), but also the device you are viewing this on is the result of a global supply chain of goods. This type of lifecycle resource use and our consumption-driven economy are major contributors to the fact that we would need nearly 5 planet earths to satisfy humanity's needs if everyone lived like the average American.
Resource Flows
Linear Resource Flow
The problems associated with the massive amount of resources used to produce everyday goods and services is compounded by the fact that this system is based mostly on linear resource use. This is often referred to as "take, make, waste." An illustration of the basic resource flow is shown below.
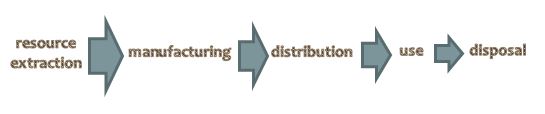
This linear model typically goes something like the following:
- Natural resources are extracted through mining, growing, gathering, etc. They are often shipped all over the world, e.g., as indicated in the automobile infographic above.
- These raw resources are then manufactured into final goods, both perishable and non-perishable. This almost always occurs on an industrial scale (think of the massive factory farms, manufacturing plants, and even the feed mill illustrated above).
- These goods are then distributed, usually globally. Take a look at the label on your clothes (Bangladesh and Vietnam are common), electronics (China, most often), and food (could be anywhere - Chile, Mexico, New Zealand, etc.).
- They are then used by the end user.
- Most of the time, they are then disposed of in a landfill.
- Note that all along the way there are waste and emissions being generated, most of which are emitted or landfilled.
This model requires the constant input of raw natural resources because of the waste and emissions along the way, and because most of the "waste" is dumped in a landfill (and possibly incinerated), and all of this is done primarily with the use of non-renewable energy. This is a major reason why our ecological footprint is so large and we are using natural resources at such a high rate. Globally, only about 14% [326] of the primary energy used is renewable. In the U.S., over half of municipal solid waste (MSW) ends up in a landfill. Keep in mind that municipal solid waste is basically household garbage, and does not include construction, industrial, or farming waste, which make up a large portion of the waste stream. All of this adds up to 262.4 million short tons of MSW generated (about 4.5 pounds per person per day), of which about 138 million tons ends up in a landfill, according to the U.S. EPA [327].
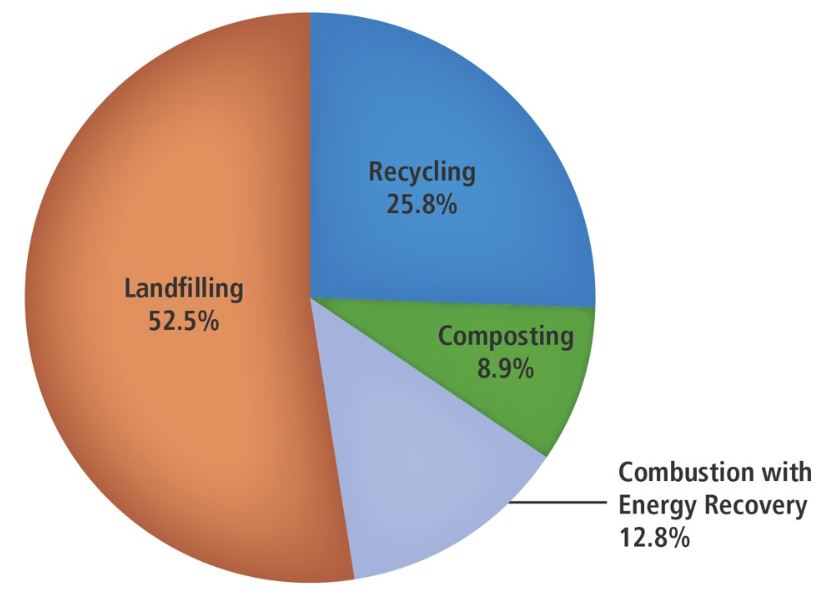
Circular Resource Flow
Contrast this with a circular resource flow model, in which there is almost no waste. Any resources that are unused in each step are reintegrated back into the system. Manufacturing "waste" is reused or recycled, as are final products used by the end user. If this could all be run using renewable resources, then much of the pollution would be eliminated as well. In fact, in an ideal circular resource system, the idea of "waste" does not exist. This is the philosophy behind "zero waste" initiatives. Note that because of thermodynamics, there will be some inefficiency, and thus some loss. This is why there will still be some natural resource input required.
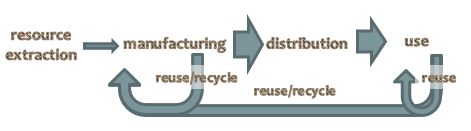
It is worth noting that nature utilizes circular resource flow. Recall that it was stated above that the concept of natural resources is anthropocentric. There is no waste in nature - everything is a resource for some other process. Resources move around in continuous flows, and all "waste" is reintegrated back into the system, with the exception of some heat loss that is radiated back to space. All of this is of course driven by renewable energy, and any energy lost to space is offset by energy coming in from the sun. This is why many zero waste (and other sustainability) advocates say that the more we can design human systems to mimic natural systems, the more sustainable those systems will be. As you will see in a future lesson, this is the fundamental philosophy of permaculture.
The Zero Waste Alliance provides an excellent visualization of what such a system could look like. The images below show natural resource flows. The thickness of the flows indicates the relative amount of resources flowing through that part of the system. As you can see, by recovering most of the "waste" throughout, the raw materials flow (at the far left of each diagram) is greatly reduced. Note that the second image shows an idealized flow - there will be some loss due to thermodynamics. Even without thermodynamic loss, some natural resource extraction is required because some resources cannot be directly reused in the manufacturing process.
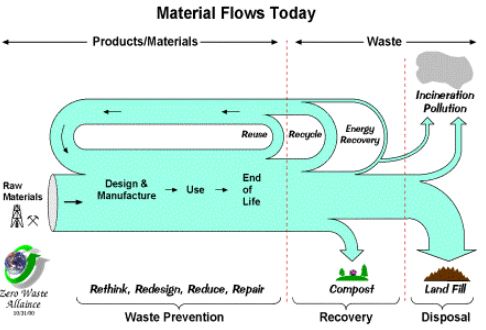
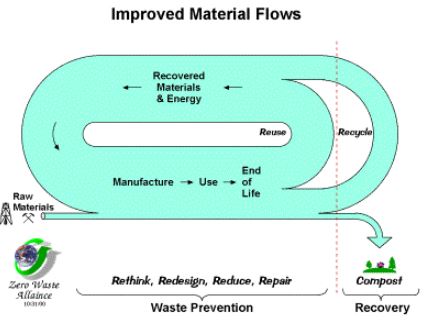
Waste Management Strategies
The Three Rs
No doubt you have seen some variation of the image below. Most recyclable packaging has a triangle design, which indicates that it is recyclable. You are probably familiar with the phrase "reduce, reuse, recycle," which is hammered home to (most) kids at a very early age in the U.S. The image clearly gives a nod to circular resource use (follow the arrows!). Each term refers to a slightly different way to manage waste. I provide an example of each in parentheses as it relates to a plastic water bottle:
- "Reduce" refers to not creating the item/material in the first place. (Don't buy or use the plastic bottle in the first place.)
- "Reuse" refers to reusing the item (or at least part of the item) for another purpose. (Examples include refilling it with water and using it again, using the plastic bottle to start a seedling or make a small bird feeder. If you make a new, useful product out of it - such as the bird feeder - it is sometimes considered "upcycling.")
- "Recycle" refers to breaking the item down into smaller components and using these materials as a replacement for materials in newly manufactured goods. (A plastic bottle can be recycled and made into a different plastic product.)
However, what most people do not know is that "reduce, reuse, recycle" is actually a priority list. In other words, the best way to minimize the impact of waste is to not use it in the first place (reduce), the second best way is to reuse it, and the third best way is to recycle it. Recycling requires a lot of inputs: inefficient trucks to pick it up and transport it, massive machinery to sort it and break it down, more machinery to produce the new good (often after shipping the raw resource far away), then more energy and resources to distribute the good. This entire process uses energy and generates waste. Reuse is less impactful because it cuts out all of the downstream impacts of recycling, but it does not eliminate all of the upstream impacts that resulted from producing the good in the first place.
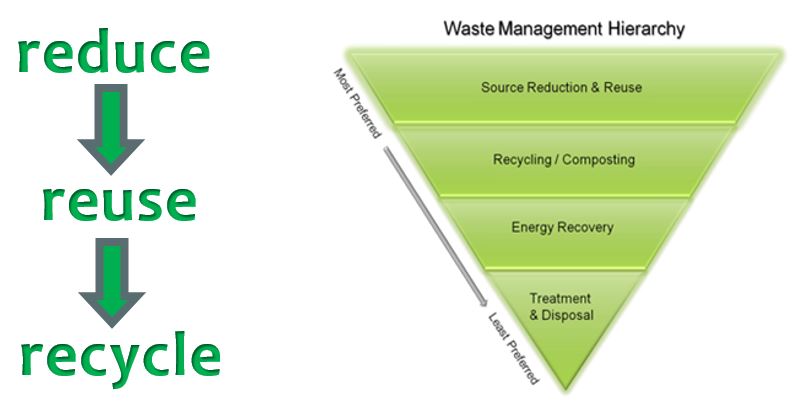
While all of this is true, recycling is still much more beneficial than landfilling! The following are some statistics from the EPA [330]. All information was taken from WARM, the Waste Reduction Model. (Click here to download the Excel file [331] and do your own analysis, or just explore the data.) Note that MMBTU is one million BTUs of energy, and MTCO2e refers to one megaton of carbon dioxide equivalent:
| material | reduction energy savings (MMBTU/ton) | recycling energy savings (MMBTU/ton) | combustion energy savings (MMBTU/ton) | reduction emissions savings (MTCO2e/ton) | recycling emissions savings (MTCO2e/ton) | combustion emissions savings (MTCO2e/ton) |
|---|---|---|---|---|---|---|
| aluminum cans | 89.69 | 152.76 | -0.60 | 4.91 | 9.11 | -0.04 |
| glass | 6.9 | 2.13 | -0.50 | 0.53 | 0.28 | -0.03 |
| PET plastic | 50.26 | 31.87 | 10.13 | 2.20 | 1.12 | -1.21 |
| corrugated cardboard | 33.23 | 0.69 | 6.64 | 5.60 | 3.12 | 0.51 |
| newspaper | 36.46 | 16.49 | 7.53 | 4.77 | 2.75 | 0.58 |
Notice that with the exception of aluminum cans, the energy and emissions reductions are always greater when you reduce than when you recycle. Based on what I could see in the WARM spreadsheet, aluminum cans are the only material for which recycling is more impactful. Also note that some materials require more energy to burn than they do to landfill (see the negative numbers), and for ALL materials listed, combustion is worse for emissions than recycling or reducing.
The Circular Economy
The circular economy, as you will see below, utilizes circular resource use.
Living systems have been around for a few billion years and will be around for many more. In the living world there's no landfill; instead, materials flow. One species' waste is another's food. Energy is provided by the sun. Things grow, then die, and nutrients return to the soil safely. And it works. Yet as humans we've adopted a linear approach. We take, we make, and we dispose. A new phone comes out, so we ditch the old one. Our washing machine packs up, so we buy another. Each time we do this, we're eating into a finite supply of resources and often producing toxic waste. It simply can't work long-term. So what can? If we accept that the living world's cyclical model works, can we change our way of thinking so that we too operate a circular economy?
Let's start with the biological cycle: How can our waste build capital rather than reduce it? By rethinking and redesigning products and components and the packaging they come in, we can create safe and compostable materials that help grow more stuff. As they say in the movies, no resources have been lost in the making of this material.
So what about the washing machines, mobile phones, and fridges? We know they don't biodegrade. Here we're talking about another sort of rethink. A way to cycle valuable metals, polymers, and alloys so they maintain their quality and continue to be useful beyond the shelf life of individual products. What if the goods of today became the resources of tomorrow? It makes commercial sense. Instead of the throwaway and replace culture we’ve become used to, we'd adopt a return and renew one where products and components are designed to be disassembled and regenerated.
One solution may be to rethink the way we view ownership. What if we never actually owned our technologies? We simply licensed them from the manufacturers.
Now let's put these two cycles together. Imagine if we could design products to come back to their makers, their technical materials being reused and their biological parts increasing agricultural value? And imagine that these products are made and transported using renewable energy? Here we have a model that builds prosperity long-term. And the good news is there are already companies out there who are beginning to adopt this way of working. But the circular economy isn't about one manufacturer changing one product. It's about all the interconnecting companies that form our infrastructure and economy coming together. It's about energy. It's about a rethinking of the operating system itself. We have a fantastic opportunity to open new perspectives and new horizons. Instead of remaining trapped in the frustrations of the present, with creativity and innovation, we really can rethink and redesign our future.
Here’s an idea. What if you never had to buy a light bulb again? Instead, you lease light, like you lease a car or an apartment. It's just one idea that’s part of the circular economy. Before we can understand the circular economy, well, it helps to define the linear economy. Most organizations today operate in the linear economy which is based on a 'take, make, and dispose' model. So, for example, a light bulb company takes resources, like glass or metal, to manufacture its products. The company makes the bulb and sells it to a customer like me who uses it. Once the light bulb burns out, I dispose of it. It’s likely neither the company nor I will ever see that light bulb again. For a light bulb company to make money in the linear economy, it tries to buy materials for the lowest cost possible and to sell as many bulbs as possible. This model operates as if there are infinite resources, like glass or metal, in the world. But you and I know that’s not the case. That’s why the circular economy treats materials like they're finite. A company in the circular economy doesn’t just recycle products but maintains ownership of them all along, so the model looks more like this: make, use and return.
Let’s go back to the light bulb example. Instead of buying bulbs, this office in London leases its light from Philips Lighting. It signed a 15-year lease for the service and pays a fee each quarter. Philips still owns the actual lightbulbs and provides maintenance and replacements when needed, no extra cost. This model gives Philips the incentive to produce energy-efficient light bulbs and it saves the office money with fixed lighting costs. It’s a radically different business model that makes companies more like service providers than sellers of a physical product.
And it turns out lots of companies are looking for ways to get involved. Take H&M, one of the world’s largest clothing retailers. It’s working on a strategy to become 100 percent circular. The company collects old garments in its stores and recycles them. Since 2013, H&M says it has gathered more than 55,000 tons of fabric to reuse for new garments. Some governments are getting on board with the circular economy, too. The European Union adopted an action plan in 2015 aiming to make supply chains, you guessed it, more circular. This includes everything from production to consumption, repair and manufacturing, and waste management.
The point isn’t just to become more 'green' and create environmental benefits, there could be economic benefits too. One report estimated a shift toward the circular economy in the E.U. could increase GDP by an additional 12 percentage points by 2050. But moving from the linear economy to the circular economy also brings costs. Companies would need to redesign their supply chains and products in order for them to be used again and again. Manufacturers might be burdened when it comes to the actual logistics of disposing and recycling. A recent report found only 22 percent of U.K. companies are trying to generate value from products that are returned for reuse, recycling or refurbishing. It’s estimated the cost of transitioning to a fully efficient reuse and recycling system across Europe could be as much as 108 billion euros, roughly 130 billion dollars. Cost is one thing. Changing people’s mindsets is another. And that’s what it'll take for the circular economy to go from an idea to reality for everyone.
Hey guys, it's Elizabeth, thanks so much for watching! You can check out more of our videos over here. We're also taking your suggestions for future CNBC Explains, so leave any ideas in the comments section. And while you're at it, subscribe to our channel. See you later!
There are a few ideas underlying the circular economy concept, as described in the videos:
- The current model is take, make, dispose of. (This should sound familiar!) As they indicate, nature does not operate this way - there is no "waste" in nature - and in order for society to be sustainable, we should follow the natural model.
- As CNBC notes in the video: "For a light bulb company to make money in the linear economy, it tries to buy materials for the lowest cost possible and to sell as many bulbs as possible. This model operates as if there are infinite resources, like glass or metal, in the world." They recognize that we cannot continue to use natural resources at an unsustainable rate. (Again, this should sound familiar.)
- People do not actually need to own things, they need/want the service provided by those things. Is the point of purchasing a light bulb to own the light bulb? For most people, no. They just need light. Do you really need a washing machine? Again, the answer is "no." You just need clean clothes. There are innumerable examples of this - cars, microwaves, cell phones, refrigerators, furnaces, even clothes.
- If ownership is retained by companies, then it is in their best interest to make the products last as long as possible by making long-lasting products that can be repaired. It is also often beneficial to them to be able to reuse components from products that are no longer in use.
- The first video (from the Ellen MacArthur Foundation), sums up the concept very nicely: "Now let's put these two cycles together. Imagine if we could design products to come back to their makers, their technical materials being reused and their biological parts increasing agricultural value? And imagine that these products are made and transported using renewable energy? Here we have a model that builds prosperity long-term."
The MacArthur Foundation notes that the circular economy is "about a rethinking of the operating system itself." This is a very important point! The take-make-dispose process is systemic, and is deeply ingrained in society. If we are to get past this mindset, systemic change is required.
Of course, we are socialized to believe that ownership is important (Americans in particular love buying stuff), so the establishment of a circular economy will require social change. This may seem a difficult hill to climb. Well, it is, actually, but allow me to provide one example of why it may be more feasible than you think. Consider the ubiquity of Uber and Lyft. It may be difficult to imagine, but try to think back 10 years ago, before ridesharing existed. Treating automobile transportation as a service was mainly reserved for taking cab rides in cities. Now you can take an Uber in over 60 countries [332] across the world, and the service is available even in rural areas of the U.S. The point here is not that Uber and Lyft are examples of the circular economy (though they do minimize the necessity of automobile production), but that personal transportation is increasingly being viewed as a service. It is a rather commonly held belief [333] that autonomous vehicles will reduce vehicle ownership. Rideshare and car companies are already testing driverless vehicles, and in the not-too-distant future, they will increasingly own their own vehicle fleet instead of paying others to drive, or in the case of car companies, expecting consumers to buy their cars. If/when that happens, it will be to their benefit to extend the use of their fleet as long as possible.
Cradle to Cradle Design
Please watch the video below for some insight into an application of the circular economy called Cradle to Cradle Design.
As you can see, cradle to cradle (C2C) concept is an application of the circular economy. The concept is summed up rather well in the video when they state that C2C is all about "keeping all materials in continuous cycles, stimulating the use of renewable energy only, and celebrating diversity," though there is more to it, as you will see below. The following are some of the key points from the video above:
- They characterize the concept of reduce, reuse, recycle as "less bad" and the goal of C2C as "100% good." They acknowledge that the 3 Rs are better than the linear resource use model, but that they will not solve our long term resource and waste problems because there is still some waste, and because the global population is still growing. If C2C were fully implemented, the entire system of design and manufacturing of goods would be reconfigured. In other words, it requires systemic change.
- I remember watching a TED Talk by one of the creators of the C2C concept, William McDonough, and he characterized the 3 Rs as "an efficient pursuit of the wrong goals." In other words, doing things like recycling plastic bottles is better than just throwing them away, but a properly designed container would be designed with the intent of fully reintegrating all of the materials back into the original process. As they state in the video: “The design is thought through on how to disassemble it and how the used materials are valuable to nature or as resources for the production of new products.”
- They note that one of the primary tenets of C2C is "waste = food." They think that the concept of "waste" should not exist. They describe two cycles that should be utilized when products are no longer used: Organic materials should be returned to the biological cycle (compostable packing, etc.) and non-organic materials (metals, etc.) should be reintegrated into the technical cycle. They often refer to these non-organic components as technical nutrients. Just as biological nutrients are used by natural processes, technical nutrients should be reused in technical processes.
The Cradle to Cradle Products Innovation Institute [334] has taken this concept beyond the conceptual phase and created a process to certify products using their Cradle to Cradle CertifiedTM product standard [335]. The standard is described as follows:
The Cradle to Cradle Certified [336]™ Product Standard [336] guides designers and manufacturers through a continual improvement process that looks at a product through five quality categories — material health, material reutilization, renewable energy and carbon management, water stewardship, and social fairness. A product receives an achievement level in each category — Basic, Bronze, Silver, Gold, or Platinum — with the lowest achievement level representing the product’s overall mark.
Product assessments are performed by a qualified independent organization trained by the Institute [337]. Assessment Summary Reports are reviewed by the Institute, which certifies products meeting the Standard requirements, and licenses the use of the Cradle to Cradle Certified™ word and design marks to the product manufacturer. Every two years, manufacturers must demonstrate good faith efforts to improve their products in order to have their products recertified.
The five quality categories [338] are as follows:
Material Health: Knowing the chemical ingredients of every material in a product, and optimizing towards safer materials.
Material Reutilization: Designing products made with materials that come from and can safely return to nature or industry.
Renewable Energy & Carbon Management: Envisioning a future in which all manufacturing is powered by 100% clean renewable energy.
Water Stewardship: Manage clean water as a precious resource and an essential human right.
Social Fairness: Design operations to honor all people and natural systems affected by the creation, use, disposal or reuse of a product.
If a product would like to go for C2C certification, it is evaluated based on these five categories. It receives a score in each category - basic, bronze, silver, gold, or platinum. These are also the five levels of cradle to cradle certification. The certification level is based on the lowest score that the product receives in these categories. For example, if a product earns a "gold" score in material health, material reutilization, renewable energy & carbon management, and water stewardship, but only earns a "basic" score in social fairness, then the product is certified as "basic." Another important aspect to point out is that all products must be recertified every two years, and in that time, must demonstrate good faith efforts to improve the products.
More Site Visits!
Here are some more site visits! Again, this is not required reading. I suggest browsing through them if/when you have time. This may help inspire your final project proposals!
- Ecocycle [339], Boulder
- Great Divide Brewery [340], Denver
- Desert Weyr [341], Paonia
- The Growhaus [342], Denver
Summary and Final Tasks
Summary
By now, you should be able to do all of the following:
- define natural resources;
- describe why the term "natural resources" is anthropocentric;
- analyze the difference between linear and circular resource flows;
- describe the differences between reduction, reuse, and recycling; and
- identify components of the circular economy and cradle to cradle certification.
Reminder - Complete all of the Lesson 8 tasks!
You have reached the end of Lesson 8! Double-check the to-do list on the Lesson 8 Overview page [343] to make sure you have completed all of the activities listed there before you begin Lesson 9.
Lesson 9: Food and Farming
Overview
The focus of this lesson is to consider the negative sustainability impacts of food production, and investigate solutions to these problems.
Learning Outcomes
By the end of this lesson, you should be able to:
- analyze the water footprint of various foods;
- describe how improper fertilizer management causes dead zones;
- define eutrophication;
- describe the sustainability implications of food deserts and food insecurity;
- demonstrate an understanding of permaculture philosophy and principles;
- describe regenerative agriculture and appropriate technology;
- analyze the sustainability impacts of community gardens; and
- explain the benefits of fair trade certification.
Lesson Roadmap
| To Read | Lesson 9 Online Content | You're here! |
|---|---|---|
| To Do |
|
|
Questions?
If you have any general course questions, please post them to our HAVE A QUESTION discussion forum located under the Discussions tab in Canvas. I will check that discussion forum regularly to respond as appropriate. While you are there, feel free to post your own responses and comments if you are able to help out a classmate. If you have a question but would like to remain anonymous to the other students, email me through Canvas.
If you have something related to the material that you'd like to share, feel free to post to the Coffee Shop forum, also under the Discussions tab in Canvas.
Food and Sustainability
Other than energy, it is through food that most of us most frequently directly interact with sustainability. Humans cannot survive without food, and most (and probably all) of you reading this eat multiple meals each day. The food industry has immense sustainability implications, including soil health and conservation, water use, forest clear-cutting, environmental and social justice, economics and equity, and much more. The following provides some insight into a few of these issues.
Water Use
You probably recall from a previous lesson that irrigation is the single biggest user of freshwater in the United States. You may also recall the large water footprint of some common foods. The following are footprints of common main dishes, according to the Water Footprint Network [344] (see Water Footprint report [345]). (Note that these are global averages. Also, 1 litre/kg equals about 0.12 gal/lb.):
- beef: 15,400 litre/kg (1,848 gal/lb)
- sheep: 10,400 litre/kg (1,248 gal/lb)
- pig: 6,000 litre/kg (720 gal/lb)
- chicken: 4,325 litre/kg (519 gal/lb)
- tofu: 2,517 litre/lb (302 gal/lb)
- rice: 2,497 litre/kg (300 gal/lb)
- pasta: 1,849 litre/kg (222 gal/lb)
If you are interested, the Huffington Post does a nice job of comparing the water footprint of common foods [346]. (They use Water Footprint Network data.)
Almost all of the water used in producing meat is the result of irrigating the crops that are used to feed the animals, and some irrigation methods are more efficient than others. (Oregon State University Cooperative Extension provides a good analysis of various irrigation techniques [347] if you are interested in learning more.)
Dead Zones
One sustainability impact that happens on more of a macro scale is something called a "dead zone." The National Oceanic and Atmospheric Administration (NOAA) explains dead zones [348] thus:
Less oxygen dissolved in the water is often referred to as a “dead zone” because most marine life either dies, or, if they are mobile such as fish, leave the area. Habitats that would normally be teeming with life become, essentially, biological deserts.
Hypoxic zones can occur naturally, but scientists are concerned about the areas created or enhanced by human activity. There are many physical, chemical, and biological factors that combine to create dead zones, but nutrient pollution is the primary cause of those zones created by humans. Excess nutrients that run off land or are piped as wastewater into rivers and coasts can stimulate an overgrowth of algae, which then sinks and decomposes in the water. The decomposition process consumes oxygen and depletes the supply available to healthy marine life.
Dead zones occur in many areas of the country, particularly along the East Coast, the Gulf of Mexico, and the Great Lakes, but there is no part of the country or the world that is immune. The second largest dead zone in the world is located in the U.S., in the northern Gulf of Mexico.
Dead zones happen all over the world and are in fact a natural occurrence. However, humans have significantly increased the incidence of dead zones, including the one in the Gulf of Mexico, which grows to about the size of New Jersey every summer, as you will see in the video below. These dead zones are caused by eutrophication, which is when a body of water has an excessive amount of nutrients (primarily nitrogen and phosphorous) that lead to unusually high plant/algae growth. (Note that eutrophication just refers to excess nutrients, but this often results in a dead zone.) When eutrophic streams and rivers empty into ponds, lakes, or other open bodies of water (such as the Gulf of Mexico), it causes excessive algae growth and ultimately leads to anoxic ("oxygen-less") conditions near the bottom of these bodies of water. NOAA does a good job of explaining eutrophication in the video below.
What is eutrophication? It’s a problem that should matter to you, whether you live near the ocean or not. That’s because it begins wherever people live and ends with damage to resources we all use and enjoy. It all starts when nutrients get into lakes and oceans. Remember, what’s waste to humans can be food to plants and other creatures. Nutrients feed algae like they do other plants. Algae grows and blocks sunlight. Plants die without sunlight. Eventually, the algae die too. Bacteria digest the dead plants, using up remaining oxygen, and giving off carbon dioxide. If they can’t swim away, fish and other wildlife become unhealthy or die without oxygen. But it doesn’t have to be this way. Protecting marine resources starts with sound agricultural and waste management practices.
Eutrophication has a few anthropogenic causes, but the primary one is the use of artificial fertilizers on farms. Fertilizers feed plants, but if they get into bodies of water they feed algae. The video below from NOAA provides a good explanation of this. Please note that the explanation at the end of the video of what causes the dead zone is incomplete: waste from organisms that eat the phytoplankton plays a role in the dead zone, but (as described in the video above) the main cause of dead zones is when bacteria eat the dead phytoplankton after they sink to the bottom.
Did you know that half of the oxygen that we breathe comes from tiny organisms that live in the ocean? It's true! These microscopic marine organisms, called phytoplankton, produce oxygen just like land plants. But phytoplankton are not plants, they are Protists, single celled organisms. They are so small that thousands of them can fit in a single drop of water. In order to study phytoplankton, scientists often use microscopes... or satellites.
From space we see Earth like this. But some satellites see Earth like this… a dance of rainbow colors. In this case, the colors represent the concentration of phytoplankton in the ocean: red is high concentration; blue is low concentration.
Phytoplankton depend on nutrients and proper temperature and light conditions to grow and reproduce. Coastal areas are extremely rich in nutrients, which have been washed off the land by rivers. Areas such as the open ocean have lower concentrations of phytoplankton because of the limited amount of nutrients there.
The mouth of the Mississippi River is a perfect example of how nutrient run-off creates plankton blooms. 41% of the United States drains into the Mississippi River and then out to the Gulf of Mexico. That's a total of 3.2 million square kilometers of land or about 600 million football fields. About 12 million people live in urban areas that border the Mississippi, and this area constantly discharges treated sewage into rivers. However, the majority of the land in the Mississippi Watershed is farmland. Each spring as farmers fertilize their lands preparing for crop season, rain washes fertilizer off the land and into streams and rivers. All of the urban and farm discharges include nutrients such as nitrogen and phosphorus that are very important for the growth of phytoplankton. Incredibly, about 1.7 million tons of these nutrients are dumped into the Gulf of Mexico every year.
Once the Gulf of Mexico receives this huge influx of nutrients, massive phytoplankton blooms occur. These blooms result in an area called the dead zone with such low oxygen concentrations that few organisms can survive there.
But if phytoplankton blooms produce oxygen, then why does a Dead Zone occur? For animals, such as microscopic zooplankton and fish, phytoplankton blooms are like an all-you-can-eat buffet. Small animals eat the phytoplankton, and are, in turn, eaten by bigger fish. All along, these animals are releasing waste, which falls to the bottom of the gulf. There lurk bacteria that decompose the waste, and in the process use up the oxygen, creating hypoxic conditions. The different densities of freshwater from the Mississippi and saltwater from the Gulf create barriers that prevent mixing between the surface and deep waters. Soon there is not enough oxygen for other organisms to use. The Dead Zone has arrived. But as summer turns to fall, winds helps stir up the water, allowing the layers to mix and replenish oxygen throughout the water. Eventually, the Gulf and its fish populations return to normal. Until next year...
Food Deserts
Over the past 10 - 15 years, food deserts have (slowly) become a more prominent issue. The following is a summary from the U.S. Centers for Disease Control [349] (emphasis added):
Food Desert
Food deserts are areas that lack access to affordable fruits, vegetables, whole grains, low-fat milk, and other foods that make up a full and healthy diet (1). Many Americans living in rural, minority, or low-income areas are subjected to food deserts and may be unable to access affordable, healthy foods, leaving their diets lacking essential nutrients.What's the Problem?
Rural, minority, and low income areas are often the sites of food deserts because they lack large, retail food markets and have a higher number of convenience stores, where healthy foods are less available (2). Studies have shown that food deserts can negatively affect health outcomes but more research must be done to show how that influence occurs. There appears to be a link between access to affordable nutritious foods and the eating of these foods, meaning less access may lead to less incorporation of healthy foods into the populations’ diets.Who's at Risk?
Because there is no standard definition of a food desert, estimates of how much of the population is affected vary by quite a bit. However, it’s safe to say that many Americans have limited access to affordable nutritious foods because they do not live near a supermarket or large grocery store. Transportation is specifically part of the USDA food desert definition. Only common theme among food desert definitions is that there is limited access.Can It Be Prevented?
Food deserts can be improved through several different types of efforts. Establishing a community garden where participants share in the maintenance and products of the garden and organizing local farmers markets are two efforts that community members themselves can do (3, 4). Local governments can improve local transportation like buses and metros to allow for easier access to established markets (5). They can also change zoning codes and offer economic or tax incentives to attract retailers with healthier food offerings to the area (6).The Bottom Line
Food deserts are a big problem for many Americans that may limit their ability to eat healthy and nutritious foods on a regular basis. However, there are a variety of ways that local governments and community members can both improve food access in their neighborhoods.Case Example
Maria is a 60-year-old woman living in a low-income area of St. Louis. As she’s gotten older, she hasn’t been able to get around as well and doesn’t have a car. She usually eats a lot of unhealthy and microwavable foods because the closest store to her apartment is the local convenience store around the corner. She wishes that she could eat better and begins talking to some of her neighbors and other families in the building to get their input. Maria and her next-door neighbor Sylvia organize all the residents in their building to establish a community garden on the roof of the building so that they will all have fresh fruits and vegetables to share.
As indicated above, there is no one definition of a food desert, but it is meant to indicate a lack of access to fresh foods. The U.S. Department of Agriculture (USDA) considers three ways to define a food desert [350]. (The number of people in the U.S. in each category as of 2017 are in parentheses.):
- "Low-income census tracts where a significant number (at least 500 people) or share (at least 33 percent) of the population is greater than ½ mile from the nearest supermarket, supercenter, or large grocery store for an urban area or greater than 10 miles for a rural area." (54.4 million, 17.7% of the population)
- "Low-income census tracts where a significant number (at least 500 people) or share (at least 33 percent) of the population is greater than 1.0 mile from the nearest supermarket, supercenter, or large grocery store for an urban area or greater than 10 miles for a rural area." (19 million, 6.2% of the population)
- "Low-income census tracts where a significant number (at least 500 people) or share (at least 33 percent) of the population is greater than 1.0 mile from the nearest supermarket, supercenter, or large grocery store for an urban area or greater than 20 miles for a rural area." (17.3 million, 5.6% of the population)
The USDA has created a Food Access Research Atlas (available here) [351], where you can explore food deserts across the U.S. Feel free to tool around with it. (You will have to explore it for this week's quiz.)
Food Insecurity
A topic closely related to food deserts is food insecurity. The USDA defines food insecurity [352] and very low food security as follows:
- Food insecurity: "Food-insecure households (those with low and very low food security) had difficulty at some time during the year providing enough food for all their members due to a lack of resources."
- Very low food security: "In this more severe range of food insecurity, the food intake of some household members was reduced and normal eating patterns were disrupted at times during the year due to limited resources."
The USDA provides an annual report and analysis on food insecurity in the U.S. through its Economic Research Service. Highlights (okay, lowlights) from the "Household Food Security in the United States 2017 [353]" report summary (full Household Food Security [354]report available here [354]) include:
- "An estimated 11.8 percent of U.S. households were food insecure in 2017, down from 2016 and continuing a decline from a high of 14.9 percent in 2011, while still above the pre-recession (2007) level of 11.1 percent"
- 11.8% of U.S. households were food insecure, which equates to 15.0 million households!
- 4.5% had very low food security, which equates to 5.8 million households.
- 2.9 million households with children (7.7% of all households) were food insecure.
- 250,000 households with children (0.7% of all households) had very low food security.
- "Rates of food insecurity were higher than the national average for the following groups: households with incomes near or below the Federal poverty line, all households with children and particularly households with children headed by single women or single men, women and men living alone, Black and Hispanic-headed households, and households in principal cities and nonmetropolitan areas."
Permaculture
What is Permaculture?
Permaculture is another one of those concepts that have no single definition, but I like the succinct definition offered by Geoff Lawton [355], one of the more well-known permaculture teachers and practitioners in the world when he stated that permaculture is "a system of design that provides all of the needs for humanity in a way that benefits the environment." Another way to describe it is "designing human systems to mimic natural systems" and "designing systems that work with nature instead of against it." No matter how you define it, it refers to a design system - it integrates concepts from a wide array of disciplines/topics (hydrology, soil science, biology, ecology, renewable energy, forestry, and more) - and utilizes them when designing systems, such as gardens, farms, houses, neighborhoods, and more. It is most commonly used to design food systems, though. Everything from a backyard garden to a large farm can be designed using these principles.
The concept and term "permaculture" was coined by Bill Mollison and David Holmgren in Australia in the 1970s. It was originally a concatenation of the terms "permanent agriculture" because it initially focused on food production systems, but came to be known as a shortened form of "permanent culture" because it can be used to address all aspects of human culture/settlements.
To Read Now
The Permaculture Research Institute provides an excellent one-page description of permaculture. Please read through it before continuing.
- "What is permaculture? [356]"
The following are some highlights from the reading:
- "Permaculture integrates land, resources, people and the environment through mutually beneficial synergies – imitating the no waste, closed loop systems seen in diverse natural systems." This should sound familiar! A well-designed permaculture system will have little/no waste, and may actually make the local natural environment better than it was before. As they indicate later on the page: "It is the harmonious integration of landscape and people — providing their food, energy, shelter, and other material and non-material needs in a sustainable way."
- Permaculture "is a multidisciplinary toolbox." It integrates many disciplines, as indicated above.
- "The philosophy behind permaculture is one of working with, rather than against, nature; of protracted and thoughtful observation...and allowing systems to demonstrate their own evolutions." Observation of how existing natural systems work is a key component of permaculture.
- "Recycling of nutrients and energy in nature is a function of many species. In our gardens, it is our own responsibility to return wastes (via compost or mulch) to the soil and plants, "but we rely on nature to replenish natural resources such as clean water and air, so "even anthropocentric people would be well-advised to pay close attention to, and to assist in, conservation of existing forests and to assist in the conservation of all existing species and allow them a place to live."
I want you to consider one additional concept that is mentioned in this summary. They mention that permaculture helps establish resilience. Resilience can be thought of as the ability to return to an original state after encountering a shock to the system. This has become a major focus of sustainability efforts. People recognize that "bad" things such as climate change, oil price spikes, and economic collapse will happen, but we do not know when. Much effort in sustainability design, thought, and policy is focused on establishing resilient communities (and cities, states, and countries) that will be able to withstand such shocks in such a way that suffering and distress will be minimized.
From a climate change perspective, this is primarily a focus on adaptation, i.e., adapting our communities to thrive in an uncertain climate future. This usually involves things such as using renewable energy (and not relying entirely on the national grid, e.g.), producing food locally (instead of relying on world markets), mitigating and/or avoiding flooding in low-lying areas, using more low-carbon transportation methods (e.g., bike and pedestrian infrastructure) and in general becoming more self-sufficient. This is a major focus of the Transition Town movement [357], but cities, towns, and states/provinces all over the world have engaged in planning for resiliency. For example, the state of Colorado has its own Resiliency Resource Center [358], which is operated out of the Department of Local Affairs.
The video below summarizes a lot of these concepts and adds a few others. It also provides a few examples of permaculture.
[ON SCREEN TEXT:] "If your food comes from the grocery store and your water from a tap you will defend to the death the system that brings these to you because your life depends on it...[but] If your food comes from a land base and if your water comes from a river you will defend to the death these systems." - Derrick Jensen
If you happen to pick up a newspaper these days, you'll probably find a growing sense of despair regarding climate change and environmental degradation, but there's been an astounding effort from countless communities to cull the rising tide of environmentally irresponsible actions. And among the surge of modern nature related groups and philosophies lies the promising ideas of permaculture which, when unpacked, provides us with a solid toolkit for not only tackling the difficult environmental challenges ahead, but also for thriving in a transformed world.
Permaculture, a term coined by Australians Bill Mollison and David Holmgren in their 1978 book Permaculture One, was originally a contraction of permanent and agriculture, but has since blossomed into a more inclusive combination of permanent and culture. As Mollison readily admits, permaculture is nebulous. "It's a little difficult to define what the permaculture community is." But those two words permanent and culture hit at the philosophy behind permaculture in the sense that it gives people a set of tools to rethink and redesign their communities so that they can live seamlessly with the natural world. And by working with, rather than against, nature in order to grow food, for example, permaculture bolsters not only the health of the land but also its practitioners. In doing so, the concepts and practices of permaculture build communities that are adaptable to a changing climate.
Jono Neiger sums up these ideas in his book Permaculture Promise wherein he writes,“Permaculture is about rebuilding much needed relationships with the people, land and systems that support us.” Through these relationships and a positive approach to change, agriculture seeks to build resilient cultures and communities. At the core of permaculture teaching lies three ethics: earth care, people care, and fair share. While earth care and people care at their simplest forms are the concerted efforts to nurture natural environments and surrounding communities in your everyday actions, fair share is a bit less self-explanatory. The concept of fair share is essentially the synthesis of earth and people care. It acknowledges that there is one earth that we all need to live on. So surplus, whether that's food, money, or time should be shared with those who are otherwise languishing or be returned back to the earth. These three ethics ultimately intertwine to create an effective moral base on which permaculture practitioners can build and transform their local systems. They're essentially guideposts for tangible change.
In practice, permaculture can take a variety of shapes. For instance Jordan Osmond over at Happen films toured Purple Pear farm, an excellent example of permaculture at work wherein each natural system feeds off each other, thus creating both abundant food for the farmer and a healthier ecosystem. But permaculture can also mean projects like City Repair in Portland which applies permaculture principles to artistic and ecologically minded projects that help reinvigorate local community relationships and the natural world.
Now more than ever, permaculture is important because it brings to the table tangible and ethically based solutions for systemic change. It moves beyond sustainability and into resilience. Looking towards not only surviving, but thriving in a quickly changing natural world. Starting at a local and personal level, the concepts of permaculture work to wean people off an industrialized and consumption centric worldview and replace that materialistic perspective with a new outlook that emphasizes ethical interactions with nature and a community-oriented lifestyle.
Ultimately, this new worldview brings us closer to appreciating the source of our sustenance and our desire for interpersonal connection. And if we can rekindle this understanding that we need thriving natural systems to live, as Derrick Jensen said so perfectly at the beginning of this video, we will then defend those natural systems to the death.
This video is made possible in part by the wonderful people who support me on Patreon. If you're interested in helping me grow this channel, head on over to Patreon and pledge a small amount of money for every video I release. In return, I'll send you gifts like a handwritten thank you note or an Our Changing Climate sticker. As always if you like what you just saw share it around and subscribe. Thanks so much for watching and I'll see you next Friday.
Most of this reiterates much of what is written above, but there are a few more things I'd like to point out:
- First, I think the quote from Derrick Jensen provides important perspective: "If your food comes from the grocery store and your water from a tap you will defend to the death the system that brings these to you because your life depends on it...[but] If your food comes from a land base and if your water comes from a river you will defend to the death these systems." This speaks to one of the problems with our modern food (and consumer) system. Namely, that we are disconnected from the sources of our food (and other products). One negative impact of this is that it allows all of the hidden impacts that have been detailed throughout this course and EM SC 240N, such as water footprint, carbon footprint, ecological footprint, and social/environmental injustice to occur. If we were able to see the true negative impacts of these systems, it is more likely that we would address these problems. Permaculture is one way of many to reconnect us to the sources of our food and other products.
- He mentions that building "resilient cultures and communities" is at the core of permaculture. Again, resilience is a very important topic in sustainability.
- There are three ethics of permaculture, which you will see quoted a lot in permaculture literature. These are meant to underlie all permaculture systems:
- Earth care, which refers to attempting to eliminate negative impacts on the natural environment, or if possible, to actually helping regenerate natural systems.
- People care, which refers to doing everything we can to help as many people as possible.
- Fair share, which refers to always keeping in mind to "share the surplus," whether it be food, money, time, expertise, etc.
- He shows an example of a permaculture farm "where each natural system feeds off each other, thus creating both abundant food for the farmer and a healthier ecosystem." There are examples of this all over the world, but almost all of them share in common the idea that the whole farm/garden should work together as a system and actually improve the local ecosystem, for example by attracting beneficial insects, providing habitat for birds and other animals, and rebuilding soil.
- He also describes an example of more urban-focused permaculture "which applies permaculture principles to artistic and ecologically-minded projects that help reinvigorate local community relationships and the natural world." Permaculture principles will be described in more detail below.
- He notes that permaculture "brings to the table tangible and ethically based solutions for systemic change" and that it seeks to design systems that allow people not only to "survive" but to "thrive." Permaculture focuses on understanding the nature of many sustainability problems, but more importantly on ways to apply practical solutions to these problems. Permaculturalists are "doers" - it is a very solutions-focused, action-oriented concept. Permaculturalists like to discuss things, but they are usually more focused on doing things!
- He also mentions that permaculture seeks to "replace that materialistic perspective with a new outlook that emphasizes ethical interactions with nature and a community-oriented lifestyle." Permaculture is a holistic philosophy that seeks systemic change. Like some of the other content you have seen (e.g., circular economy), they recognize that our systems are not designed properly. Permaculture is also very community-oriented, and in fact, interacting with diverse people and ideas is one of the core principles of permaculture.
Permaculture Design Principles
Hopefully, by now you have a solid understanding of what permaculture is, as well as its core ethics. Permaculture also has a set of 12 principles that should be used to guide all design decisions. The video below from Oregon State University provides a good overview of these principles, and examples of how they can be applied. You will not be expected to memorize them, but it will be helpful to have a general understanding of each.
We’re arrived at the final element of the Permaculture Decision Making Matrix, the Permaculture design principles. Here are my two favorite books, which are the source of the principles. Bill Mollison included a comprehensive list of principles in the Permaculture Designer’s Manual, and later on David Holmgren consolidated and repackaged the principles into 12 in his book, “Permaculture Principles and Pathways beyond sustainability.” So for simplicity’s sake, I’ll present to you Holmgren’s 12 principles.
Principle 1 is “Observe and Interact,” and this is essentially what we’ve been talking about for this entire course thus far. Where am I? What are the forces present on my site that I need to design for? Climate, topography, water, soils, vegetation, wildlife, wind, fire, people, these are some of the elements that are part of our observations.
Principle 2 is “Catch and Store Energy.” Energy is not just electricity, but stored water represents potential energy in the form of irrigation water for future crops. The biomass of a forest represents a living storage of building materials, fuel, nutrients and water. Alternative energy systems can turn wind, sun, and flowing water into electrical energy. So this principle gives us the directive to capture and grow surpluses in our system.
Principle 3 is “Obtain a Yield.” This principle promotes self-reliance and gives us the directive to reap a harvest from our Permaculture system, because you can’t work on an empty stomach. This principle is relevant when making a choice about which tree to plant in a location. Always choose the one with greater and more diverse yields over an ornamental plant. Yields are not just food. Yields can be building materials, fuel wood, nectar for honey. But plenty of food growing all around you is true security.
Principle 4 is “Apply Self-Regulation and Accept Feedback.” This principle directs us to live simply and consciously, limit our own consumption, because no one else is going to do that for us. We need to keep our own consumption and emissions in check because that is our responsibility when we care for Earth and care for people. Accepting feedback means that learning from our successes and mistakes is an imperative, and should lead to better choices as we learn what works and what doesn’t.
Principle 5 is “Use and Value Renewable Resources.” Renewable resources are those which replenish with modest use. This could be sustainable forestry or fishing practices. This could mean planting an orchard downslope from a forest to take advantage of the nutrient and water drift that continually moves down the hill. This is the wind. This is the fact that plants and animals breed, and if we are responsible and careful, many of these resources can provide in perpetuity.
Principle 6 is “Produce No Waste.” This is where we make the waste of one part of our system the food for another. This means we compost, clean and recycle greywater, repair and repurpose broken tools and equipment. Reduce, reuse, repair, recycle. This also means we don’t waste people by having them do hazardous and meaningless work.
Principle 7 is “Design From Patterns to Details.” This is one of my personal favorites. It means that first we study the climate, topography, watershed, ecology, and we get a big picture vision of how we can interact with the land and community in a regenerative way, and then our design decisions are based on that. So this road I just drew in is placed in a way where it harvests the water for this pond. The detail of road placement was based on the overall pattern of water flow in the landscape.
Principle 8 is “Integrate Rather Than Segregate.” This principle says that the more relationships between parts of your systems, the stronger, more productive and more resilient your system becomes. This has to do with community as well. I drew a cluster of dwellings where a cooperative community can get much more done than an individual. Many hands make light work.
Principle 9 is “Use Small and Slow Solutions.” I’ve gone ahead and harvested some of the trees on the forest edge to use for fence posts and replaced them with nut trees that will start bearing in about 10-12 years, and will then live for hundreds of years. I’ve planted new trees over here, which will be new fence posts when these ones rot. I’ve also inoculated edible mushrooms into the stumps of the trees I cut, which will produce for years and then spread to others with the fallen wood. These are all examples of playing the long game, using the small and slow design principle.
Principle 10 is “Use and Value Diversity.” You can see we’ve got housing, gardens, wind power, water storage, composting, greywater, forestry, orchards, and now I’ve added in rotational grazing of animals, both here and in the orchard. I’ve also added more trees and gardens around the homestead, and fish to the pond. Diversity is one of the key aspects of Permaculture. We want to conserve diverse native habitats, and make our human habitats rich with an abundance of many productive elements. Diversity is also resilience: if one part of our system fails, there are others that will thrive.
Principle 11 is “Use Edges and Value the Marginal.” I’ve added edible hedgerows around the animal paddocks, and along the road. I’ve also added bamboo down below the pond, which will be sub-irrigated by water that seeps down. The edges and margins are great locations to add more productive species or habitat zones. And I can use them to create further layers of productivity.
Principle 12 is “Creatively Use and Respond to Change.” I noticed that with the orchards and hedgerows growing in, the forest soils growing spongier from mushroom inoculation, and the soils building from the animal rotation, water has begun to move much more slowly down the hillside. So much so, that this area at the bottom of the hill is becoming somewhat of a marsh. Well, that wasn’t what I planned, but I’m going to creatively use that change, and I’m going to carve out some low areas that’ll stay really wet, which I can use to grow edible wetland plants, and then simultaneously build up these peninsulas, full of edge to grow productive trees which will get their roots down in this water table. Wow, I didn’t even see that yield coming, but there you have it. The Permaculture principles in action!
Permacultureprinciples.com provides an excellent in-depth explanation [359] of each of these principles and also provides a ton of examples of each principle. If you want to explore any of the principles more (this is optional but strongly suggested if/when you have some time), including examples of concrete applications, click on the links to each item below. They even have a song for each principle, which is a nice touch! All quotes are taken from the permacultureprinciples.com site.
- Observe and interact [360]: "By taking the time to engage with nature we can design solutions that suit our particular situation." The most essential step before designing any system is to first observe. You should always seek to utilize immediate resources, e.g., when planning a garden, observe where the sunlight is at certain times, where the wet areas are, where the wind blows through, etc.
- Catch and store energy [361]: "By developing systems that collect resources when they are abundant, we can use them in times of need." Capturing rainwater and utilizing naturally produced fertilizer and mulch are some examples of this.
- Obtain a yield [362]: "Ensure that you are getting truly useful rewards as part of the work that you are doing." Permaculture systems should be productive, e.g., a garden that produces an abundance of food.
- Apply self-regulation and accept feedback [363]: "We need to discourage inappropriate activity to ensure that systems can continue to function well." This goes with observation, but after you have deployed a system, you should ALWAYS look for feedback from the local environment, and adjust accordingly to optimize the system, e.g., if you design a park in a city, but find that people are not using it because it is difficult to get to, think about finding ways to get people there (e.g., a bike path or bus route) or repurpose it (e.g., an urban farm). An important corollary of this is turning problems into solutions, e.g., if you are designing a garden and there is a wet area, grow plants that like a lot of water or divert the water to a drier area.
- Use and value renewable resources and services [364]: "Make the best use of nature’s abundance to reduce our consumptive behaviour and dependence on non-renewable resources." Use renewable resources at a sustainable rate!
- Produce no waste [365]: "By valuing and making use of all the resources that are available to us, nothing goes to waste." Remember, we should design systems like nature does. There is no waste in nature! Waste should be used as a resource, e.g., in a food system you should reintegrate unused organic material into the soil through composting. This goes along with turning problems into solutions.
- Design from patterns to details [366]: "By stepping back, we can observe patterns in nature and society. These can form the backbone of our designs, with the details filled in as we go." Permaculturalists use a lot of natural designs as the basis for intentional design, e.g., by using natural materials and shapes when designing buildings.
- Integrate rather than segregate [367]: "By putting the right things in the right place, relationships develop between them and they support each other." Permaculture focuses on relationships and connections, always looking at the system as a whole. An important corollary of this is to have single things serve multiple functions, e.g., permaculture gardens often use chickens because they provide food, they aerate the soil by scratching it, they eat pests that can destroy crops, and they provide natural fertilizer through manure. Bicycling is another example - it provides exercise, reduces emissions, and allows for more personal connections with the local community.
- Use small and slow solutions [368]: "Small and slow systems are easier to maintain than big ones, making better use of local resources and producing more sustainable outcomes." Think in terms of years and decades when making designs, not weeks or months.
- Use and value diversity [369]: "Diversity reduces vulnerability to a variety of threats and takes advantage of the unique nature of the environment in which it resides." Diverse systems are more resilient, e.g., if you have a biodiverse field or farm and one crop/plant is destroyed by a pest, there are other species remaining to provide resources.
- Use edges and value the marginal [370]: "The interface between things is where the most interesting events take place. These are often the most valuable, diverse and productive elements in the system." This goes hand-in-hand with the previous principle. Diverse systems are more innovative, e.g., a group of people with a diverse set of skills is more creative, and can more easily adapt to a variety of problems.
- Creatively use and respond to change [371]: "We can have a positive impact on inevitable change by carefully observing, and then intervening at the right time." Again, you should constantly observe and adjust.
One other thing that I'd like to note before moving on is that while remembering and applying these principles takes a lot of effort, a properly designed permaculture system significantly minimizes effort once it is established! For example, a well-designed permaculture garden will require almost no active watering (it should be rain-fed), does not require the constant addition of fertilizers (it should be mostly self-sufficient), does not need pesticides (most pests should be eliminated by beneficial insects, chickens, or other natural biological solutions, and things like proper air flow and sunlight), and it minimizes replanting (true permaculture uses mostly perennials, not annual plants). A properly designed urban environment will optimize the use of local resources such as renewable energy, local food sources, and low-impact transportation. Such an urban system should also provide resources to help all people thrive, thus minimizing the need for social services.
Permaculture Summary
Please note that people spend their whole lives researching and applying permaculture - we are only scratching the surface! But hopefully, you have a reasonably good understanding of what permaculture is and how it can be applied. The following is a brief summary of some key points:
- Permaculture can be thought of as "a system of design that provides all of the needs for humanity in a way that benefits the environment." Another way to describe it is "designing human systems to mimic natural systems" and "designing systems that work with nature instead of against it."
- Permaculture integrates a number of disciplines together to apply practical solutions to sustainability problems. It effectively integrates all of the sustainability concepts that we've encountered in this course and EM SC 240N.
- Resiliency is the ability to maintain one's essential identity/character when encountering a shock to the system. It is a major focus of permaculture, and modern sustainability studies, in particular with regards to climate change. Transition towns focus on resilience and have been established all over the world.
- Permaculture focuses mostly on practical, local solutions and seeks to establish self-sufficiency. It is community- and action-oriented.
- Permaculture seeks to reconnect humans with the natural environment and to integrate human systems with natural environments in such a way that it not only minimizes negative impacts but enhances local natural resources to the extent possible.
- The three core ethics of permaculture are earth care, people care, and fair share. They should be considered when making all decisions.
- Permaculture is most often applied to food systems of every scale, but can also be used to design neighborhoods and towns/cities, and even human relationships.
- A properly designed permaculture system will allow humans and nature to not only survive but thrive.
- There are 12 design principles in permaculture, and each should be considered when designing any human system of any scale.
More Sustainability Solutions and Concepts
Permaculture provides a practical framework for addressing food sustainability issues, but there are many other specific practices and concepts that can contribute solutions as well. See below for a description of a few of them. There are many more than this, but these are some that we may/will encounter when traveling.
Regenerative Agriculture
Regenerative agriculture is closely related to permaculture, but not all permaculture food production systems are regenerative. As you might guess, regenerative agriculture refers to food growing methods that improve the natural environment, i.e., they regenerate local ecosystems. Terra Genesis International [372] provides a great synopsis of this concept. Note their use of the term ecosystem services. (If you are so inclined, they have more information on their site.):
Regenerative Agriculture is a system of farming principles and practices that increases biodiversity, enriches soils, improves watersheds, and enhances ecosystem services.
Regenerative Agriculture aims to capture carbon in soil and aboveground biomass, reversing current global trends of atmospheric accumulation.
At the same time, it offers increased yields, resilience to climate instability, and higher health and vitality for farming and ranching communities.
The system draws from decades of scientific and applied research by the global communities of organic farming, agroecology, Holistic Management, and agroforestry.
Common techniques include planting native crops that enhance biodiversity, using biochar to improve soil quality and sequester carbon, integrating animals and crops into a self-sufficient system, only using organic farming methods, and more. Like permaculture, regenerative agriculture recognizes that these systems will provide feedback and change over time and that farmers must be ready to adapt their systems as needed.
Community Gardens
Community gardens are defined by the USDA [373] as "plots of land, usually in urban areas, that are rented by individuals or groups for private gardens or are for the benefit of the people caring for the garden." Community gardens can take on many forms, but the most common one consists of any number of individual beds (from a few to a hundred or more) that are tended by individuals or groups. Most community gardens are structured such that each bed is "rented" out for a nominal annual fee, and the renter manages their bed. Community gardens typically supply water and soil, and sometimes resources such as seeds and labor assistance. They are usually overseen by a manager, but they often host group events and expect individual gardeners to help out with tasks that benefit the whole garden community. These are most common in urban areas where residents do not possess adequate space to grow their own food but can be found in many other areas. They can be found all over the world. Most gardens have a set of rules governing them, such as the types of plants they can grow and what they can use in their beds (e.g., by only using organic growing methods).
Community gardens can also take the form of school gardens located on or near school property. They can be established in elementary, middle, high school, and college environments. The goals of school gardens usually include garden, food, and/or nutrition education, though many urban gardens provide this service as well. Therapy gardens are sometimes established so that they can be accessed by people with physical and/or mental issues, as gardening has therapeutic effects. Many gardens include initiatives to grow food to donate to local organizations such as food banks.
Research has shown that there are many benefits to community gardens, including but not limited to the following. (All links originally gathered from North Carolina State University Cooperative Extension [374]:
- Increased access to and intake of nutritional food. For example, this study in Denver, Colorado [375] found that: "Community gardeners consumed fruits and vegetables 5.7 times per day, compared with home gardeners (4.6 times per day) and nongardeners (3.9 times per day). Moreover, 56% of community gardeners met national recommendations to consume fruits and vegetables at least 5 times per day, compared with 37% of home gardeners and 25% of nongardeners."
- General social benefits. This study in Flint, Michigan found that: "Results suggest that the garden programs provided opportunities for constructive activities, contributions to the community, relationship and interpersonal skill development, informal social control, exploring cognitive and behavioral competence, and improved nutrition. Community gardens promoted developmental assets for involved youth while improving their access to and consumption of healthy foods."
- Community development. A study in New York City [376] found that "the opening of a community garden has a statistically significant positive impact on residential properties within 1000 feet of the garden, and that the impact increases over time. We find that gardens have the greatest impact in the most disadvantaged neighborhoods. Higher quality gardens have the greatest positive impact. Finally, we find that the opening of a garden is associated with other changes in the neighborhood, such as increasing rates of homeownership, and thus may be serving as catalysts for economic redevelopment of the community."
- Particular benefits for low-income communities. Another New York study [377] found that: "Gardens in low-income neighborhoods (46%) were four times as likely as non-low-income gardens to lead to other issues in the neighborhood being addressed; reportedly due to organizing facilitated through the community gardens." This is a very common finding of community garden research in low-income communities.
- Stress relief. A 2010 study [378] concluded that: "Gardening and reading each led to [reduction in stress signals], but decreases were significantly stronger in the gardening group. Positive mood was fully restored after gardening but further deteriorated during reading. These findings provide the first experimental evidence that gardening can promote relief from acute stress."
There are many more studies that demonstrate the benefits of community gardens. If you have ever participated in one, you would probably be able to list a few more! It is important to note that research shows that the benefits of community gardens are particularly pronounced in low-income areas, and thus are a recognized strategy to address equity and social justice (but also environment and economy!).
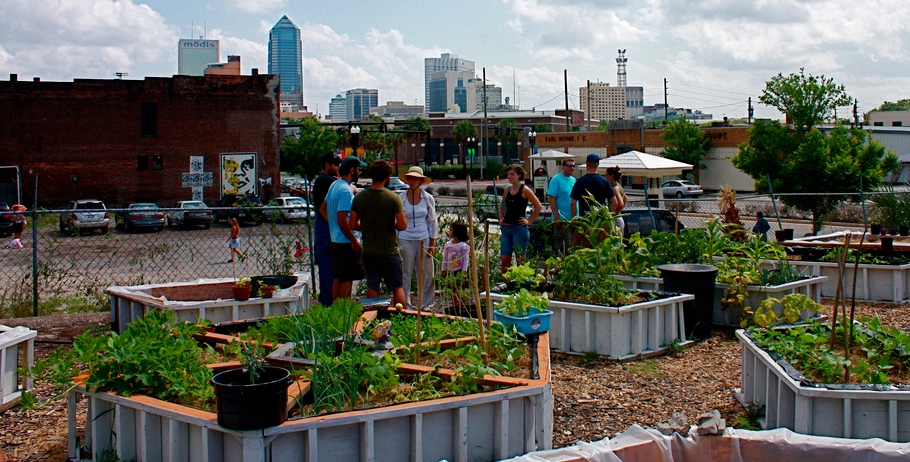
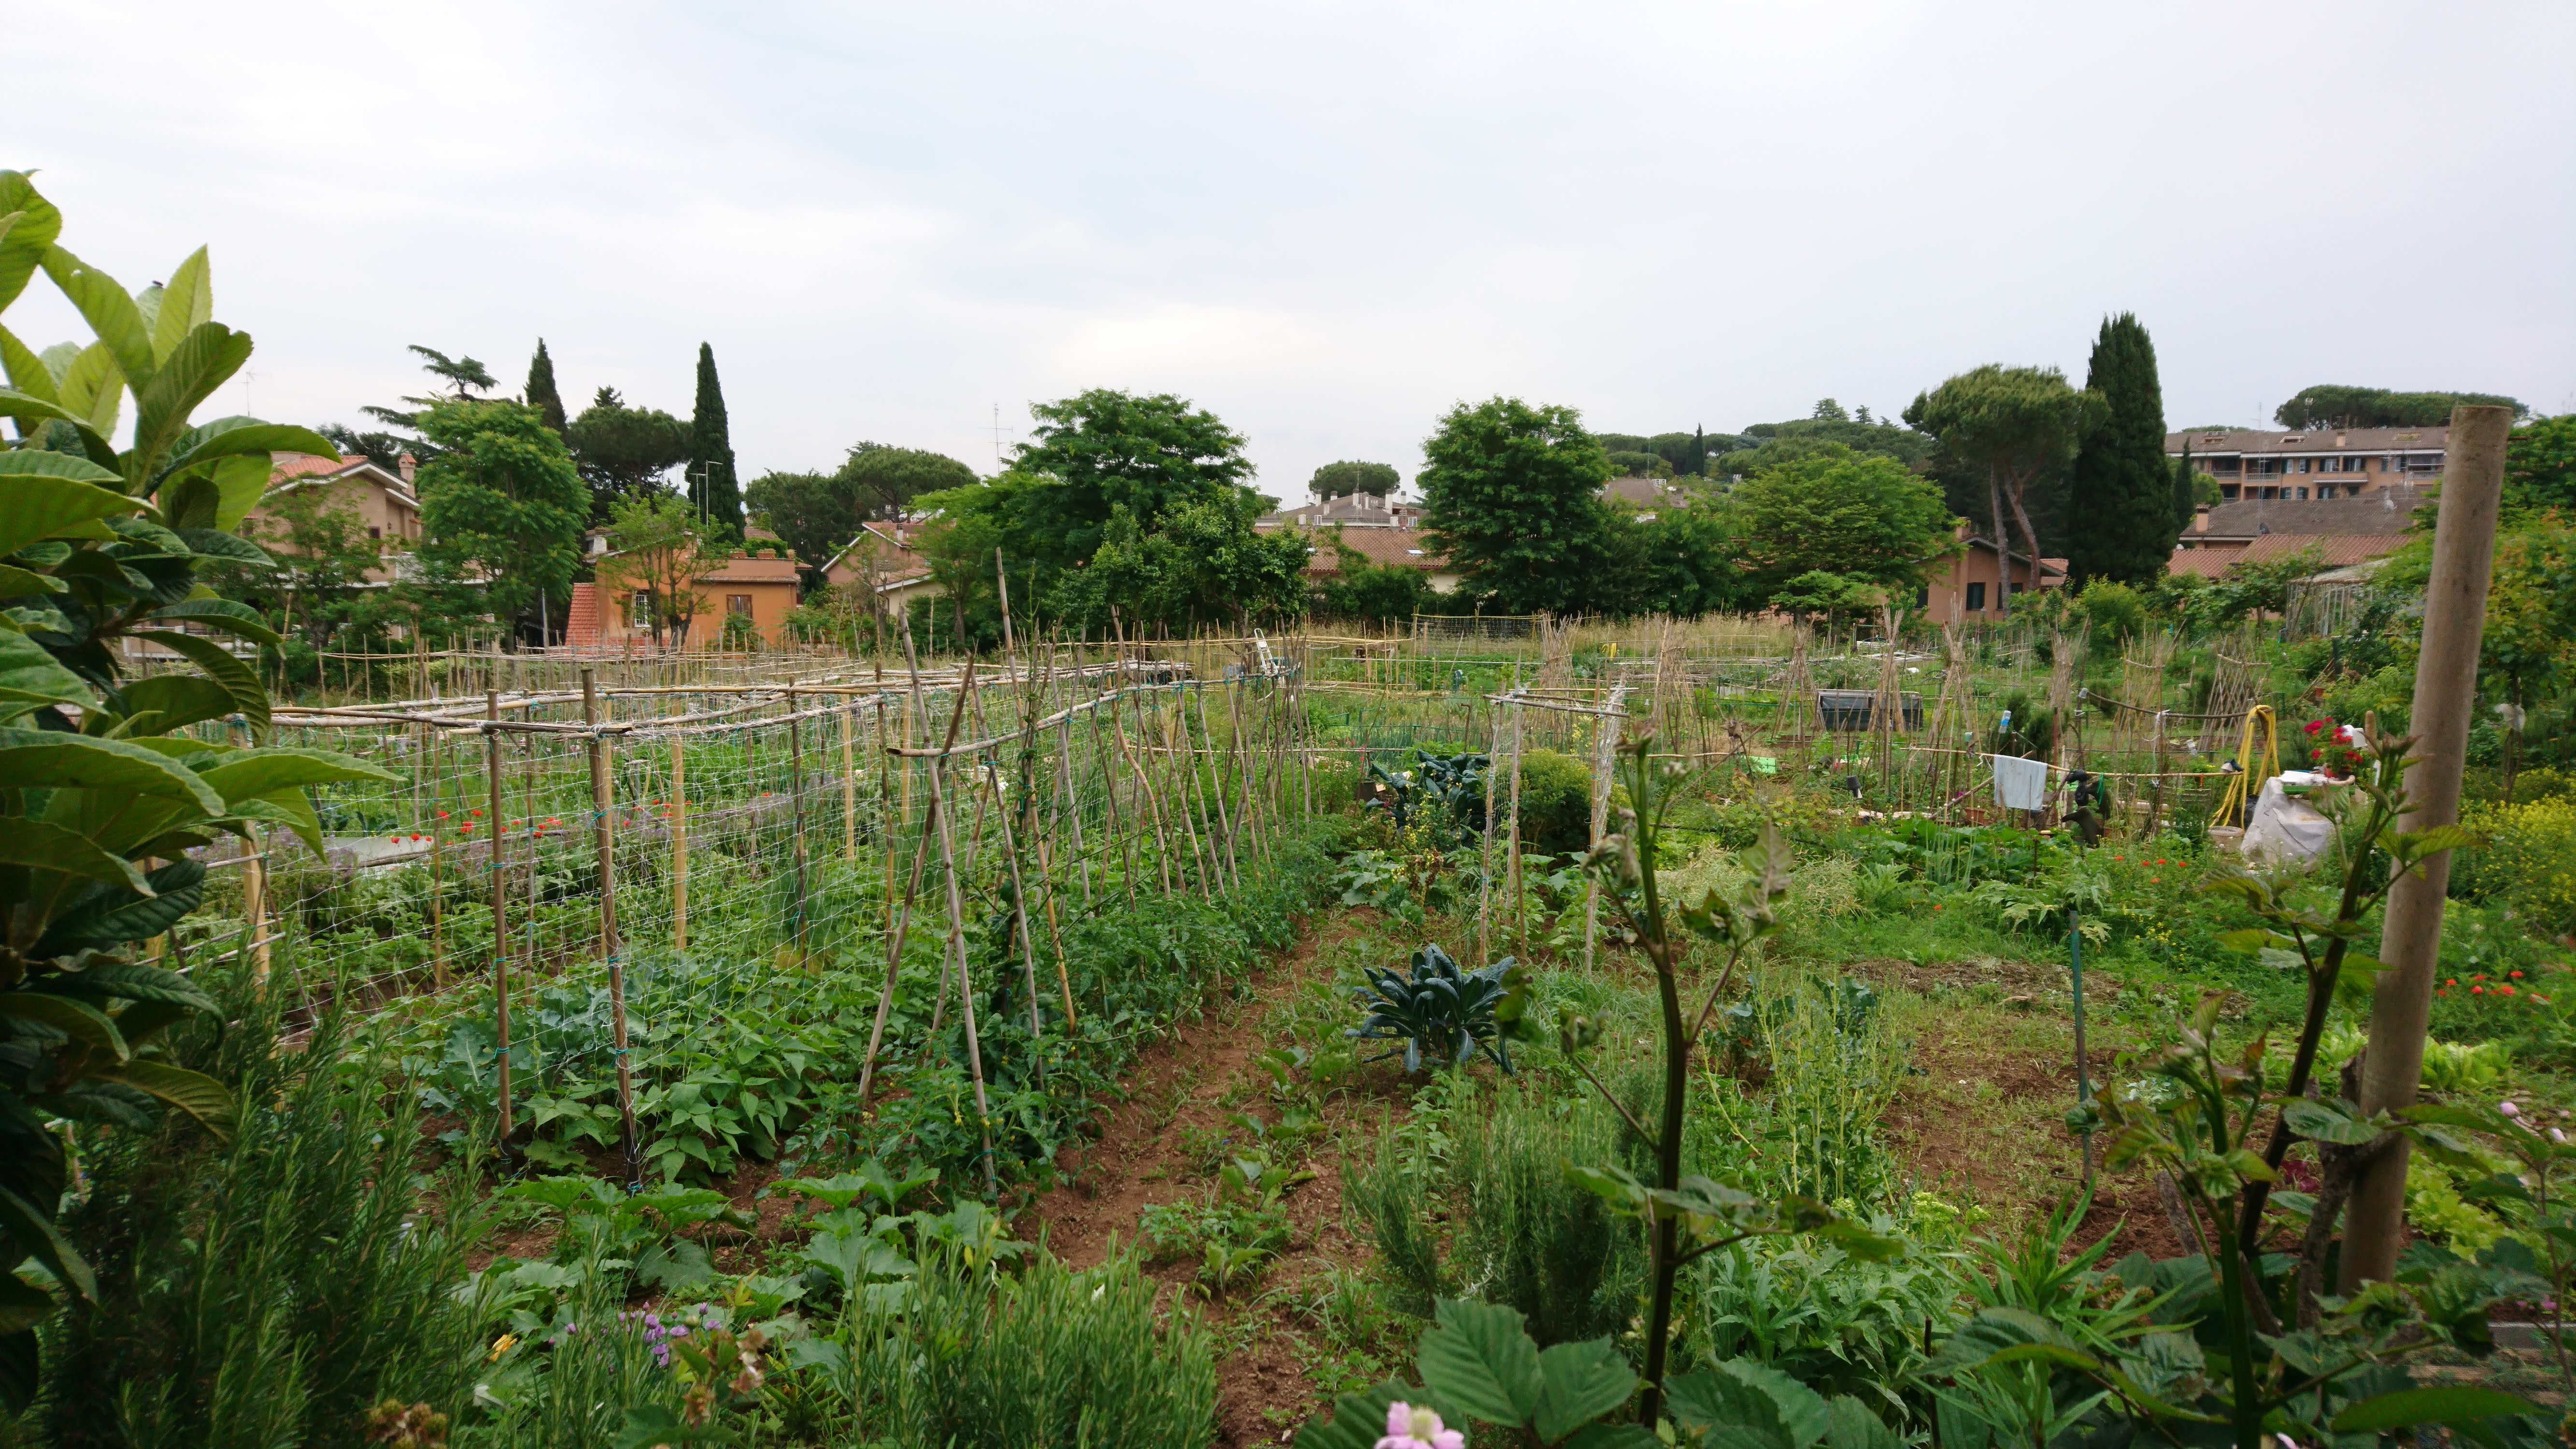
Fair Trade
You may have encountered Fair Trade goods such as coffee or chocolate when food shopping, or perhaps at a coffee shop. A fair trade good usually has a distinctive logo such as the one below. The purpose of fair trade certification is primarily to ensure that the workers throughout the supply chain were paid a fair wage. These certifications are affirmed by third-party certifiers that have no affiliation with the product at hand. They investigate the entire supply chain of the product and certify the product if it meets their standard.
One of the most common certifiers is Fair Trade Certified [381]TM (I cannot show their logo due to copyright.) They list [382] the following four standards that must be met in order to obtain certification:
- Income sustainability: ...Our standards ensure producers, workers, farmers, and fishermen have the money needed to invest in their lives and their work.
- Empowerment: Fair Trade empowers people to make choices for the good of themselves and their community, regardless of gender, status, position in society, or position on the globe. Rigorous standards give farmers, workers, and fishermen a voice in the workplace and the community.
- Individual and community well-being: ...Our model is fueled by committees of farmers, workers, and fishermen who decide how to invest the Fair Trade Premium based on their community's greatest needs: often clean water, education, and healthcare.
- Environmental stewardship: ...Our standards work to keep the planet healthy for generations to come by prohibiting the most harmful chemicals and taking measures to protect natural resources.
As you can see, fair trade can address issues beyond providing living wages. Generally speaking, it is better to buy fair trade certified goods than non-certified goods, but it is best to investigate individual certifiers to ascertain how legitimate they are.
Appropriate Technology
Merriam-Webster [383] provides a good definition of appropriate technology:
technology that is suitable to the social and economic conditions of the geographic area in which it is to be applied, is environmentally sound, and promotes self-sufficiency on the part of those using it.
The use of appropriate technology is a particularly important consideration when providing assistance to low income or otherwise marginalized communities. The idea behind appropriate technology is to make sure that any solutions proposed and/or aid provided is appropriate for the local conditions. These "conditions" can include local natural resources, but very often include local human capital, such as local knowledge, expertise, and physical capabilities. As indicated in the definition, it must promote self-sufficiency (which goes hand-in-hand with the first point).
For example, if a well-meaning organization travels to rural Mongolia or Peru to install a solar array and provide electricity, they must consider whether the locals that they are trying to help have the expertise to repair the system if it breaks down. Perhaps there is existing local expertise, or perhaps they need to be trained. Also, can they get replacement parts if they are needed? Are the solar arrays and components at risk for damage due to local wildlife or human populations? These are all questions that must be asked if self-sufficiency is to be addressed. One of the best ways to utilize appropriate technology is to work with the local populations to help them come up with solutions, instead of telling them what to do. Most likely they will have a wealth of knowledge to offer regarding the local conditions (they live there, after all!), but they likely also have experience trying to implement solutions.
The National Center for Appropriate Technology [384] in the U.S. provides a number of examples and explanations if you are so inclined. They work primarily with low-income populations in the U.S. to provide services such as energy assistance and sustainable, local food systems.
More Site Visits!
Here are some more site visits! Again, this is not required reading. I suggest browsing through them if/when you have time. This may help inspire your final project proposals!
- Black Cat Farm and Restaurant [385], Boulder (We will definitely go to the restaurant, and probably visit the farm.)
- Sustainable Settings Farm [386], Carbondale
- Denver Urban Gardens [387], Denver
- Delaney Community Farm [388], Denver
Summary and Final Tasks
Summary
By now you should be able to do all of the following:
- analyze the water footprint of various foods;
- describe how improper fertilizer management causes dead zones;
- define eutrophication;
- describe the sustainability implications of food deserts and food insecurity;
- demonstrate an understanding of permaculture philosophy and principles;
- describe regenerative agriculture and appropriate technology;
- analyze the sustainability impacts of community gardens;
- explain the benefits of fair trade certification.
Reminder - Complete all of the Lesson 9 tasks!
You have reached the end of Lesson 9! Double-check the to-do list on the Lesson 9 Overview page [389] to make sure you have completed all of the activities listed there before you begin Lesson 10.
Lesson 10: Geography, Water, and Energy in Colorado
Overview
In the final full lesson of this course, you will learn some basics of Colorado geography (and geology), energy, energy policy, water, and water policy.
Learning Outcomes
By the end of this lesson, you should be able to:
- identify and describe major geographic regions and features of Colorado;
- analyze population and precipitation patterns in Colorado;
- describe the basic geology of the Rocky Mountains and the Front Range;
- explain the concept of "first in time, first in right" in terms of Colorado water policy;
- define RPS, REC, SREC, ITC, and PTC as they relate to energy policy;
- explain how renewable portfolio standards incentivize renewable energy.
Lesson Roadmap
| To Read | Lesson 10 Online Content | You're here! |
|---|---|---|
| To Do |
|
|
Questions?
If you have any general course questions, please post them to our HAVE A QUESTION discussion forum located under the Discussions tab in Canvas. I will check that discussion forum regularly to respond as appropriate. While you are there, feel free to post your own responses and comments if you are able to help out a classmate. If you have a question but would like to remain anonymous to the other students, email me through Canvas.
If you have something related to the material that you'd like to share, feel free to post to the Coffee Shop forum, also under the Discussions tab in Canvas.
Colorado Geography
Welcome to Colorado!
Colorado is known as the "Centennial State" and is the 8th largest state [391] in the U.S. by area, at a little over 104,000 square miles. As a point of reference, it is over twice the size of Pennsylvania. However, it has only the 21st highest population [392], at just over 5.6 million people as of 2018. (Pennsylvania is 5th at around 12.8 million people.) The capital is Denver, which is known as the "Mile High City" because most of the city is at or above 1 mile above sea level. While known for its mountains, a significant portion of Colorado is part of the Great Plains and is nearly flat. Even the plains are at a high elevation, and in fact, Colorado has the highest average elevation of any state in the U.S. Colorado has more peaks higher than 14,000 feet (58 of them!) [393] than any state in the country. If you travel to Colorado for any amount of time, you will no doubt overhear discussions about these "fourteeners." It is nearly a universal pastime to climb fourteeners.
As you will read below, Colorado has a very diverse landscape and culture. It is known for the availability of outdoor activities (hiking, skiing, camping, white water rafting, biking, etc.), but also has an interesting mixture of modern and historic culture and practices. Farming and ranching are important to its economy and culture, but so are tourism, higher education, and high tech industries, among many other things. It is a wonderful state to explore!
As you probably recall, we will spend most of our time in Denver and Boulder, but will also drive through the mountains to the Western Slope town of Paonia. We will thus experience a variety of Colorado culture and scenery, from the Eastern Plains to the Front Range, as well as the Western Slope. More details on these regions below.
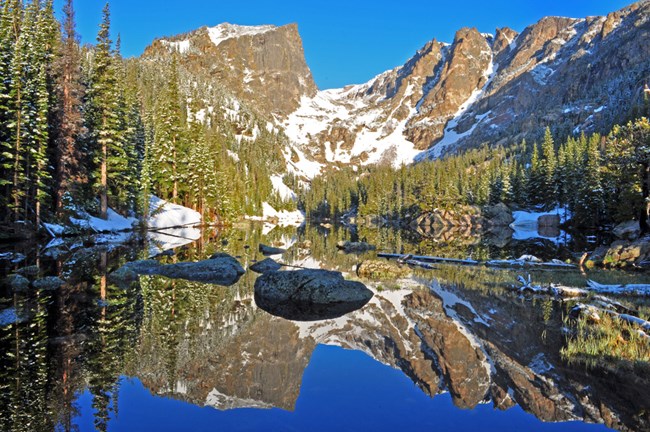
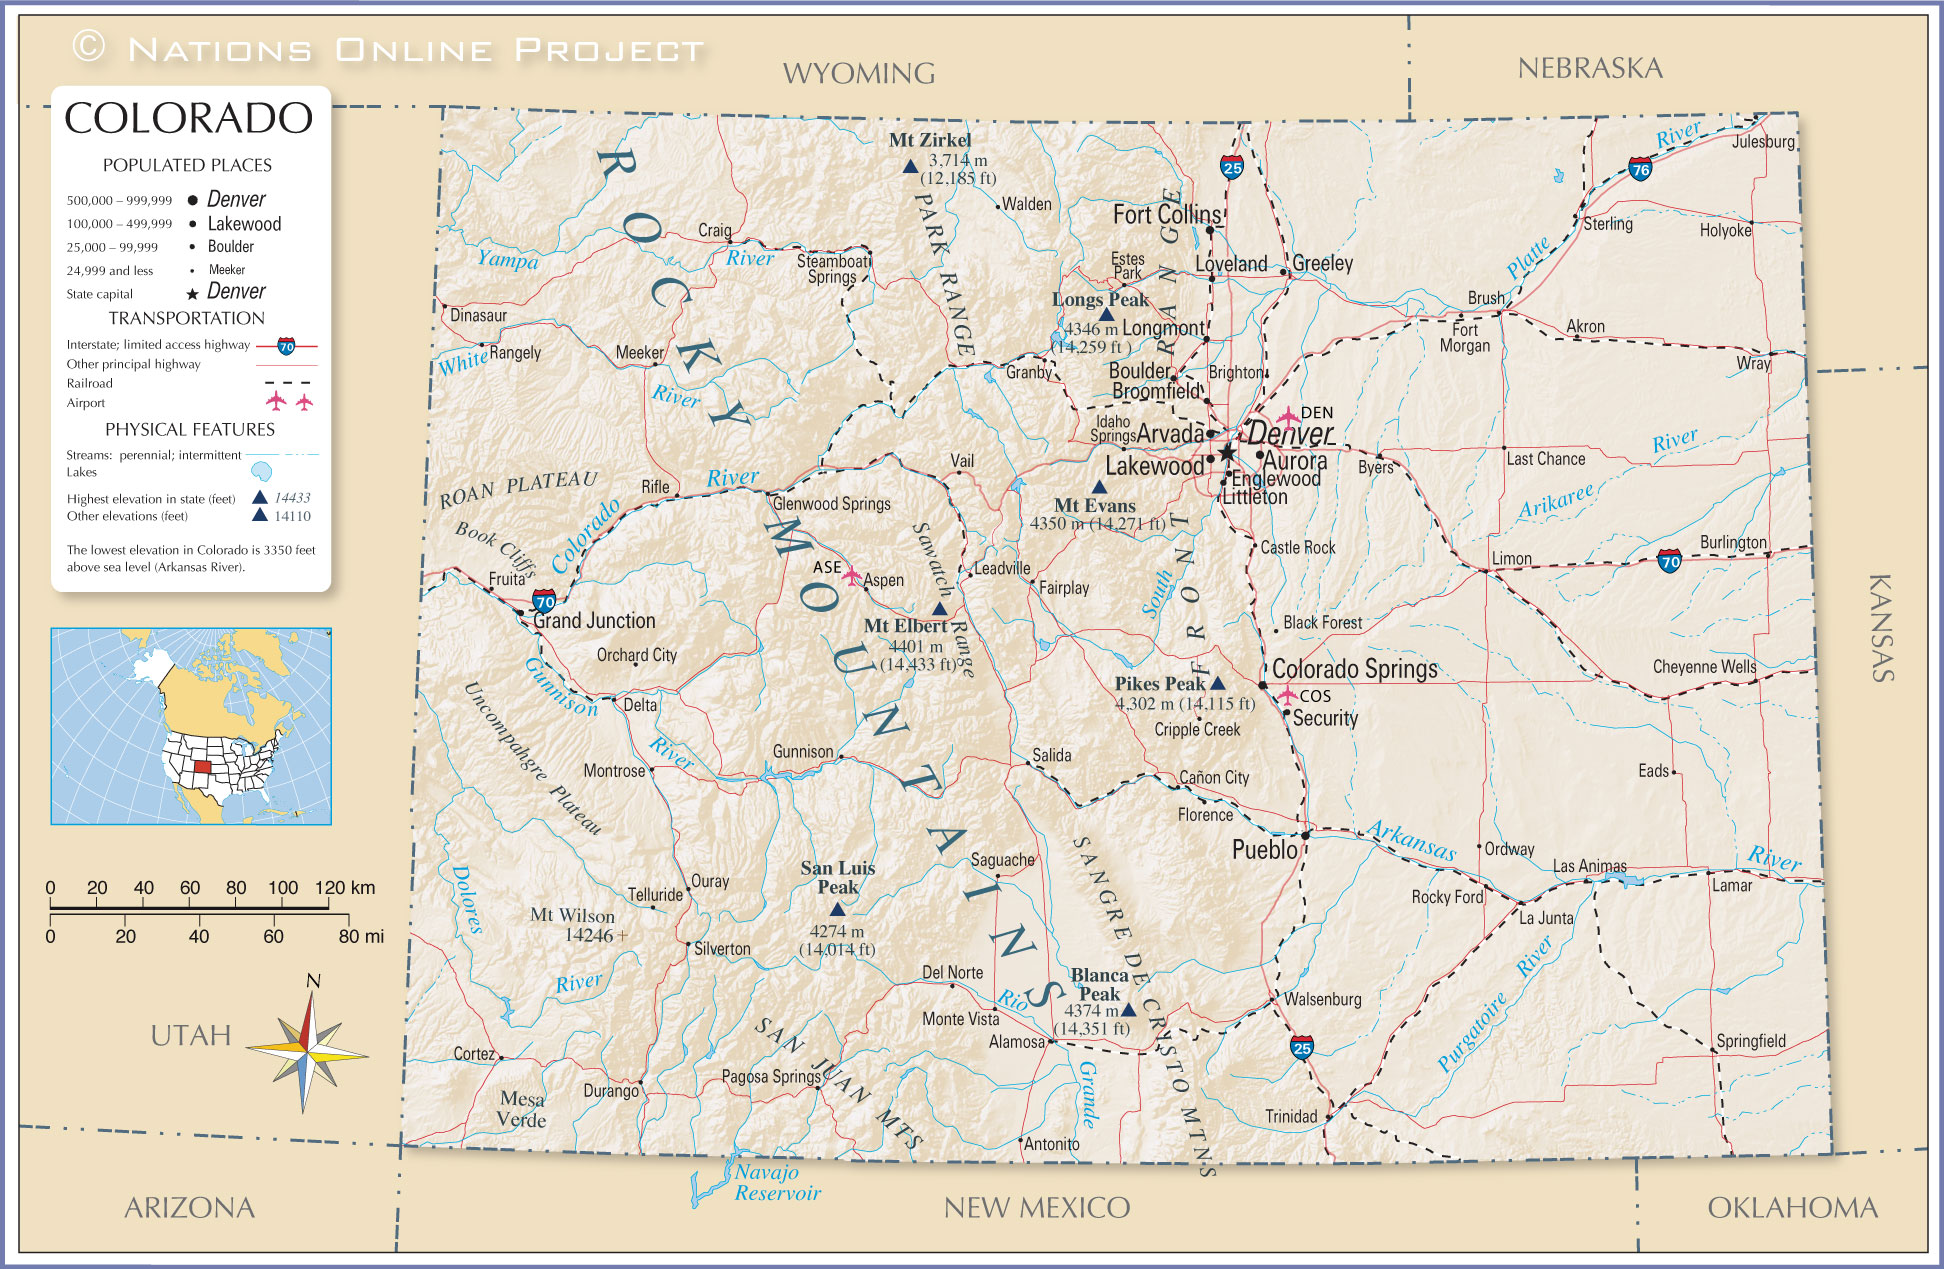 [395]
[395]
Regions and Geography
Colorado has many local regions and other geographic features [396], but the major ones that we will experience are as follows:
- The Front Range [397], which is where most of the population of the state resides. In figure 10.4 below, the front range is roughly the easternmost portion of the Southern Rocky Mountains but also is generally understood to encompass the westernmost portion of the Great Plains, including parts of the Colorado Piedmont. (The boundaries of the Front Range are not distinct). The Front Range is often thought of as the foothills of the Rockies, and you will see why that is when we travel there. All of the major population centers of Colorado, including Denver, Fort Collins, Boulder, and Colorado Springs are considered part of the Front Range. According to the Colorado Encyclopedia, about 4.5 million of the state's 5.6 million people live in the Front Range. Red Rocks Amphitheater [398], the famous outdoor concert venue and geologic feature lies in the Front Range just outside of Denver. (We'll visit this, too!)
- The Western Slope [399], which is generally understood as the area of the state that is on the other side of the Continental Divide (see below). In Figure 10.4 below, you can visualize the Western Slope if you mentally draw a north-south line through the middle of the Southern Rocky Mountains province - the Western Slope is everything to the west of that line. (Sorry, I could not find an image of this exact province.) The Western slope covers the eastern third of the state, but only has about 10 percent of the residents. Perhaps most importantly, it has about 70 percent of the state's water. The Western Slope is mostly mountainous and contains most of the "classic" Rocky Mountain geography (e.g. the image of Rocky Mountain National Park above). Most of the mountain towns and ski resorts (Vail, Aspen, Keystone, Breckenridge, etc.) lie in the Western Slope. However, most of the westernmost portion is part of the Colorado Plateau and has desert features such as mesas and plateaus. Paonia is a very small town and does not appear on the map below, but it lies almost directly on the boundary between the Southern Rocky Mountains and the Colorado Plateau, just northeast of Montrose.
- The Eastern/Great Plains [400], as you can see in the image below, covers about the eastern third-to-half of the state. This is characterized by mostly flat land covered in prairie grasses and dotted with small towns. Between the towns are generally wide open spaces covered in farms, ranches, and some public lands. We won't really experience this area, but Denver lies at the edge of it, and you can see the Great Plains' physical geography while traveling from the Denver airport to the city.
See the video below the image for a good explanation of how the Rocky Mountains and the Front Range formed. Note the explanation of why Red Rocks and other parts of the Front Range are sedimentary rocks (made from ancient sediments such as sand and silt) that were originally layered on top of the granite "basement" rock, and the Rocky Mountains themselves are made of granite that was pushed up via oceanic subduction. Some of this granite core is over 1 billion years old! (Side note: Geology is awesome!)
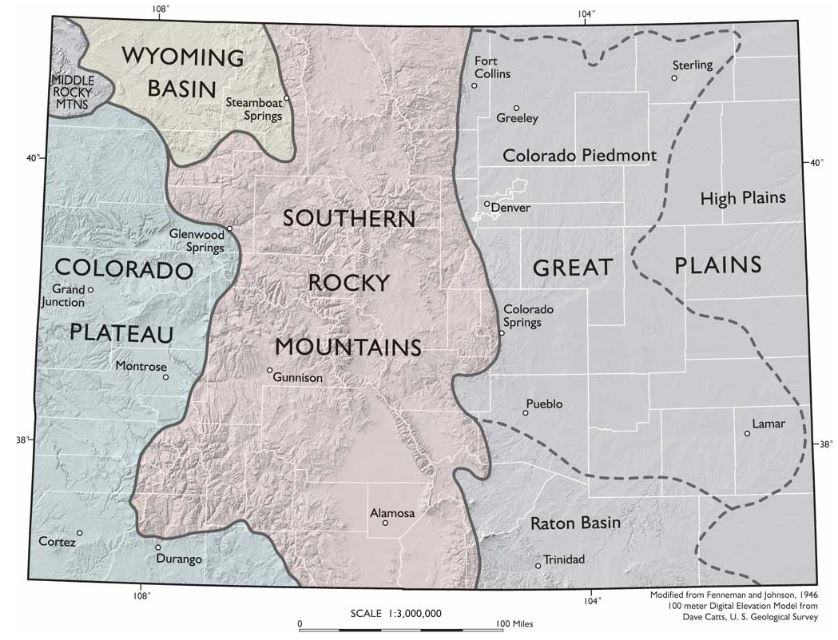
NARRATOR: On our journey south along the Rocky Mountains we're entering a very different landscape. From Montana southward the Rockies are made from ancient granite 1.7 billion years old. Granite makes up much of the deepest part of the continental crust. That's why geologists call this rock the basement.
The Canadian Rockies are built from sedimentary rocks piled up on top of the continental foundations. So why does granite suddenly appear here in the American Rockies? But there's an even greater puzzle. Mountains usually form close to plate boundaries, but the southern Rockies sit a long way from the plate margin.
The Front Range in Colorado is a thousand miles from where the Pacific and North American plates actually meet. Geologists have come up with an explanation. They believe that the subducting Pacific ocean plate is responsible. Ocean crust had been pushed deep into the mantle beneath North America for a hundred million years when something unusual happened. Plates started to subduct at a shallower angle. Instead of plummeting steeply, it sliced beneath North America horizontally. This change had dramatic consequences.
DR. KIRK R. JOHNSON: The big oceanic plate in the Pacific didn't go deep down it went in shallow like a spatula under a pizza. So something happened sixty-eight million years ago over in California. That plate drives under North America but instead of diving deeply it comes in shallow and a thousand miles away from the coast up from the ground throughout the Rocky Mountains.
NARRATOR: For millions of years the ocean plate scraped along the underside of North America. It created friction breaking up the basement granite of the North American plate and punching it upward. Structural geologist Karl Karlstrom demonstrates.
PROF. KARL E. KARLSTROM: Because it was at a shallower angle beneath North America it was scraping along the base of North America. When that happens it puts the plate under compression like this because it's being both pushed at the end and scraped along at the bottom. So it squeezes, pushes up the mountains, and it transferred this mountain building from the edge to great distance from the plate margin.
NARRATOR: The shallow angle trajectory of the Pacific Ocean plate explains why these mountains formed so far inland and it also explains the presence of granite. Thrust up through layers of sedimentary rock the broken granite became the Rocky Mountains of the south.
Red Rocks Park, Denver Colorado, a landscape forged by granite uplift. The granite mountains here have been pushed up for miles. On top of the granite lie spectacular red slabs of rock known as flat irons. They're the patchwork remains of sedimentary rock that once blanketed the entire granite basement. Kirk Johnson demonstrates how these granite peaks punched up through the layers of red rock around them.
KIRK JOHNSON: I'm going to use my assistants Veronica and Ian to help me explain how the Rocky Mountains in Colorado formed. Imagine if you will that Veronica and Ian are composed of 1.7 billion-year-old metamorphic rocks, the basement Rock of Colorado.
NARRATOR: Before the mountains grew, layers of sedimentary rock covered the granite.
KIRK JOHNSON: And then in about sixty-eight million years ago the mountain where Ian is starts to break and lift up and move up so you see the uplift forming. What's happening is that layer of sediments being deformed is bent and these are the flatirons at Red Rocks. As the mountain comes up overlying sediment eroded off and deposited into the adjacent basin and eventually Ian's granitic back is exposed as the core of the Rocky Mountains. Veronica remains deeply buried beneath Denver still covered with deep sediments and the sediments eroded off the uplifting Rocky Mountains.
To Read Now
Please read the following sections of this article from Encyclopaedia Britannica [403]:
- Intro
- Land
- Climate
- Settlement patterns
Continental Divide
Another well-known feature of the state is the Continental Divide, sometimes referred to as the Great Divide. A continental divide is defined by National Geographic [404] as "a naturally occurring boundary or ridge separating a continent’s river systems. Each river system feeds into a distinct ocean basin, bay, or sea." As you can see in the image below, there are a number of continental divides in North America. Each of these lines is the boundary between two major drainage basins. The rivers and streams in each basin lead to a specific large body of water.
For example, the Eastern Continental Divide runs through Pennsylvania. Flowing water to the east of the divide ends up in the Atlantic Ocean, and west of the divide ends up in the Gulf of Mexico. In Colorado, water to the west of the Continental Divide flows to the Pacific Ocean, and to the east flows to the Gulf of Mexico (and ultimately the Atlantic Ocean). You may see signs while traveling through the mountains of Colorado like the one below that mark portions of the Continental Divide. There is also a trail that roughly follows the divide that is a national park - Continental Divide National Scenic Trail [405].
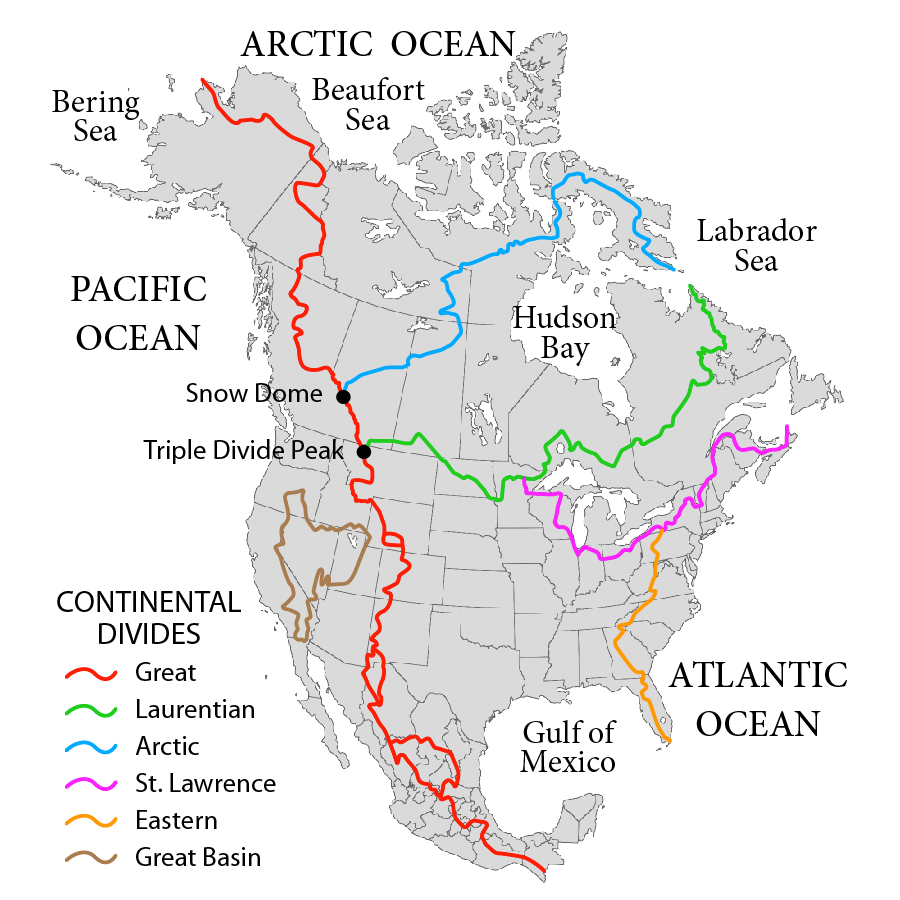
.jpg)
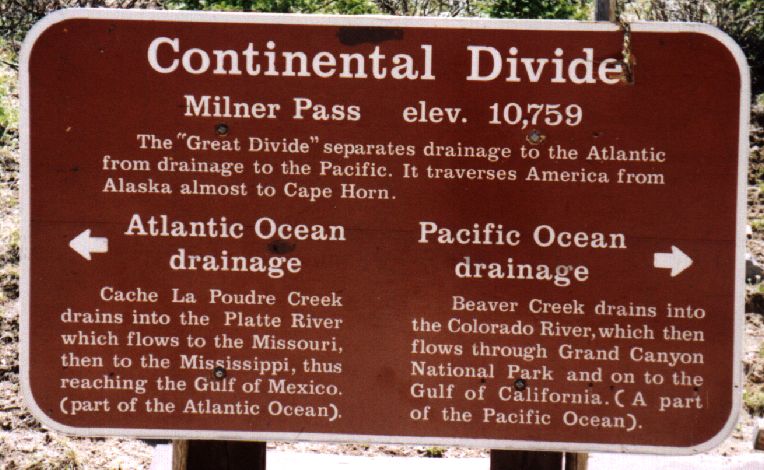
Water and Policy in Colorado
As the saying goes: "Whiskey's for drinking, water is for fighting." This is not far from the truth in Colorado! Water use and water rights are prominent issues in the state. It is an unusual experience for anyone that grew up on or near the East Coast, where the issue of water rights almost never comes up, to move to Colorado and find out that the "average" person is conversant in water rights. Water is such an important issue for Coloradans (and many who live in the western United States) because it is relatively scarce. As you can see in the maps below, most of the state receives under 20 inches of precipitation per year, and in fact, the average rainfall across the state is 15 inches per year, according to Denver Water [410]. This makes most of the state semi-arid, which means that it is climatologically not far away from a desert (arid) environment. As a point of comparison, most of the land east of the Mississippi receives more than 35 inches per year, with State College, PA receiving about 40 inches per year [411].
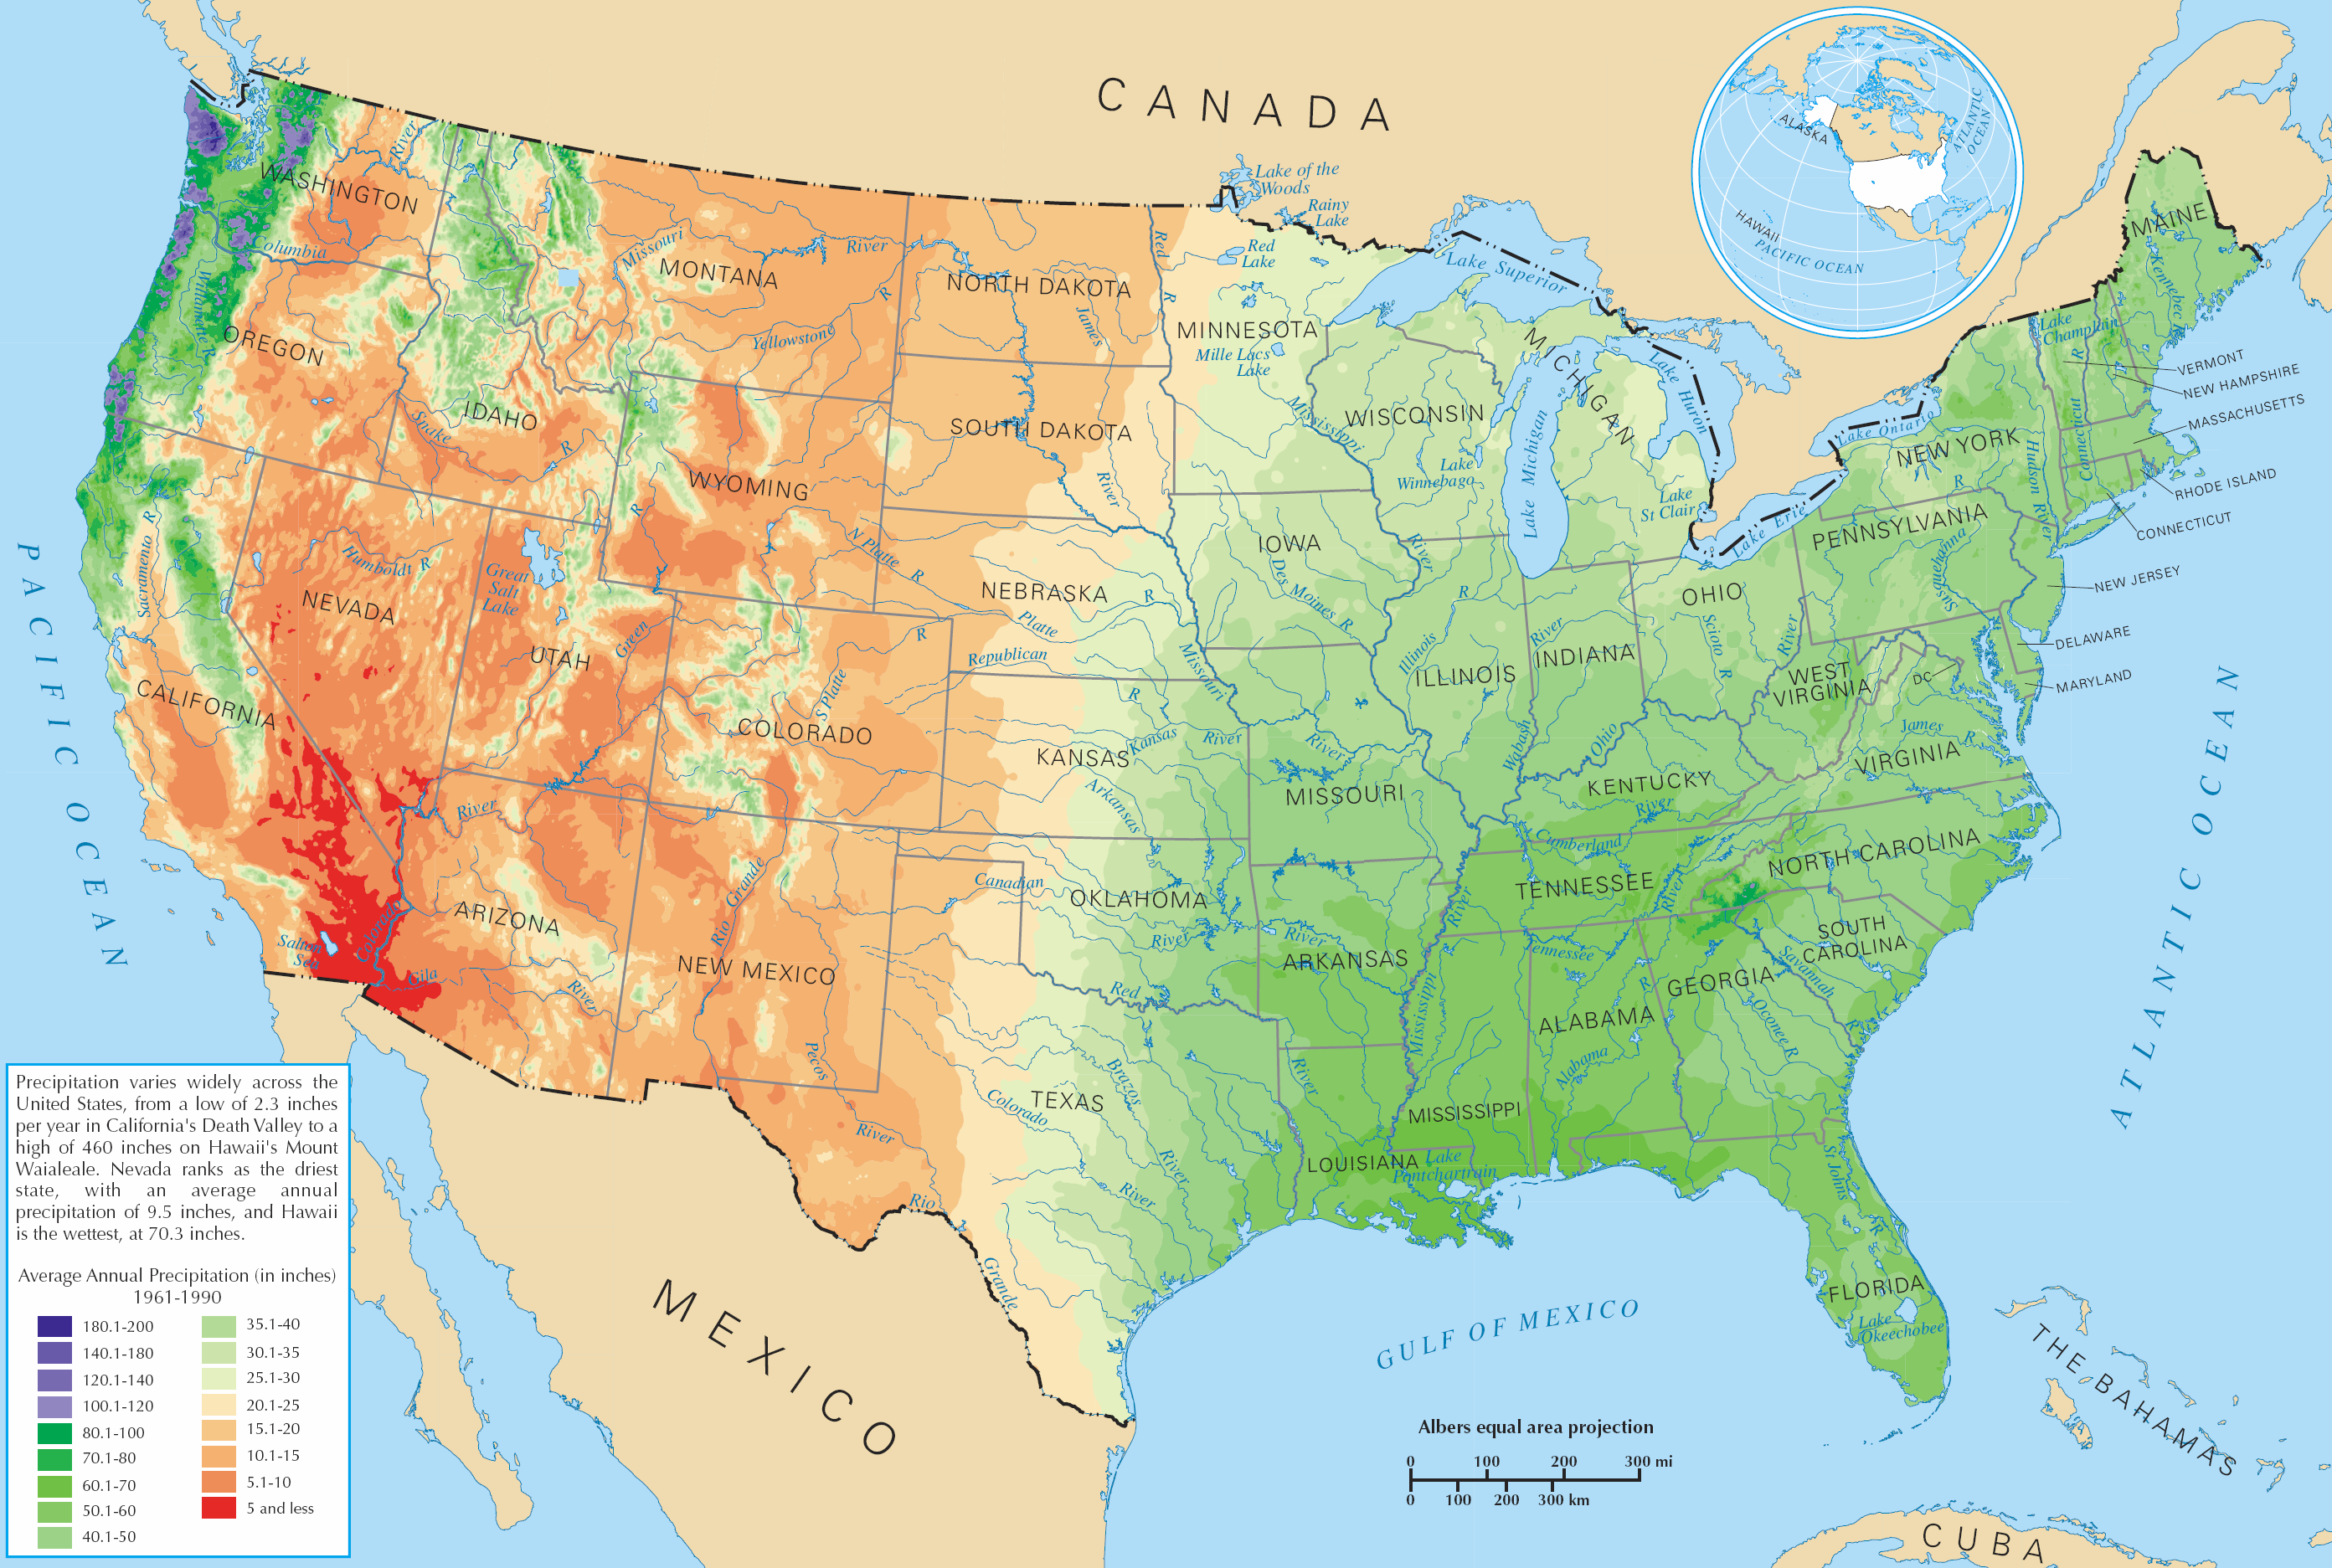
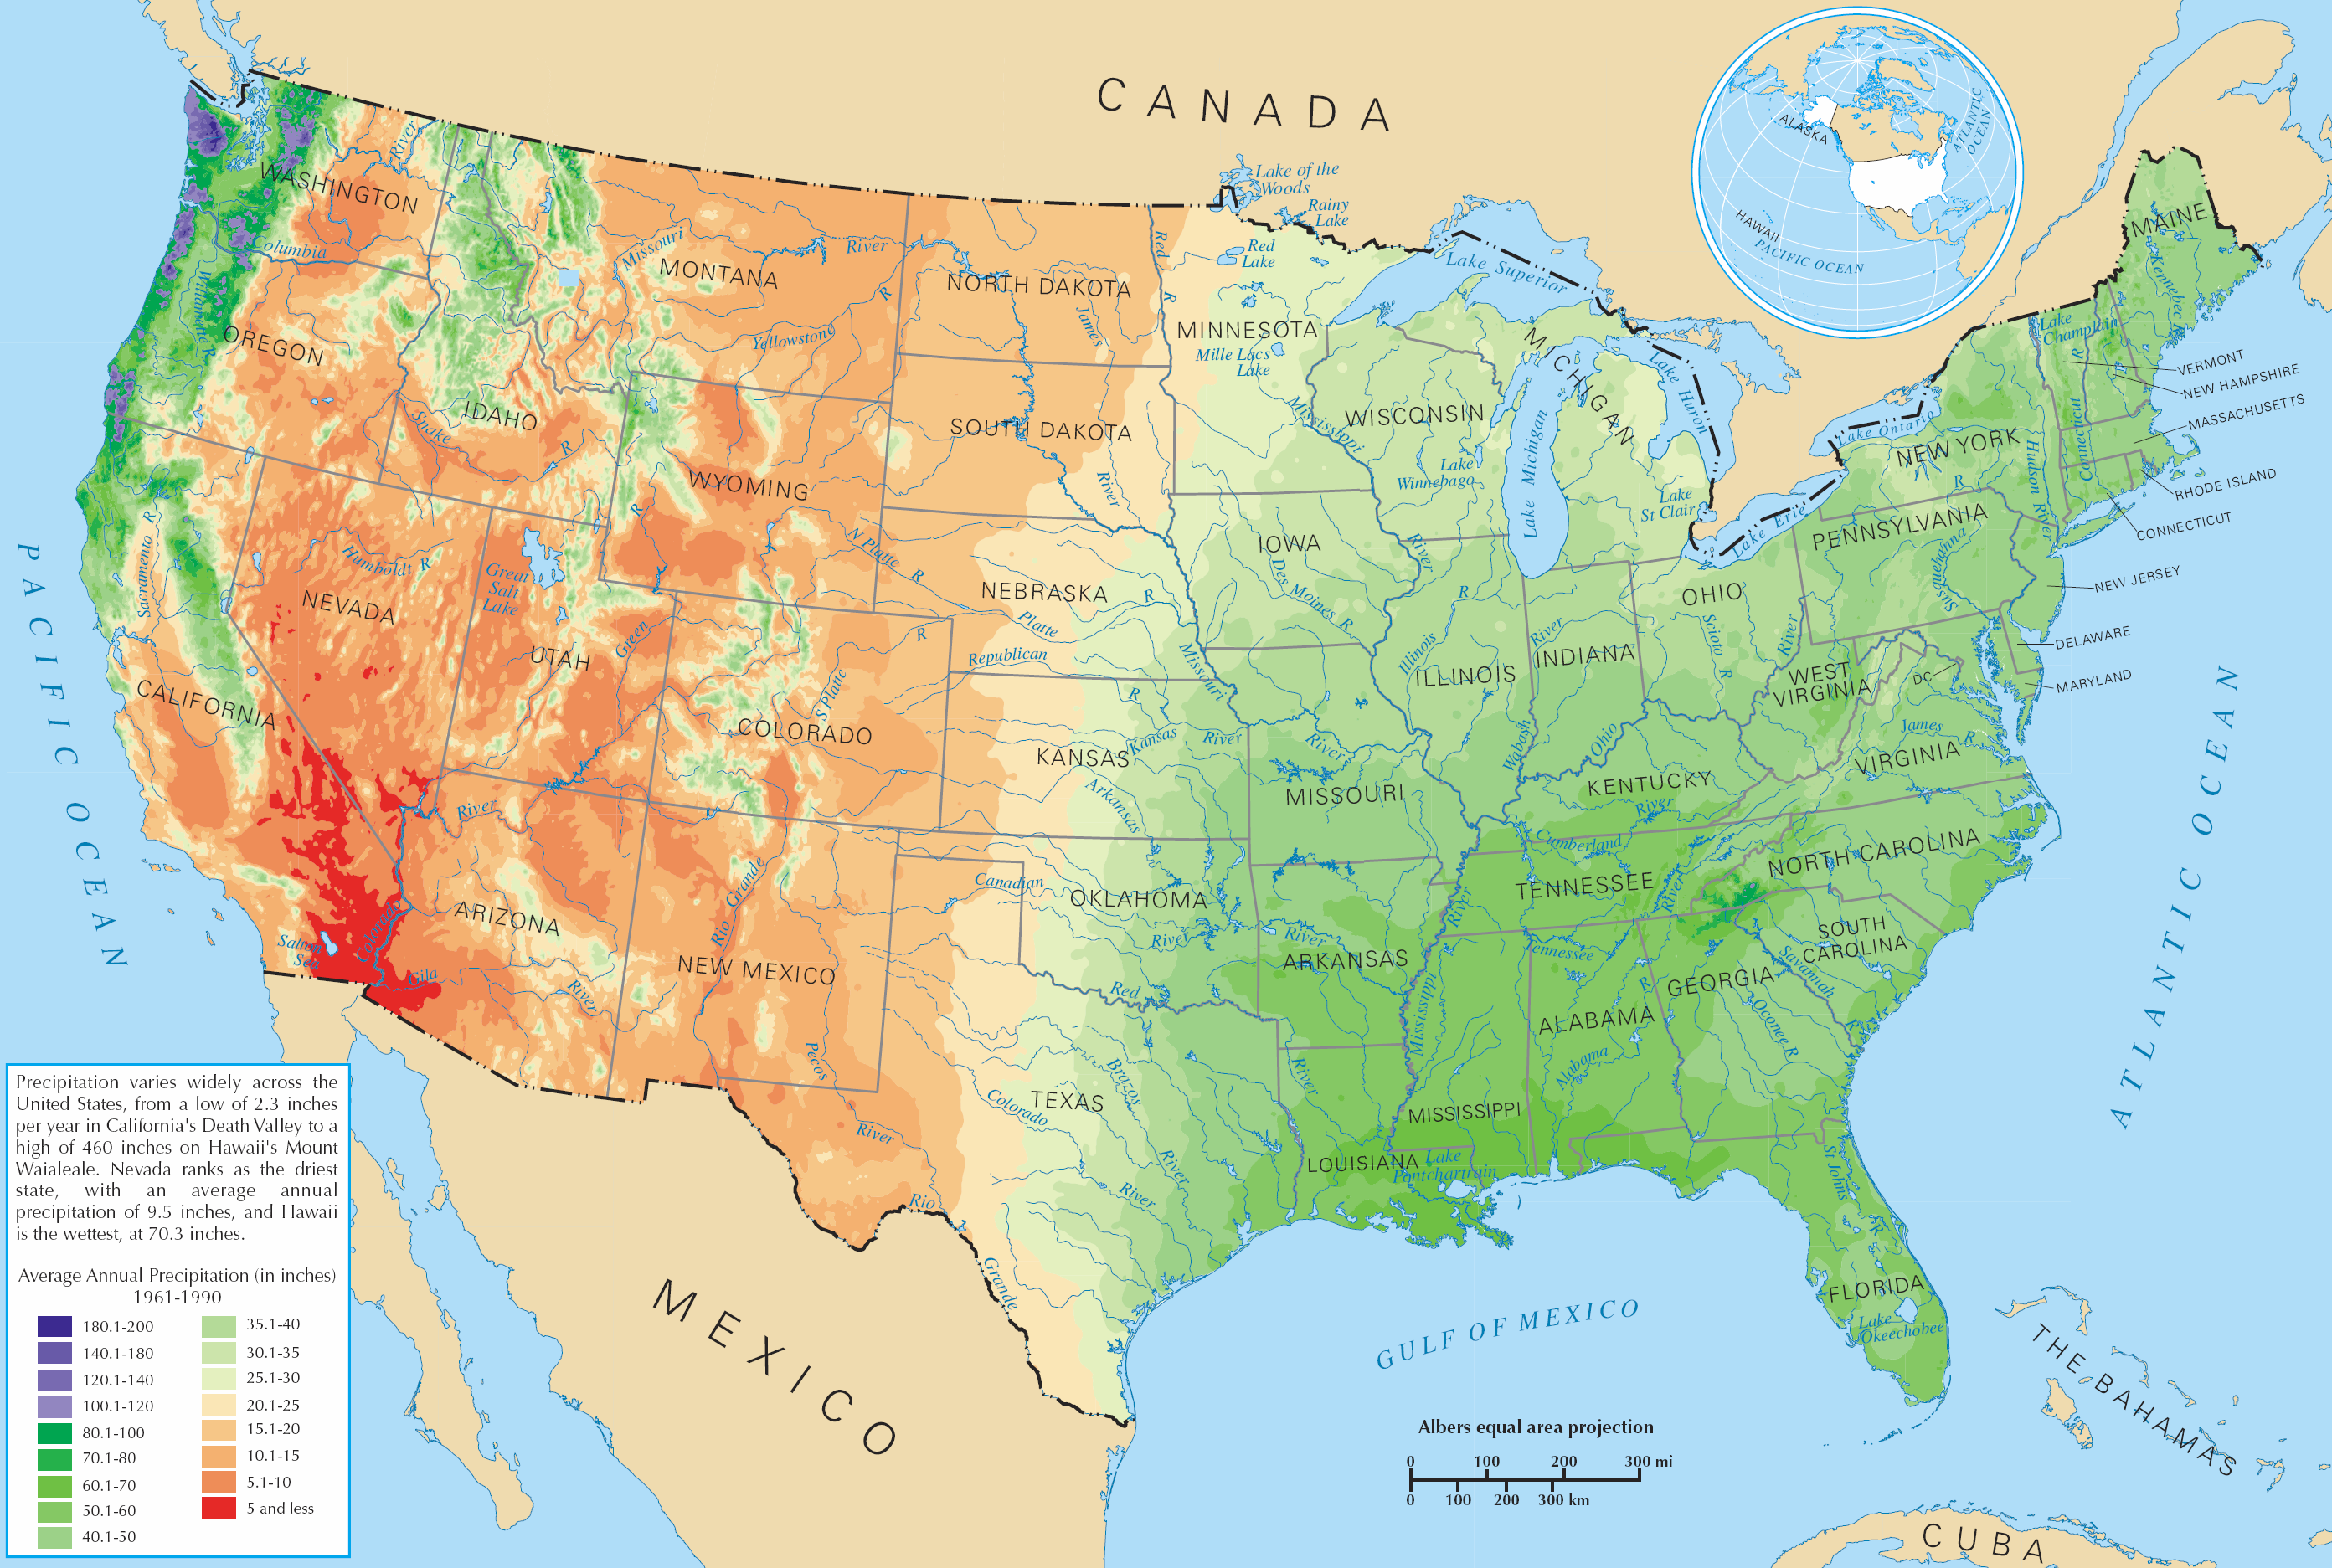
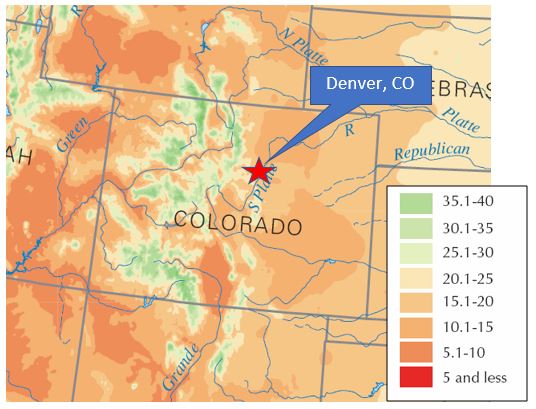
Further complicating matters is the comparison of the rainfall and population geographies of the state. Recall that the Western Slope of Colorado lies west of the Continental Divide and the Eastern Slope (including the Front Range) to the east. According to "Water Law" (Denver Water) [410], 10 percent of the state's residents live on the Western slope, but it contains 33 percent of the state's land and 70 percent of its water. Because of this, Western Slope water is often used on the Eastern Slope. This, in addition to relative scarcity and Colorado water laws, has contributed to water being a major issue in the state.
To Read Now
Please read the following summary of Denver and Colorado water policy. Read the sections entitled "Water law," "Water rights," "Rain barrels," and "Graywater use."
- "Water Law" (Denver Water) [410]
Energy and Policy in Colorado
Colorado has a very diverse and often contentious energy landscape. For example:
- On the one hand, the oil and gas industry is very important to the state. According to the U.S. EIA, Colorado is the fifth-largest natural gas producing state in the country [415] and the state has about 4% of the country's oil reserves. The EIA also notes that the state's "crude oil production has quadrupled since 2010." About half of its electricity comes from coal.
- On the other hand, the state is home to the National Renewable Energy Laboratory [416] (NREL), which is one of the premier renewable energy research organizations in the U.S. It is one of the U.S. national labs and is the only national lab that focuses on renewable energy. The EIA notes that: "Electricity from renewable sources has more than doubled since 2010 to almost 25% of Colorado's net generation in 2017, led by increased wind power from the state's nearly 2,000 turbines." According to the EIA, 23.7% of the state's electricity generation came from renewables in 2018 [417].
While traveling through Colorado, it is not uncommon to see oil pump jacks, wind turbines/farms, fracking operations, solar arrays, and coal-fired power plants. (We will probably see more than a few of each during our time there.) Solar Energy International [308] has its training headquarters in Paonia on the Western Slope (we will visit them), yet fracking wells dot the local landscape and it is not uncommon to see train cars full of coal while traveling to and from Paonia. This variety can and does cause conflict, with fossil fuel advocates having strong disagreements with renewable energy advocates on personal and political levels.
The image below shows Colorado's 2014 fuel mix (the latest data available). You have seen this type of chart in EM SC 240N. Remember that this is called a "Sankey" chart and indicates energy flows. The numbers are all Trillions of BTUs (TBTUs) of energy, and the lines indicate the energy flows to different sectors. Remember that you read the chart from left to right, and can follow each primary energy source (the sources to the left) to see where they are used.
- For example, of the 351 TBTUs of coal burned in 2014, 342 TBTUs were used in electricity generation (97.4%), 8.4 TBTUs were used in the industrial sector (2.4%), and 0.15 TBTUs were used in the commercial sector (0.043%).
- You can also analyze individual sectors (electricity, residential, commercial, etc.) by using the chart. For example, the industrial sector used 314 TBTUs in 2014, of which 191 TBTUs were from natural gas, so 60.8% (191/314) of industrial energy came from natural gas in 2014.
- You can determine the efficiency of whole sectors by dividing the total energy used in the sector by the "useful" energy (useful energy is referred to as "energy services" on the chart).
 [418]
[418]
Energy Policies
Energy policy can be very intricate and can vary significantly from state-to-state and even within states. If you are interested in finding out which energy policies exist in each state (and nationally), hands-down the best website for details is DSIRE [419], which is out of NC State University but is managed in conjunction with the U.S. Department of Energy. Believe it or not, DSIRE lists 125 energy policies [420] that apply to the state of Colorado! Obviously, we do not have time to go over all of them, but a few of the most prominent ones are below.
Renewable Portfolio Standards (RPS)
Renewable Portfolio Standards (RPSs) are created through legislation and require electricity providers to provide a certain percentage of their electricity from renewable (or alternative) sources. Each state is able to pass its own RPS law (or not), as there is no national RPS in the U.S. Each RPS dictates the percent targets compliance years (see below), and also indicates which energy sources can be used to meet the RPS goal.
Utilities must prove that the required percentage of the electricity they sell is from one of the eligible renewable sources. The three primary ways they do this is a) build and generate their own renewable electricity installations (e.g. a large solar array or wind farm), b) purchase renewable energy from a dedicated supplier (e.g. an independent owner of a large solar array or wind farm), or c) "take credit" for renewable electricity generated by customers on their grid. Utilities rarely build their own generation facilities nowadays (option a), but signing long-term contracts with independent suppliers is becoming very common (option b).
It is very common for utilities to "take credit" for customer-generated electricity, in particular through residential solar arrays. They do this by paying the customer a fee to take credit for the electricity they generate. Each credit is called a "renewable energy credit (or certificate)" (REC), though solar credits are often referred to as SRECs (solar renewable energy credits). REC and SREC prices are set by different mechanisms, but usually, they are sold on the open market. There are too many details to go into here, but here is an example of how this could work: Let's say I have a solar array and I generate 1,000 kWh of electricity in a year (this is 1 MWh of electricity). If the utility agrees to pay $50/SREC, then they would pay me an additional $50 at the end of the year. If I generate 2 MWh, I would get $100, and so on. This is in addition to me not having to pay for the electricity that I generate! In other words, if I generate 1,000 kWh, that is 1,000 fewer kWh that I have to pay the utility for. (This is referred to as net metering.)
RPS benchmarks gradually increase, e.g. 5% in year one, 7.5% in year two, and so on. If a utility does not meet the benchmark in a given year, they are penalized (usually fined).
For example, Colorado passed an RPS in 2004. Details can be found here [421]. Some details relevant to the discussion above are as follows:
- Investor-owned utilities must get 30% of electricity from renewable sources by 2020, with the yearly benchmarks as follows:
- 3% by 2007
- 5% from 2008 - 2010
- 12% from 2011 - 2014
- 20% from 2015 - 2019
- 30% from 2020 moving forward
- Eligible technologies include: "Geothermal Electric, Solar Thermal Electric, Solar Photovoltaics, Wind (All), Biomass, Hydroelectric, Landfill Gas, Wind (Small), Anaerobic Digestion, Fuel Cells using Renewable Fuels Recycled Energy, Coal Mine Methane (if the PUC determines it is a greenhouse gas neutral technology), Pyrolysis of Municipal Solid Waste (if the Commission determines it is a greenhouse gas neutral technology)"
- There are a lot of "multipliers," which provide extra incentives for specific types of renewable energy projects. For example, each kWh generated by a community solar project counts as 1.5 kWh toward the RPS goal.
- There are many, many more details of this single policy! I suggest taking a look at the policy to see how intricate policies like this are (and to see one reason why Energy and Sustainability Policy is a useful major!).
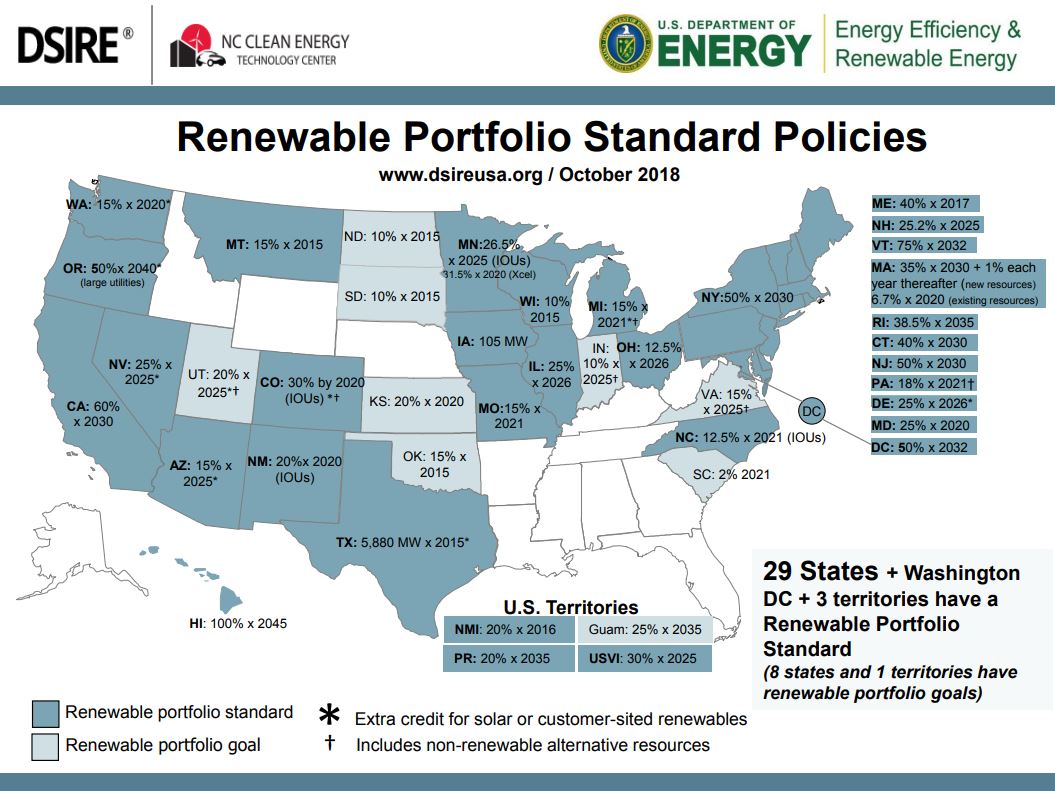 [422]
[422]
Investment and Production Tax Credits
A tax credit is just that, a credit. When an individual or business investor earns a tax credit it means that the amount of the credit will be subtracted from a future tax bill. In the United States, we have a Federal Residential Renewable Energy Tax Credit [423] which provides a tax credit covering 30% of the cost of installation. This is commonly referred to as the investment tax credit or ITC. If you put a photovoltaic system on your roof at a cost of $30,000, you earn a $9,000 tax credit. The government doesn’t mail you a check for this amount. It means you get to deduct that amount from your next tax payment. To realize this money, you will need to have paid at least $9,000 in taxes, but excess credits can "generally" be carried over to future tax years. Note that even if you were owed a refund, this tax credit can be used to increase your refund, as long as you paid at least $9,000 in federal income tax throughout the year. Eligible energy sources include "solar water heat, solar photovoltaics, geothermal heat pumps, wind (small), [and] fuel cells using renewable fuels." This is only applicable to residential customers. The percent credit will gradually decrease after 2019 and zero out at the end of 2021 (unless an updated law is passed).
Essentially the same ITC (but it is technically the Business Energy Investment Tax Credit [424]) applies to corporate owners in the following sectors "commercial, industrial, investor-owned utility, cooperative utilities, and agricultural." So basically everyone except for residential, and non-profits. The incentive levels are a little different for some of the energy sources, but solar, wind, and fuel cells earn a 30% credit in 2019, which then decreases at the same rate as the residential ITC afterward.
A production tax credit (PTC) [425] provides an incentive for each kWh of renewable electricity generated and is not based on the up-front cost of the technology. This is a federal incentive. For any source installed in 2018, the only technology that is eligible for a PTC is wind, and qualified facilities will receive about 0.8 cents ($0.008) per kWh generated, but this price is guaranteed for 10 years after the turbine begins service, so the savings can add up! For example, a 2 MW turbine with a 40% capacity factor would generate the following revenue:
- 2 MW = 2,000 kW x 8760 hrs/yr x 0.4 = 7,008,000 kWh/yr
- 7,008,000 kWh/yr x $0.008 = $56,064/yr
A 2 MW turbine is actually on the smaller end of new wind turbine sizes, so even a seemingly meager PTC can be a big deal!
Again, these are only a few of the many, many energy policies that apply to the State of Colorado! This will help provide some context for our experience there, and knowing where to access energy policy information will be helpful for your projects.
Summary and Final Tasks
Summary
By now you should be able to do the following:
- identify and describe major geographic regions and features of Colorado;
- analyze population and precipitation patterns in Colorado;
- describe the basic geology of the Rocky Mountains and the Front Range;
- explain the concept of "first in time, first in right" in terms of Colorado water policy;
- define RPS, REC, SREC, ITC, and PTC as they relate to energy policy;
- explain how renewable portfolio standards incentivize renewable energy.
Reminder - Complete all of the Lesson 10 tasks!
You have reached the end of Lesson 10! Double-check the to-do list on the Lesson 10 Overview page [426] to make sure you have completed all of the activities listed there before you begin Lesson 11.