Lesson 4: EM SC 240N Lesson 4 Review
Overview
The purpose of this lesson is for you to review key concepts from Lesson 4 (Energy In-Depth) in EM SC 240N. I strongly encourage you to at least browse through Lesson 4 [1] of EM SC 240N, though that is not required.
Learning Outcomes
By the end of this lesson, you should be able to:
- analyze global and regional carbon emissions trends;
- describe the sustainability benefits and drawbacks of various energy sources, including coal, oil, natural gas, nuclear, solar, wind, and hydroelectricity;
- explain the economic considerations of various energy sources using levelized cost of energy;
- identify reasonable estimates of remaining supplies of a variety of energy sources; and
- apply the precautionary principle to energy use.
Lesson Roadmap
| To Read | Lesson 4 Online Content | You're here! |
|---|---|---|
| To Do |
|
|
Questions?
If you have any general course questions, please post them to our HAVE A QUESTION discussion forum located under the Discussions tab in Canvas. I will check that discussion forum regularly to respond as appropriate. While you are there, feel free to post your own responses and comments if you are able to help out a classmate. If you have a question but would like to remain anonymous to the other students, email me through Canvas.
If you have something related to the material that you'd like to share, feel free to post to the Coffee Shop forum, also under the Discussions tab in Canvas.
Sustainable Energy?
Okay, now let's tie this all together. Modern society is inextricably tied to the availability of energy, as we explored in Lesson 1. We just went through more than two full lessons outlining a lot of reasons to be concerned about the sustainability of modern society, in terms of the 3E's of sustainability and otherwise. Putting these two broad concepts together begs the question: What is sustainable energy?
At the risk of sounding glib, the short answer is that there is no short answer. You will probably not be surprised to know that there is no single or even "correct" answer, that is to say, an answer that everyone can agree with. This has a lot to do with the fact that a singular definition of sustainability remains elusive, but in addition to that there is a lot of uncertainty with regards to both the long- and short-term impacts of energy use, and even how much energy (non-renewable in particular) is left to harvest. I want to be clear that the analysis that follows is not meant to answer the question once and for all, but to help frame some of the key considerations to make when answering the question. As you'll see, I've divided the analysis into sections for a number of energy sources, and subsections that provide information regarding supply, feasibility, and sustainability impacts.
Important Note to Keep in Mind
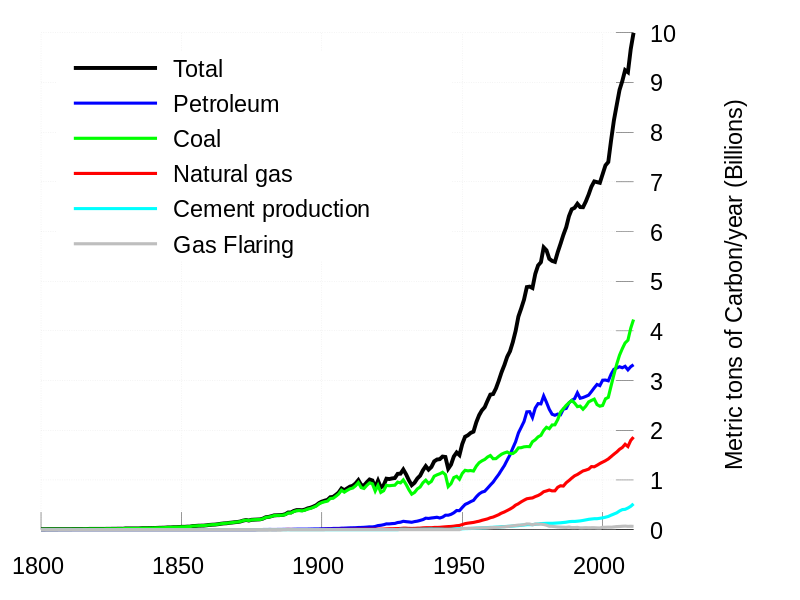
One last thing you should consider prior to reading through this lesson: No matter what mixture of energy sources/technologies that we decide to use, we cannot continue to emit CO2 like we are for long. As detailed in the previous lesson, the reality of anthropogenic climate change and its negative impacts have near universal agreement among experts. You may have read about a United Nations study in 2018 that asserted that humanity will likely need to cut global emissions by 40% - 50% by 2030 (that's really not long from now!) and would need to be 100% carbon neutral by 2050 in order to prevent the worst impacts of climate change (here is an NPR summary [2] and here is the official "Summary for Policymakers" [3] from the UN). In case you were wondering, global emissions have only increased since the start of the Industrial Revolution (see below). In addition, a report authored by 13 federal agencies [4] in the U.S. found that consequences for the U.S. will be dire if emissions are not significantly reduced. This report was particularly notable because it was released by the Trump Administration, which is no friend to climate regulation. (It was only released because it is mandated by Congress, and was immediately downplayed by the Administration, but still.)
Please keep this in mind as you read through these summaries. There is near consensus that humans must significantly reduce net emissions to near zero by mid-century, or we face a very dire future. No energy solution should be considered sustainable in the long term if it emits any carbon dioxide unless carbon reduction technologies are sufficient to offset these emissions. Right now, it is much cheaper to not emit in the first place than to capture and store them.
Coal
Supply

As you can see in the chart above from the EIA, there is a range of estimates of how much coal is available, each having a varying level of accuracy. Feel free to review the coal page [9] in EM SC 240N for an explanation of these, but the quantity that is most commonly used to indicate "how much is left" is estimated recoverable reserves. The estimated recoverable reserves [10] are the portion of the demonstrated reserve base that can be realistically recovered, taking into consideration restrictions (e.g., "property rights, land use conflicts, and physical and environmental restrictions"). Consider it a very good scientific estimate of how much we can mine in the foreseeable future. The demonstrated reserve base [11] also includes coal that could conceivably be mined commercially, but other issues (e.g., technological and political) make it unrealistic.
So how much coal is left?
- The EIA states that: "Based on U.S. coal production in 2016 of about 0.73 billion short tons, the recoverable coal reserves would last about 348 years, and recoverable reserves at producing mines would last about 23 years." This number is derived by dividing the estimated recoverable reserves (254 billion according to the most updated numbers) by the annual use (0.73 billion): 254 billion/0.73 billion = 347.9 years, rounded to 348 years.
- According to the World Coal Association, there are between 110 years and 121 years of reserves available worldwide. This is also based on estimated recoverable reserves.
Tons of Tons and Tonnes
There are many benefits to living in the United States, but having easy to understand energy units is not one of them. We use a mixture of Imperial and English units, with the system usually referred to as U.S. Customary units. Most of the rest of the world uses metric units, which are also considered SI units (Systéme international d'unités). Got all that? Good. (Here is an explanation [12] of how convoluted the non-metric units are if you are so inclined.)
Coal in the U.S. is usually measured in tons, which is a unit I'm sure you have heard of, and likely used, before. A U.S. ton is equivalent to 2,000 pounds. However, to prevent confusion with an Imperial ton, the U.S. ton should be referred to as a short ton. A long ton, on the other hand, weighs 2,240 pounds. Finally, the metric ton, which is also known as the tonne, is equivalent to 1,000 kg, or about 2204.6 lbs. To summarize:
- 1 short ton (U.S. Customary Unit) = 2,000 lbs.
- 1 metric ton (1 tonne) (metric unit)= 2,204.6 lbs.
- 1 long ton (Imperial unit) = 2240 lbs.
Credit: Encyclopaedia Britannica [13] and U.S. EIA [14]
Feasibility
The following are some facts about the feasibility of continued coal use:
- Coal has been used en masse as an energy source since near the beginning of the Industrial Revolution in the late 1700s. The infrastructure for coal mining, transportation, and use (mostly in power plants) is well-established and if it were not for the environmental and social impacts, coal would be a good source of energy.
- Coal is relatively inexpensive per ton, but coal is rapidly being replaced by natural gas and to a lesser extent, renewable energy. This is partially due to the lower emissions of natural gas, but mostly due to basic economics [15]. Energy generators want to make a profit like everyone else, and right now, natural gas and some renewables are simply less expensive, particularly in the U.S.
- Over 40% of global electricity is generated with coal, according to the World Energy Council [16]. and is the primary source of electricity for many industrializing countries like China and India and industrialized countries like the U.S. It is also used for steel production, which is an essential component of modern industrial production (buildings, bridges, etc.).
Sustainability Impacts
Now the bad news: coal has a lot of negative environmental and social impacts.
Optional Reading
- "Coal and the Environment [17]." U.S. EIA
- "Coal's Devastation [18]." The Atlantic.
- "U.S. Mine Disasters Fast Facts [19]." CNN (You can just browse the article.)
Probably the most important sustainability issue with coal is that it is so carbon-intensive. It emits about twice the carbon dioxide per Btu as natural gas and is responsible for more carbon dioxide emissions than any other energy source, and the energy sector is the largest source of carbon dioxide emissions worldwide. [21] There are other concerns, according to the EIA, including mercury pollution and acid rain. While coal companies are generally very careful to replant any vegetation destroyed by mining, it can irrevocably compromise the landscape.
One possible solution to this is carbon capture and sequestration (CCS) [22], which is a process that can capture CO2 and bury it (i.e., sequester it) in underground rock formations. Under ideal circumstances, up to 90% of the carbon dioxide will turn into solid rock and thus not pose a leakage threat. (This is usually what is referred to as "clean coal" technology, though it is notable that only the carbon emissions are reduced in "clean coal" plants. Mining waste and particulates and other emissions still make this a relatively "dirty" source of energy.) While promising, there is some indication [23] that CCS might not be as effective as once hoped. It is only beginning to be demonstrated on a commercial scale [24], and some plants have had major issues [25], so the jury's still out.

In short, coal is a reliable energy source and is generally a relatively cheap source of energy as long as externalities are not included. Coal does provide good-paying blue collar jobs, and the loss of coal industries can be devastating to local towns. If externalities were to be included, the price would undoubtedly increase, especially if the social cost of carbon were included. CCS provides some hope for reducing the carbon dioxide emissions of coal use, but other significant sustainability problems will persist.
Natural Gas
Unless you've been hiding under a rock for at least the past 10 years, you have heard about natural gas in the news. If you have heard about it, it was most likely in relation to hydraulic fracturing, or simply "fracking." This is a VERY controversial topic at the moment, and with good reason (as we'll see below). Because of this, you have to be careful where you get your information (good thing you are taking this course!). Our old friend Hank provides a pretty clear and unbiased description of fracking in the video below.
In case you hadn't heard, we humans use a lot of oil and gas these days. Just a couple of sorts of hydrocarbons, organic compounds made out of hydrogen-carbon atoms. They are a magnificent source of stored energy running a car engine or a fighter jet or a weed whacker or a power plant. Hydrocarbons are pretty useful. A lot of the world's precious petroleum comes from the Middle East, but that puts a few of the world's countries in the position of having all of the useful oil and gas. So, of course, the rest of us are interested in hunting down some domestic sources. Actually turns out the Middle East doesn't have the hydrocarbon market cornered, they just have a lot more liquid petroleum than most places. But a lot of the rest of the world has reserves of natural gas. Gaseous hydrocarbons like methane, propane, and butane.
Usually found deep underground in giant beds of shale, rock that was formed from the floors of ancient oceans, natural gas is likely how your water gets heated and maybe even your air. Burning it for electricity is cleaner and more efficient than coal and unlike oil when it spills, it just vents into the atmosphere instead of spreading out in huge slicks over the ocean. The problem with natural gas has always been how do we get at it? We know it's there, but we can't get it!
Since the forties, oil companies have known that breaking up the rocks in deep underground formations can increase the productivity of wells. See it's not just one big pocket of black gold down there; oil and gas can occur in thousands of little pockets, and by fracturing the rocks around these pockets the gas is released and can be collected. Usually, this fracturing involves pumping millions of gallons of chemically treated water into deep shale formations. We're talking a mile or more underground at extremely high pressures. This fluid cracks the shale or widens existing cracks freeing the hydrocarbons and making a path for them to flow toward the well. So that's how it's done basically, and some people are so unbelievably pumped about this technology they're building little graven images to it, going to natural gas wells on Sunday mornings.
But then, some scientists are like not so fast you guys, cuz fracking isn't all butterflies and cupcakes. For starters, it uses a whole lot of water. It takes up to seven million gallons to frack a single well, and at least 30 percent of that water is trapped in the shale thousands of feet below the groundwater aquifer so it's gone for good. Fracking fluid isn't just water, it's sand which helps keep the cracks open once they form but also chemical additives which can vary from well too well and are often confidential. These additives do things like thicken the water to help suspend the sand or prevent mineral buildup in the pipe and some are things might find under your kitchen sink. Others like benzene in methanol are pretty toxic.
Some concerns about the contents of these fracking fluids not to mention radium, corrosive salts, and other stuff that comes back up from a mile underground, have led places like Pennsylvania to prohibit fracking outfits from sending their wastewater to local treatment plants, and although fracking when done correctly shouldn't contaminate drinking water aquifers, that doesn't mean it hasn't happened.
Subterranean systems are mysterious, and it's impossible to tell how interconnected the shale deposits might be with groundwater. If the fracturing is too effective, groundwater aquifers and shale deposits containing newly injected fracking fluid can mix. Although it's hard to say how many cases of contamination have been caused by improperly installed or maintained fracking wells, improperly bored or sealed wells have contaminated drinking water in several sites in the US resulting in energy companies being fined for polluting water supplies. While natural gas is a far cleaner fuel than coal, the fact that it doesn't spill and instead vents to the atmosphere is also problematic for climate change. Methane is a potent greenhouse gas and if it isn't burned as it vents from fracking wells, it can contribute even more to global warming.
And finally earthquakes. It's crazy, but some US states like Oklahoma, Texas, and Colorado have been experiencing a significant rise in seismic activity, which seems to be corresponding to the fracking boom. Some studies are suggesting that the disposal of wastewater back into used wells are causing the pressurized water to seep through cracks onto old fault lines causing many more earthquakes than normal even in places where seismic activity is rare.
So fracking is creating a new oil and gas boom in the US, sure, but it might not be all it's fracked up to be. Sorry, we didn't make any Battlestar Galactica jokes. So, if you want you could put those down in the comments. If you have any questions or comments or just want to argue about it, the comments are there for that as well. There are also sources. If you'd like to check those out, that would be good. And if you want to keep getting smarter with us here at Sci Show, you can go to youtube.com/scishow and subscribe.
One popular misconception is that fracking has only been around since the early 2000s or so. As Hank explains, this is simply not the case. Hydraulic fracturing has been known to increase the output of gas (and oil!) wells since the mid-1900s. The main innovation that has caused the recent fracking boom is directional drilling (sometimes called horizontal drilling). Until relatively recently, oil and gas wells were generally drilled in a straight line. But directional drilling allows operators to change the direction of the drill bits so that they can trace the path of underground rock layers (which are rarely straight up and down). This allows for significantly more gas output per well and is what mainly facilitated the fracking boom.

Supply
Like coal, it is impossible to determine the amount of natural gas reserves available in the U.S. or worldwide. Most of the data you will see are based on "proved reserves," which the EIA defines as "estimated volumes of hydrocarbon resources that analysis of geologic and engineering data demonstrates with reasonable certainty are recoverable under existing economic and operating conditions." (Credit: US EIA [27]). Basically, proved reserves are a reasonable estimate of the amount of natural gas that is believed to be in the ground that can be recovered given current technology, and for a profit.
Because the proved reserves are based partially on technology, as technology has advanced - especially with fracking - the proved reserves have generally increased. This is clear in the chart below. The upward trend in available gas would seem odd to the uninitiated since it is a finite resource. But it's important to keep in mind that the chart reflects proved reserves, not the actual amount in the ground.

I'm sure you noticed the dramatic drop in proved reserves from 2011 to 2012 and 2014 to 2015. 2015 has a somewhat simple explanation. The price of natural gas dropped significantly from 2014 to 2015, which "(caused) operators to revise their reserves downward", according to the EIA [30].

In the chart above, shale gas refers to gas that is locked up in the pores of shale in underground layers, as described in the fracking video above. Tight gas refers to gas that is locked up in other formations like low-permeability sandstone. For a full explanation of the terms, see this EIA website [32].
So how much gas do we have left? The EIA provides the following analysis and explanation [33]:
At the rate of U.S. natural gas consumption in 2016 of about 27.5 Tcf per year, the United States has enough natural gas to last about 90 years. The actual number of years will depend on the amount of natural gas consumed each year, natural gas imports and exports, and additions to natural gas reserves.
Optional Readings
- "How Much Natural Gas is Left? [28] US EIA.
- "Just How Long Will U.S. Gas Supplies Last? [34]" Peter Kelly-Detwiler, Forbes Magazine.
Feasibility and Sustainability Issues
Like coal, the natural gas infrastructure is well-established, including wells, pipelines, and power plants. As you saw previously, natural gas is relatively cheap. The recent boom in natural gas production has provided a lot of high-paying relatively low-skilled jobs and has generated millions of dollars in royalties for landowners. Increased use and cheaper (up front) cost of natural gas has allowed the widespread replacement of coal-fired power plants, which has resulted in natural gas increasing its share of U.S. electricity production from 18% in 2005 to 32% in 2015. During the same period, coal's share has dropped from 51% to 34%. This is a major change in just over a decade!

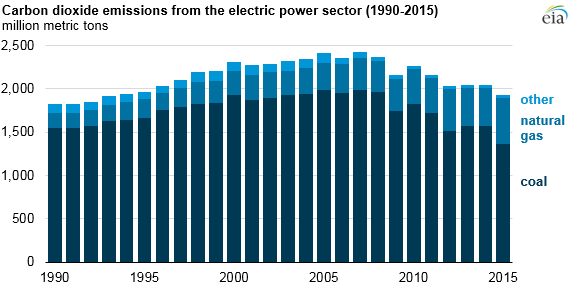
One major benefit of this is that it has contributed to reduced CO2 emissions that come from electricity generation in the U.S. These emissions are at their lowest level since 1993. The EIA explains that: "A shift in the electricity generation mix, with generation from natural gas and renewables displacing coal-fired power, drove the reductions in (CO2) emissions." This is a major benefit of natural gas. As indicated previously, burning natural gas results in approximately half of the emissions from an equal amount of coal energy.
But this is not the whole story regarding emissions. Remember that while natural gas emits about half of the CO2 as an equivalent amount of coal when burned, natural gas itself is about 30 times as powerful as carbon dioxide in terms of greenhouse effect impact over a 100 year period and about 80 times as powerful over a 20 year period. One result of this is that methane leaks throughout the natural gas supply chain (from the well to the end user) counteract some of the positive impacts of natural gas being a relatively clean-burning fuel.
Some other considerations regarding natural gas, mostly from this article by John Wihbey [38] include:
- Regarding fracking and contamination of water: Widespread water contamination was not found, but there are verified cases of water supplies being tainted.
- Up to 5-7 million gallons of water are used per well, much of which is unrecoverable; the water that is recovered is often contaminated with hazardous chemicals and substances;
- The disposal of fracking wastewater by injecting into the underground formations, including oil wells, is almost without a doubt causing earthquakes. Usually, this is not serious, but some fracking operations have been shut down due to earthquake risk.
- It is certain that there are fugitive emissions coming from oil and gas operations, but how much is up for debate. It does appear that most of the total leakage is from a few major emitters, but overall it can be difficult to monitor all leaks because of the huge number of wells in the U.S.
- Natural gas-fired power plants can also be energy to supplement renewable energy like wind [39]. Natural gas-fired power plants can increase and decrease output quickly, much more so than coal or nuclear. So, if energy generation from solar or wind drops suddenly, natural gas can make up the difference through increased output.
- Whenever batteries or other forms of electricity storage become economic, the above-listed benefit of natural gas will no longer be relevant.
In short, natural gas is really a mixed bag of sustainability implications, especially with regards to hydraulic fracturing. The primary benefits from a sustainability perspective are that there is no doubt that it has reduced CO2 emissions, but to what extent natural gas leaks have counteracted that is in question; and also that it has created an economic boom, at least in the short term. There are many downsides, particularly with regards to environmental damage (water, air, land), but also with regards to quality of life for some people near wells.
Oil
Supply and Feasibility
In terms of feasibility, oil is so ingrained in modern society and its infrastructure is so well-established that there is no risk of not being able to integrate oil supplies into the economy and society. However, oil supply projections have a very interesting history, and like the price, projections of supply have been volatile. First of all, like natural gas, the calculation of proved reserves is subject to limitations of using current technology, economics, and known reserves, each of which can change from year to year. Like natural gas, for oil, proved reserves refer to "those quantities of petroleum which, by analysis of geological and engineering data, can be estimated with a high degree of confidence to be commercially recoverable from a given date forward, from known reservoirs and under current economic conditions" (Credit: CIA Factbook [40]). The result (again, like natural gas) is that even though oil use is increasing globally every year, there are paradoxically more proved reserves. Please note that the chart below represents global proved reserves.

How is it possible that we can continue to use more oil each year, yet the estimated remaining supplies keep increasing? The primary reason is improving technology. We have so far been able to exploit new resources as the market demands more oil. The most recent increase in proved reserves, especially in the U.S., is from shale oil that can be extracted through hydraulic fracturing (aka fracking). There has been an oil boom that has come in lock-step with the recent natural gas boom, all due to fracking. Access to additional "unconventional" reserves via tar sands in Canada has also contributed to the increase in proved reserves and supply.
Suggested Reading
Dr. James Conca provides a very good explanation of the somewhat complex workings of the global oil market in the article below. As you will see, the price of oil and the economic feasibility of technology is not as simple as supply and demand. He also throws in a nice lesson on how fossil fuels are formed for good measure. Also, if, like me, you have found yourself wondering whether oil deposits are more like a jelly donut or tiramisu, he'll help you out with that as well.
- "No Peak Oil For America Or The World [43]" James Conca, Forbes Magazine
There are a few important things to point out from this article:
- Dr. Conca makes it clear that despite dire warnings of "peak oil" since the 1970s: "For every barrel of oil consumed over the past 35 years, two new barrels have been discovered." In other words, technology has increased the available oil despite the fact that humans have been using it at an increasing rate for over a century.
- For the past 15 or so years, fracking is the main reason that proved reserves have increased.
- Dr. Conca notes that: "Unfortunately, the environmental cost of unconventionals is even greater than for conventional sources." This is important to keep in mind, as fracked oil has the same negative impacts as fracked natural gas.
So, how much oil is left, and how long will it last?
- In 2017, BP released its well-regarded annual Statistical Review of World Energy [44] and determined that there is enough oil to satisfy global needs for just under 51 years [44], but only if we continue on our current trajectory. This is not a very long time if you think about how important oil is to society.
- Also, keep in mind that as we approach this point of exhaustion, the price of oil - and all of the goods that depend on it, which is basically, you know, everything - will increase.
Sustainability Issues
There are many sustainability considerations when it comes to oil. The following are some of the sustainability benefits:
- Oil is extremely important to the functioning of modern society. A little under 40% of all of the energy used in the U.S. is from oil, and in addition to that, oil is used in the manufacture of common things like plastic, car tires, and asphalt.
- Around 150,000 people [45] in the U.S. work in the oil and gas extraction industry, and possibly millions more [46] are "supported" by oil and gas.
- A lot of this helps provide some quality of life improvements, and even some equity advantages (e.g., cheaper food). But it does come at the expense of other sustainability aspects, particularly the environment.
However, there are of course drawbacks, including the following:
- One of the problems with not knowing how much oil is left is that it makes it easier to justify not planning for its eventual unavailability. When oil shocks happen, they have a severe negative impact on the economy. If we knew exactly how much oil we had left, society would be able to prepare for its demise. But because we do not know this with certainty, very little has been done to prepare for it. This is a sustainability issue for many reasons. Primary among them is that if we do not reduce our dependence on oil, there will be a lot of suffering when the next oil shock happens.
- Recall from the chart on the Sustainability of Coal page from this lesson that oil is second only to coal in global carbon emissions. There is no practical way to prevent the emission of carbon dioxide when an oil product like gas is burned.
- There are a number of other emissions [47] associated with the burning of oil products like diesel and gasoline, including nitrogen oxides and volatile organic compounds (which cause lung damage), sulfur dioxide (acid rain and some health impacts), particulate matter (asthma, bronchitis, visual pollution, possibly lung cancer), and others (Credit: U.S. EIA: Oil and the Environment [47]).
- All of the issues associated with fracking, in particular, the heavy use of water (see the Natural Gas page), are the same for shale oil.
- Another unconventional source of oil is Canada's oil sands (sometimes referred to as tar sands). 97% of Canada's known reserves [48] come from oil sands. Oil sand extraction is particularly damaging to the natural environment and has a very low EROI. Canada is the U.S.'s largest supplier of foreign oil (over 4 million barrels per day [49] in 2017), almost all of which is from oil sands.
- Oil is often associated with the so-called "resource curse [50]" when it is controlled by corrupt governments. This problem has historically been especially acute in African countries like Nigeria [51], but oil revenues have propped up many undemocratic regimes elsewhere, e.g., Middle Eastern Countries (Iran, Iraq) and South American Countries (like Venezuela).
Optional Reading
- "Equatorial Guinea Country Profile - Overview [52]." BBC News. When reading this, please keep in mind that Equatorial Guinea was a Portuguese, then Spanish colony for over 500 years prior to independence in 1968. It was used as a source of slaves by the Spanish for the last 200 years or so of that time. This level of exploitation is probably the most important factor in why countries like Equatorial Guinea are subjected to the "resource curse." The exploitation prevented them from developing the necessary political and economic infrastructure and personal freedom that would provide a buffer against exploitation by dictators.
- "The Dark Side of the Shale Bust [53]." Nick Cunningham, oilprice.com.
- "5 Years After BP Oil Spill, Effects Linger And Recovery Is Slow [54]." Debbie Elliott, NPR.
Oil is an extremely useful resource, and it is a very important aspect of the modern economy, and by extension, society. Considering that current projections assert that we only have about 50 years of supplies left, we should probably try to maintain our resources for as long as possible, and avoid an abrupt collapse. But we also should be conscious of the sustainability impacts of its extraction and use.
Nuclear
Nuclear energy has been a hot-button issue for a very long time, both domestically and internationally. It provides a significant portion of the global electricity supply, as you will see in the image below.

Supply
Nuclear energy is non-renewable. Uranium is by far the most-used nuclear fuel. As with other non-renewable fuels, all of the uranium that is on earth now is all that we will ever have, and estimates can be made of the remaining recoverable resources. At current rates of consumption, we will not run out of uranium any time soon. But this depends very highly on a number of variables, including keeping consumption at current levels, technology not advancing, estimates of reserves changing, and so forth.
The World Nuclear Association (WNA), an industry association, provides a very thorough explanation of possible complicating factors [57], but they state that at current rates of consumption, the world has enough reserves to last about 90 years. The Nuclear Energy Agency (NEA [58]), like the WNA, [58]is effectively an industry group and has a wealth of expertise at its disposal. They indicate that as of 2009, the world had about a 100 year supply of uranium. So it appears that as long as the rate of use does not increase there is a little less than 100 years of nuclear fuel supplies left.
Feasibility
According to the World Nuclear Association, there are 454 operable reactors worldwide with a further 54 under construction [59]. The technology is well known by now, and despite the extreme danger posed by nuclear meltdowns, there have been very few major incidents. You are probably familiar with the Fukushima Daichi meltdown that happened in 2011, and perhaps heard of Chernobyl in Ukraine in 1986 (still the worst nuclear disaster to date), and maybe even Three Mile Island in the U.S. in 1978. Here is a partial list of nuclear accidents [60] in history from the Union of Concerned Scientists (UCS). But putting aside this risk at the moment, nuclear energy has shown itself to be a viable source of electricity, and likely will continue to be used for the foreseeable future. Among other things, nuclear power plants generally have a useful lifetime of around 40-60 years, so we are "locked in" until mid-century at least.
Sustainability Issues
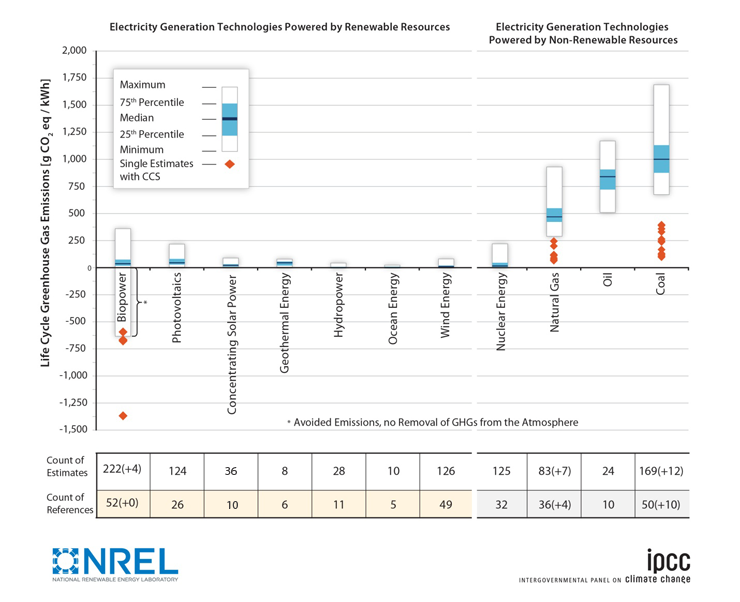
Nuclear energy is a mixed bag in terms of the question of sustainability. You may recall that nuclear is considered a carbon-free source, and since it is a proven and reliable source, it is seen by many as a good option. Note that despite being considered "carbon-free," nuclear energy results in some lifecycle emissions because of the materials used in mining, building the power plant, and so forth. (Lifecycle emissions are all the emissions generated by all processes required to make an energy source, including things like mining of materials, manufacturing of equipment, and operating equipment.) But according to the National Renewable Energy Laboratory (NREL) [61] it has approximately the same lifecycle emissions as some renewable energy sources.

Some other sustainability considerations include:
- Nuclear energy is a very reliable source of electricity, and power plants can operate at near full capacity consistently.
- However, nuclear energy is very expensive in terms of direct costs.
- Since they are so expensive, there is an incentive to keep a plant online for as long as possible to recoup costs, thus people are effectively "locked in" once a plant is built.
- The waste from nuclear reactors can remain dangerous for thousands of years [62], which can result in large externalities.
- There is, of course, the risk of another disaster which, however rare the possibility, could be catastrophic.
- There are also some issues with the equity impacts of uranium, particularly in terms of mining [63]. There is not an easy answer here, as there are reasonable and strong pros and cons.
- Regarding the cost of nuclear: The high up-front cost makes nuclear power one of the most expensive types of electricity available. For a technical discussion of this, feel free to read through this description of the levelized cost of electricity [64] from the EIA, which indicates that over the lifetime of the energy source, nuclear is more expensive than geothermal, onshore wind, solar, hydroelectric, and most types of natural gas plants.
Optional Reading
The first article below is a good example of why it pays to pay attention to citations and be well informed on a topic, in regards to finding good information sources. The article is on a website that I've never heard of before, so at first, I was suspicious of the content. However, they provide legitimate sources for the information presented, and I have enough prior knowledge to know that the arguments they put forth are legitimate. Overall, it's a good summary of some of the pros and cons of nuclear energy.
- "Pros and Cons of Nuclear Energy [65]." UnderstandSolar.com
- "Unable to Compete on Price, Nuclear Power on the Decline in the U.S. [66]" Brian Mann, PRI.
- "Nuclear, Carbon Free but Not of Unease [67]." Henry Fountain, New York Times.
- "Nuclear Power Prevents More Deaths Than It Causes [68]." Mark Schrope, Chemical, and Engineering News.
Overall, nuclear is reliable and almost carbon-free but is expensive and non-renewable. Also, because power plants are so expensive to build, once they are built they are generally used for as long as possible, as long as they are still economic. When accidents happen, they can be catastrophic, but they are extremely rare. However, the waste product from nuclear power plants is dangerous for thousands of years, and right now we have no way of safely disposing of it - it is kept in storage, usually at the power plants themselves.
Renewables
Supply
The supply aspect is very straightforward for wind and solar: they are inexhaustible! As stated in Lesson 1, both of them get their energy from the sun; and if the sun stops shining, we have more important issues to deal with than not having a source of renewable electricity. The amount of solar energy that hits the earth in one hour is enough to power the world for an entire year (this is a commonly held fact, but here is one source [69]). There is no shortage of solar energy!
As for hydroelectric, though it also gets its energy from the sun, it is limited due to its dependence on the availability of flowing water. As of 2014, about 17% of the world's electricity came from hydroelectricity. According to the International Energy Agency [70], there is about 5 times as much technical potential for hydroelectric worldwide as is currently generated today. We certainly would not want to exploit all of it, given some of the environmental impacts of large hydroelectric facilities (see below), but this number does provide a frame of reference.
Feasibility
The feasibility is a mixed bag.
- An oft-cited paper by Mark Jacobsen and Mark Delucchi of Stanford University [71]showed that through wind, water (hydroelectricity), and solar, all of the world's energy needs could be met (note that this is all energy, not just electricity) by 2030, or in a less aggressive scenario, 2050. According to their research, this could be done using existing technologies and would require the use of about 1% of all dry land on earth. They assert that the barriers to accomplishing this are "social and political, not technological and economic." There are a lot of other details to this study - way too many to get into here.
- There is no shortage of critiques to this study, including this critique from Ted Trainer of the University of New South Wales [72], who is an advocate of renewable energy. He cites possible underestimates in their cost calculation, underestimates of the amount of energy required to provide a high quality of life, among other things. If nothing else, this plan would require an alteration to the global energy infrastructure at a pace and scale that has never been seen before. It is likely possible with enough political and social will, but it would take a lot of both.
- Irrespective of these studies, it is universally acknowledged that there is more than enough renewable energy available to provide all of humanity's needs. For starters, recall from the solar page that all of humanity's energy needs are supplied by only one hour of sunlight.
One sign that bodes well for renewables is that the cost has come down significantly in recent years.
- It appears that in the U.S. the cost of generating electricity from onshore wind and solar- assuming they are sited and installed properly - is cost-competitive with fossil fuels, even without incentives.
- Residential-scale solar is still relatively expensive, but utility-scale (large arrays) are cost-competitive today. Utility-scale refers to large arrays, usually hundreds or thousands of panels in size.
This is all based on the levelized cost of electricity (LCOE), which was noted in the nuclear lesson. The LCOE is the amount it costs to generate each unit of energy (usually measured in $/megawatt-hour) on average over the lifetime of an electricity source. To calculate the LCOE, you take the total lifecycle costs and divide by the total electricity output over the lifetime of the source. This is of course not including externalities, which would likely make renewable energy cheaper right now, especially if the social cost of carbon were to be considered. See the chart below for details. Note that information for utility-scale vs. residential-scale solar was not made available for the U.S., but refer to this chart from Lazard [73] for global data, which also includes residential and utility-scale solar.
| Plant Type | Total System LCOE ($/MWh) |
|---|---|
| conventional combined cycle natural gas | 48.3 |
| advanced combined cycle natural gas | 48.1 |
| advanced combustion turbine natural gas | 79.5 |
| advanced nuclear | 90.1 |
| geothermal | 43.1 |
| biomass | 102.2 |
| onshore wind | 48.0 |
| offshore wind | 124.6 |
| solar PV | 59.1 |
| hydroelectric | 73.9 |
Optional Reading
- "Wind and Solar Are Our Cheapest Electricity Generation Sources. Now, What Do We Do? [75]" Michael O'Boyle, Greentech Media. You only need to read until you hit the "How can this impact overall system costs?" subheading. This article is from 2017, but the cost of most renewables has only gotten cheaper since then, as you'll see if you read the optional article below.
- "Renewable Electricity Levelized Cost Of Energy Already Cheaper Than Fossil Fuels, And Prices Keep Plunging [76]." Energy Innovation.
The bottom line in terms of cost is that right now, well-sited wind and utility-scale solar are the cheapest form of electricity available, other than only the least expensive natural gas power plants. (Please note that energy efficiency is cheaper than all energy sources!) Other renewable sources such as small hydroelectric, biomass, geothermal, solar thermal, and commercial-scale solar are very cost-competitive with coal and natural gas, and generally less expensive than nuclear. All of this does NOT include subsidies, by the way!
Sustainability Issues
All three of these sources are carbon-free, so they are ideal with regards to anthropogenic climate change. Even after consideration of the embodied energy of these sources, the lifecycle carbon footprint is minimal for renewables, as you can see in the chart below. In terms of climate change concern, there is really no debate: these renewables are great choices.
However, there are some other considerations to make in terms of sustainability. First, large hydroelectric facilities are not very environmentally friendly. Depending on the location, there can be problems with flooding of habitats and even towns, compromising fish migration, altering stream content and temperature, impacting scenic areas, and other considerations. The articles below provide some insight into some of these potential problems. Note also that not all hydro has the same problems - by using different types of hydroelectric facilities such as run-of-river and micro-hydro [78], environmental and social impacts can be minimized.
Optional Reading
- "Hydropower Explained: Hydropower and the Environment [79]." U.S. EIA.
- "China Admits Problems with Three Gorges Dam [80]." Michael Wines, New York Times.
- "Run-of-river hydro, Indonesia [81]." (Video).
- "Solar Power Explained: Solar Energy and the Environment [82]." U.S. EIA.
- "Environmental Impacts of Wind Power [83]." Union of Concerned Scientists.
In terms of social equity, there are a few important considerations to make. First of all, do people have access to energy, and can they afford it? This is a tricky question to answer, as it depends on a lot of factors, many of which were indicated above. Some equity and other considerations include:
- Solar panels used to be prohibitively expensive, but new business models are making them much more affordable, even effectively free to the customer.
- Wind and hydro can usually be purchased through utilities at the same or lower rates than fossil fuels.
- One very important equity consideration is that fossil fuel power plants are often sited near low-income areas of the country and world, and thus the negative health impacts are unevenly distributed, with the least powerful bearing the brunt. (The term "environmental justice" hopefully comes to mind for you right about now!) Add to the previous point that the environmental destruction from coal mining is especially unevenly distributed.
- Wind turbines can be a nuisance, as indicated in the article above, but is relatively minor compared to power plants.
- Solar is usually unobtrusive, though some people do not like "the look" of the panels.
- Large hydro can have a major social cost, as you may have seen in the article above. Flooding of houses and even whole towns can result from dams being built, though this is more the exception than the rule in industrialized countries. As always, these impacts are disproportionately felt by low income and marginalized people.
One of the benefits of conventional energy generation is that the infrastructure is largely set up, at least in industrialized countries. In the U.S., for over 100 years, we have built an energy infrastructure based on large power plants and fossil-fuel based vehicles. This gives conventional energy sources an advantage in terms of providing access. That said, wind, hydro, and solar can all utilize the existing infrastructure. Hydroelectric dams provide the same service as fossil-fuel power plants, but usually on a slightly smaller scale, so they are a good fit. They also provide a very consistent stream of electricity as long as no droughts are occurring, and they can increase and decrease production pretty rapidly, unlike solar and wind.
Probably the biggest current problem with solar and wind is that they are intermittent - the sun does not always shine, and the wind does not always blow. This is a major issue because we currently do not have the storage capabilities to provide the energy on command. One common problem with wind and solar are that they are often highest in areas with low population densities. In the U.S., for example, the greatest on-shore wind resources are in the Great Plains in the Midwest, where the population density is very low.
 [84]
[84]
One of the benefits of solar is that as long as there is not too much shading, many households can satisfy their energy needs using existing rooftop spaces. However, not every location is ideal for solar. The intermittency of wind and solar is also a major problem, as noted above. This will change if/as battery technology becomes more accessible, and as the grid is upgraded.
Summary
Overall, the biggest advantages of renewable energy sources are:
- they are inexhaustible (hydro has limits though), carbon-free, and have very minimal environmental impacts (notwithstanding large hydro);
- they also tend to be more democratic, in that many of them are suitable for scaling down to a personal level. This is not possible with current technology for fossil fuel-based electricity generation;
- most of them are also cheaper than almost all forms of non-renewable energy, as long as they are properly sited.
The main disadvantages of solar, wind, and hydro are:
- they are intermittent, and so without storage cannot be relied upon to deliver energy when needed;
- they are not able to be deployed in every location, e.g.; shaded areas for solar, calm areas for wind, and dry areas for hydro;
- large-scale hydro has a lot of negative environmental impacts, and there are some environmental and social problems with wind.
The last thing I'd like to note is that the most sustainable energy is the energy that you don't use. Remember that energy efficiency is sometimes called the "fifth fuel?" That is very much applicable to these considerations. Also, as noted above, energy efficiency has been found to have a lower LCOE than any other energy source! [86] The more we can reduce our energy use while getting the same benefits from the energy service, the better off we will be.
Summary and Final Tasks
Summary
By now you should be able to:
- analyze global and regional carbon emissions trends;
- describe the sustainability benefits and drawbacks of various energy sources, including coal, oil, natural gas, nuclear, solar, wind, and hydroelectricity;
- explain the economic considerations of various energy sources using levelized cost of energy;
- identify reasonable estimates of remaining supplies of a variety of energy sources;
- apply the precautionary principle to energy use.
Reminder - Complete all of the Lesson 4 tasks!
You have reached the end of Lesson 4! Double-check the to-do list on the Lesson 4 Overview page [87] to make sure you have completed all of the activities listed there before you begin Lesson 5.