Course Outline
Module 1 - Geographic Perspectives
Introduction
Introduction
Did you complete the Course Orientation?
Before you begin this course, make sure you have completed the Course Orientation.
About Module 1
Here you will be introduced to fundamental geographic topics including scale, cartography and GIS and human-environment interactions. These topics are introduced using case studies and specific examples. The central objective of this lesson is for you to understand key concepts in geography and how they apply to this course. You will also be introduced to some key concepts that will be returned to throughout the course.
What will we learn in Module 1?
By the end of Module 1, you should be able to:
- examine several major themes of geography, particularly scale, cartography and GIS, and human-environment interactions;
- consider how the links between spatial and temporal scales help explain decision-making and environmental change;
- understand why social science is important to the study of the natural environment;
- be introduced to topics that will be discussed in greater detail later in the course.
What is due for Module 1?
Module 1 will take us one week to complete. See the Syllabus page in Canvas for specific due dates.
| Requirement | Location | Submitting Your Work |
|---|---|---|
| Reading Assignment: State Department Office of the Geographer | Introduction to Geography page | No submission |
| Citation Training (Part 1) Assignment | End of Module 1 | Complete Check You Knowledge quiz |
Questions?
If you have any questions, please post them to our Course Q & A discussion forum in Canvas. I will check that discussion forum often to respond. While you are there, feel free to post your own responses if you, too, are able to help out a classmate. If you have a more specific concern, please send me a message through Inbox in Canvas.
Introduction to Geography
Introduction to Geography
You are now in the process of doing something that few other Americans have done: taking a college-level geography course. In contrast with other countries such as the United Kingdom, France, and India, most American colleges and universities do not even have a geography department. Because of this, you might not be familiar with geography as an advanced discipline of study and professional activity. This module is designed to introduce you to the field of geography as it is practiced at Penn State and beyond.
The Greeks were the first to use the term geography, which literally translates as “to describe the Earth.”
The geographer's task is nothing less than to understand and explain the entire world as we live in it. The geographer focuses on what's happening on Earth’s surface. If it’s below the surface, it’s more likely to be studied in the Geosciences Department. If it’s above the surface, it’s more likely to be studied in the Meteorology Department. But there is a lot of overlap among these three fields of study, which is why they are grouped together in Penn State’s College of Earth and Mineral Sciences, along with the Energy and Mineral Engineering Department and the Materials Science and Engineering Department.
The Penn State Geography Department (and many others) divides geography into four sub-disciplines:
- Human Geography: how human societies are arranged and interact around the world, including economies, governments, and cultures;
- Physical Geography: how natural and geophysical phenomena are arranged and interact around the world, including ecosystems, mountain ranges, bodies of water, and climates;
- Environment & Society Geography: interactions between humans and the natural and geophysical world, including human impacts on the environment and environmental impacts on humanity;
- Geographic Information Sciences: techniques for acquiring, analyzing and displaying geographic information, including satellites, software programs, and maps.
Geography 30 is Penn State's introductory course for environment & society geography. It is offered to students at both the University Park campus and the World Campus.
At University Park, Geography 30N is a core course for the undergraduate programs in Geography. Introductory courses for the other subdisciplines are Geog 010 (physical), 020 (human), and 160 (GISciences). Geog 040 is World Regional Geography, which presents both the human and physical geography of every region of the world.
At World Campus, Geography 30N is a major requirement for both the Bachelor of Arts and Bachelor of Science degrees in Energy and Sustainability Policy. For both University Park and World Campus, Penn State also offers many activities and resources on sustainability through the Center for Sustainability and the Institutes of Energy and the Environment.
This broad focus makes geography a challenging and exciting discipline. Geography intersects with many other disciplines across the natural and social sciences, engineering, and the humanities. For example, biogeography intersects with biology; political geography intersects with political science.
One hallmark of geography is place-based inquiry. Geographers recognize that natural and social conditions are often unique to a specific region. In order to better understand a place's unique or unusual characteristics, geographers often perform field research, meaning that they go to a place and observe the natural and social conditions in that place. The place need not be remote. You can conduct field research simply by observing the place that you live in.
Geography today is a vibrant academic and professional discipline.
Geographers today work in a wide range of settings, including research, government, technology companies, and non-profits. Some specific examples can be found on the Geography Department's What Geographers Do page. Please scan this page to get a sense of the breadth of options available to geographers.
Reading Assignment: "MapQuest: Office of the Geographer Makes Information Visual"
The United States Department of State is responsible for managing international relations. It contains an Office of the Geographer that provides a range of geographic services in support of the State Department's international relations mission. To learn more about what the Office of the Geographer does, please read the article "MapQuest: Office of the Geographer Makes Information Visual." The article is on pages 30-33 of the March 2009 State Magazine.
As you read this, consider the following questions. What does the Office of the Geographer do? What types of geography does it use? What skill sets must its employees have? What international relations issues and incidents has it been involved in? Why is geography important to international relations?
Scale
Scale
One of the central concepts in geography is scale. In very rough terms, scale refers to how big or small something is. That "something" could be an event, a process, or some other phenomenon. In geography, we often focus on spatial scale. Spatial scale is the extent of an area at which a phenomenon or a process occurs. For example, water pollution can occur at a small scale, such as a small creek, or at a large scale, such as the Chesapeake Bay. Spatial scale also refers to the area or spatial extent at which data about a phenomenon are aggregated to be analyzed and understood. For example, while there are differences in levels of pollution in different areas of the Chesapeake Bay, one may choose to aggregate water quality measurements to make a general statement about pollution in the bay as a whole.
Geographers not only are interested in the patterns of physical or social processes on the Earth at a given level of spatial organization (e.g., local, regional, or global), but they also want to know the interactions and feedbacks across different spatial scales. Geographers sometimes also discuss temporal scale, which is the duration or time length of a thing or process. Some examples can help us understand scale. Consider air pollution. This often exists at the scale of a city or metropolitan area. The city will have cars, factories, power plants, and other things that cause air pollution, and the air pollution will affect people who live in the city and breathe the air there. People elsewhere may not be significantly affected. (Note that sometimes the wind sends air pollution further away.) In contrast, climate change largely exists at the global scale. (We'll discuss climate change in greater detail later in the course.) This is because climate is a process that covers the whole planet. When we change the climate somewhere, we change it everywhere. Scale matters in understanding the interactions between humans and the environment.
A nice depiction of scale can be found in the following video (9:01):
Narrator: The picnic near the Lakeside in Chicago is the start of a lazy afternoon, early one October. We begin with a scene one meter wide, which we view from just one meter away. Now every 10 seconds, we will look from 10 times farther away, and our field of view will be 10 times wider. This square is 10 meters wide. And in 10 seconds, the next square will be 10 times as wide. Our picture will center on the picnickers, even after they've been lost to sight.
100 meters wide, a distance a man can run in 10 seconds. Cars crowd the highway. Powerboats lie at their docks. The colorful bleachers are Soldier Field. This square is a kilometer wide, 1,000 meters. The distance a racing car can travel in 10 seconds. We see the great city on the lake shore. 10 to the fourth meters, 10 kilometers, the distance a supersonic airplane can travel in 10 seconds.
We see first the rounded end of Lake Michigan, then the whole great lake. 10 to the fifth meters, the distance an orbiting satellite covers in 10 seconds. Long parades of clouds. The day's weather in the Middle West. 10 to the sixth, a one with six zeros. A million meters.
Soon the Earth will show as a solid sphere. We are able to see the whole Earth now, just over a minute along the journey. Earth diminishes into the distance, but those background stars are so much farther away. They do not yet appear to move.
A line extends at the true speed of light, in one second it half crosses the tilted orbit of the moon. Now we mark a small part of the path in which the Earth moves about the sun. Now the orbital paths of the neighbor planets, Venus and Mars, then Mercury. Entering our field of view is the glowing center of our solar system, the sun.
Followed by the massive outer planets, swinging wide and their big orbits. That odd orbit belongs to Pluto. A fringe of a myriad comets too faint to see completes the solar system. 10 to the 14th. As the solar system shrinks to one bright point in the distance, our sun is plainly now only one among the stars.
Looking back from here, we know four Southern constellations still much as they appear from the far side of the Earth. This square is 10 to 16th meters, one light year. Not yet out to the next star. Our last 10 second step took us 10 light years further. The next will be 100. Our perspective changes so much in each step now, that even the background stars will appear to converge.
At last we pass the bright star Arcturus, and some stars of the Dipper. Normal but quite unfamiliar stars and clouds of gas surround us as we traverse the Milky Way galaxy. Giant steps carry us into the outskirts of the galaxy. And as we pull away, we begin to see the great flat spiral facing us. That time and path we chose to leave Chicago has brought us out of the galaxy along a course nearly perpendicular to its disk.
The two little satellite galaxies of our own are the clouds of Magellan. 10 to the 22nd power, a million light years. Groups of galaxies bring a new level of structure to the scene. Glowing points are no longer single stars, but whole galaxies of stars seen as one. We passed the big Virgo cluster of galaxies among many others, 100 million light years out. As we approach the limit of our vision, we pause to start back home.
This lonely scene, the galaxies like dust, is what most of space looks like. This emptiness is normal. The richness of our own neighborhood is the exception. The trip back to the picnic on the lakefront will be a sped up version, reducing the distance to the Earth's surface by one power of 10, every two seconds. In each two seconds, we'll appear to cover 90% of the remaining distance back to Earth.
Notice the alternation between great activity and relative inactivity, a rhythm that will continue all the way into our next goal, a proton in the nucleus of a carbon atom beneath the skin on the hand of a sleeping man at the picnic. 10 to the ninth meters, 10 to the eighth. Seven, six, five, four, three, two, one. We are back at our starting point. We slow up at 1 meter, 10 to the zero power.
Now we reduce the distance to our final destination by 90% every 10 seconds. Each step much smaller than the one before. At 10 to the minus 2, one one-hundredth of a meter, one centimeter, we approach the surface of the hand. In a few seconds we'll be entering the skin, crossing layer after layer from the outermost dead cells into a tiny blood vessel within. Skin layers vanish and turn, an outer layer of cells, felty collagen.
The capillary containing red blood cells in a roughly lymphocyte. We enter the white cell, among its vital organelles, the porous wall of the cell nucleus appears. The nucleus within holds the heredity of the man in the coiled coils of DNA. As we close in, we come to the double helix itself, a molecule like a long twisted ladder, whose rungs of paired bases spell out twice in an alphabet of four letters, words of a powerful genetic message.
At the atomic scale, the interplay of form and motion becomes more visible. We focus on one commonplace group of three hydrogen atoms bonded by electrical forces to a carbon atom. Four electrons make up the outer shell of the carbon itself. They appear in quantum motion as a swarm of shimmering points. At 10 to the minus 10 meters, one angstrom, we find ourselves right among those outer electrons. Now we come upon the two inner electrons held in a tighter swarm.
As we draw toward the atom's attracting center, we enter upon a vast inner space. At last, the carbon nucleus, so massive and so small, this carbon nucleus is made up of six protons and six neutrons. We are in a domain of universal modules. There are protons and neutrons in every nucleus. Electrons in every atom. Atoms bonded into every molecule out to the farthest galaxy.
As a single proton fills our scene, we reach the edge of present understanding. Are these some quarks at intense interaction? Our journey has taken us through 40 powers of 10. If now the field is one unit, then when we saw many clusters of galaxies together, it was 10 to the 40th, or one and 40 zeros.
The video shows the same point in space on a broad range of scales, from the subatomic to the astronomical. In geography, we tend to focus on human scales, which are the scales of the world as we experience it. So, you will not need to know any particle physics or astronomy for Geog 30N, even though some of it may be relevant!
It is important to appreciate that phenomena can be considered or observed at multiple scales. For example, we can observe climate change at the global scale, since climate is a global process. However, we can also observe climate change at local scales. Climate change is caused by, among other things, many individual decisions to burn fossil fuels. Also, climate change impacts people and ecosystems in specific local places across the world. The causes and impacts are different in different places. If we only observed climate change at the global scale, we would miss this variation from one location to another. It's important to observe climate change - and many other important phenomena - at many scales so that we can fully understand what's going on.
Another example important to Geog 30N is deforestation. As with climate change, it helps to consider deforestation on many scales. An individual living in the Brazilian Amazon might decide to cut down a tree to collect firewood, to sell the wood, or to clear land for farming. If we think of deforestation just at this local scale, then we might understand it as a local event. However, the decision to cut down the tree can be connected to other political, economic, cultural, and environmental processes that operate at national, regional and international scales. For example, the decision to cut the tree is shaped in part by external economic markets: whether the tree could be sold for money, or whether the person could make money from engaging in other activities that require clearing patches of forest, such as raising cattle for beef. Trade agreements between Brazil and other countries shape the systems of economic exchange, and international demand for hardwoods such as mahogany (in the United States and Europe in particular) create incentives to deforest tropical rainforests. Therefore, the simple act of cutting down a tree in Brazil needs to be seen as connected to other economic and political processes that intersect and move across multiple scales.
The deforestation example highlights the important concept of globalization. Globalization is a hotly debated concept, but it is generally understood as the increasing integration of societies around the world through improvements in transportation and communication technologies. The integration can be economic, political, or cultural. Here are some examples:
- * Economic Integration: Global freight shipping permits Brazilian trees to be sold to European consumers.
- * Political integration: American environmental policies may limit the types or quantities of trees that can be imported from Brazil.
- * Cultural integration: Globalized tastes for food can lead people from around the world to desire food products that can be grown in Brazil.
Globalization has impacted societies around the world as the sharing of products has contributed to the perception that cultures are losing their individuality.
One way to approach understanding relationships across scales is through commodity chains. A commodity chain contains the links between the collection of resources to their transformation into goods or commodities and, finally, to their distribution to consumers. Commodity chains can be unique depending on the product types or the types of markets (agriculture versus textiles for example). Different stages of a commodity chain can also involve different economic sectors or be handled by the same business. Figure 1.1 visualizes a simplified commodity chain for the seafood industry.
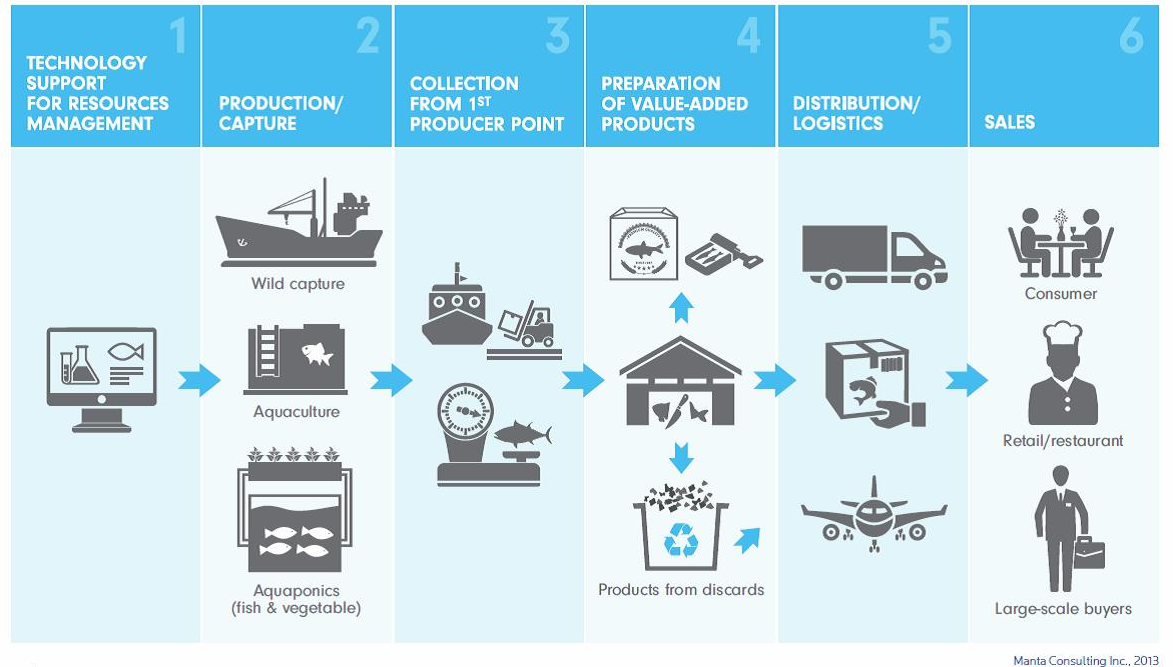
Click here to see a text version of Figure 1.1
Flowchart of the seafood supply chain:
- Technology support for resources management leads to
- Production/Capture: wild capture, aquaculture, aquaponics (fish & vegetable) leads to
- Collection from 1st producer point leads to
- Preparation of value-added product (ex. Butchering, packaging and waste) leads to
- Distribution/Logistics (ex. Truck, plane etc) leads to
- Sales: consumer, retail/restaurant/large-scale buyers.
Understanding the path that fish took on its way to our plates as it moves across the commodity chain allows us to think about the interconnections between capture/production (wild fisheries vs. aquaculture), generation (converting whole fish to other product forms such as fish fillets or canned fish), distribution and sales (transferring products to locations for consumption and selling products to consumers).
Consider This:
When you buy seafood, do you ask yourself, "Where does my seafood come from and how does it get to me?" Look at Figure 1.1 and try to place yourself on this supply chain. Where do you exist in terms of the production and consumption of seafood?
As we'll discuss in later modules, the global rise in seafood demand has caused the depletion of fish stocks. Unsustainable overfishing has emerged as a global issue and has its severe and irreversible impacts on human lives and marine biodiversity. As with fishermen catching more fish than the population can replace through natural reproduction, we need to think about our individual decisions and local patterns that contribute to sustainable practice. Our decisions and food choice are also linked to political and economic processes at multiple scales, but we need to think about the types of impacts our individual decisions have for the natural world.
Visualization
Visualization
Geography is regularly identified as the discipline that makes maps. While geography is, of course, much more than this, geographers do create maps to show how processes play out across space at various scales. Why maps? It's because maps are very effective at helping us see what's happening within some region. When spatial patterns are important - and they very often are - then looking at maps can be much more efficient and effective than looking at paragraphs of text or tables of data.
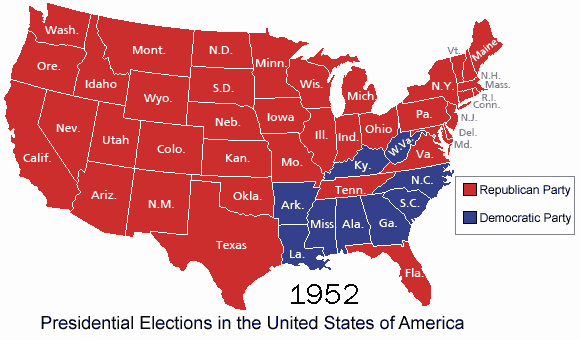
For example, suppose we want to learn the presidential election results by county in a given year, The animated map below shows the information. By displaying the information geographically, the map helps us learn what we want to know. In particular, the map makes it easier to identify the patterns in the data across space and over time. Throughout Geog 30N, we will view and even create maps to visualize spatial information.
See the raw data.
Cartographic Projection
The world is round, but maps are flat. A projection is a scheme for converting points on the round world to points on a flat map. There are many different types of projections, each with advantages and disadvantages. Some projections make it easy to see what is north, south, east, and west. Some projections make it easy to see how large a given land mass is. Some projections make it easy to navigate ships on the ocean. (Cartography has a long history of association with navigation.) Finally, some projections can even be used to advance political agendas, as this excerpt from the TV show The West Wing shows (four minute video):
[CJ Cregg]: Hi, I'm sorry.
[Dr. John Fallow]: Oh?
[CJ]: Sorry to be late.
[Dr. John Fallow]: Not a problem.
[CJ]: I'm CJ Cregg.
[Dr. John Fallow]: Of course you are I’m Dr. John Fallow with Dr. Cynthia Sales and Professor Donald Hyuk.
[CJ]: Hyuk?
[Dr. John Fallow]: Hyuk.
[CJ]: Okay and you are the organization of cartographers for social equality.
[Dr. John Fallow]: Well we're from the OCSE we have many members.
[CJ] How many?
[Dr. John Fallow]: 4,300 dues-paying members.
[CJ]: What are the dues?
[Dr. John Fallow]: Now $20 a year for the newsletter.
[CJ]: Let's start.
[Josh Lyman]: Wait I want to see.
[CJ]: This is Josh Lyman.
[Dr. John Fallow]: Indeed you are.
[CJ]: Josh, this is Dr. Fallow and his Merry Men.
[Dr. John Fallow]: Yes.
[CJ]: Should we begin?
[Dr. John Fallow]: Yes. Plain and simple. We'd like President Bartlet to aggressively support legislation that would make it mandatory for every public school in America to teach geography using the Peters projection map instead of the traditional Mercator.
[Josh Lyman] Give me 200 bucks, and it's done.
[Professor Donald Hyuk]: Really?
[CJ]: No, why are we changing maps?
[Dr. Cynthia Sales]: Because CJ, the Mercator projection has fostered European imperialist attitudes for centuries and created an ethnic bias against a third world.
[CJ]: Really?
[Dr. John Fallow]: The German cartographer Mercator originally designed this map in 1569 as a navigational tool for European sailors. The map enlarges areas at the poles to create straight lines of constant bearing or geographic direction.
[Dr. Cynthia Sales]: So it makes it easier to cross an ocean.
[Dr. John Fallow]: But-
[CJ]: Yes.
[Dr. John Fallow]: It distorts the relative size of nations and continents.
[CJ]: are you saying the map is wrong
[Dr. John Fallow]: Oh dear, yes. Now look at Greenland.
[CJ]: Okay.
[Dr. John Fallow]: Now look at Africa.
[CJ]: Okay.
[Dr. John Fallow]: The two land masses appear to be roughly the same size.
[CJ]: Yes.
[Dr. John Fallow]: Would it blow your mind I told you that Africa is in reality 14 times larger.
[CJ]: Yes
[Dr. Cynthia Sales]: Here, we have Europe drawn considerably larger than South America, when it's six point nine million square miles. South America is almost double the size of Europe's 3.8 million.
[Professor Donald Hyuk]: Alaska appears three times as large as Mexico when Mexico is larger by 0.1 million square miles.
[Dr. Cynthia Sales]: Germany appears in the middle of the map when it's in the northernmost quarter of the earth.
[Josh Lyman]: Oh wait, relative size is one thing but you're telling me that Germany isn't where we think it is.
[Dr. John Fallow]: Nothing's where you think it is.
[CJ]: Where is it?
[Dr. John Fallow]: I'm glad you asked. The Peters projection.
[Dr. Cynthia Sales]: It has fidelity of axis.
[Professor Donald Hyuk]: Fidelity of position.
[Dr. Cynthia Sales]: East-West lines are parallel and intersect North-South axes at right angles.
[CJ]: What hell is that?
[Dr. John Fallow]: It's where you've been living this whole time should we continue?
[CJ]: Uh-huh.
[Dr. John Fallow]: So you're probably wondering what all of this has to do with social equality.
[CJ]: No I'm wondering where France really is.
[Josh Lyman]: Guys, we want to thank you very much for coming in.
[CJ]: Hang on, we're going to finish this.
[Dr. John Fallow]: Okay, what do maps have to do with social equality, you asked?
[Josh Lyman]: She asked.
[Professor Donald Hyuk]: Salvatore Anatoly of the National Council for social studies argues in our society we unconsciously equate size with importance and even power.
[Josh Lyman]: I'm going to check in on Tommy if these guys find Brigadoon on that map you'll call me right.
[CJ]: Probably not.
[Josh Lyman]: Okay.
[Dr. John Fallow]: When Third World countries are misrepresented they're likely to be valued less when Mercator maps exaggerate the importance of Western civilization. When the top of the map is given him Northern Hemisphere and the bottom is given to the southern then people will tend to adopt top and bottom attitudes.
[CJ]: But wait where else could you put the Northern Hemisphere but on the top.
[Dr. Cynthia Sales]: On the bottom.
[CJ]: How?
[Dr. John Fallow]: Like this.
[CJ]: Yeah, but you can't do that.
[Dr. John Fallow]: Why not?
[CJ]: Because it's freaking me out.
Which of the projections shown in the video do you think should be used? Why? Note that the video claims that a certain projection is wrong. Technically, all projections are in some ways wrong, in the sense that they do not accurately portray the world. The only way to achieve accuracy is to use a spherical object - a globe. A projection should be chosen to fit the purpose of the map, so the best projection to use will depend on the circumstances of the map.
Some maps don't even try to have an accurate projection. They distort distances in ways that are geographically inaccurate but useful for other purposes. A classic example of this is the map of the London subway system, which is known as the London Underground or the Tube and operated by a government agency called Transport for London. Here is a portion of the standard system map:
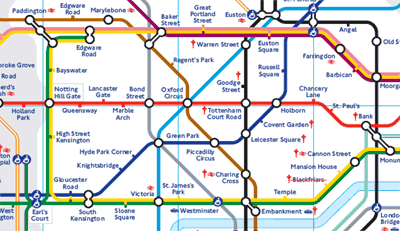
The full map can be found on the Transport for London website. This map is beautifully designed and user-friendly. The mix of colors and layout of the different subway lines on the map make it easy to interpret. However, the map is very geographically inaccurate, meaning the relative distances between the different stops are not shown. In fact, the center of the map (which is downtown London) shows the stops at some distance from each other when in reality they are very close to each other. Alternatively, the stops further out from the city (in the corners of the maps) are some distance away from each other. This makes it impossible to know how long a particular trip will be from the map. So while the map aids in the comprehension of the different lines and stops, it sacrifices accuracy in terms of distances. Maps, therefore, are imperfect documents that can distort or omit information, and, in some cases, bias our understandings of spatial patterns and processes.
Here is a geographically accurate Tube map, produced independently of Transport for London:
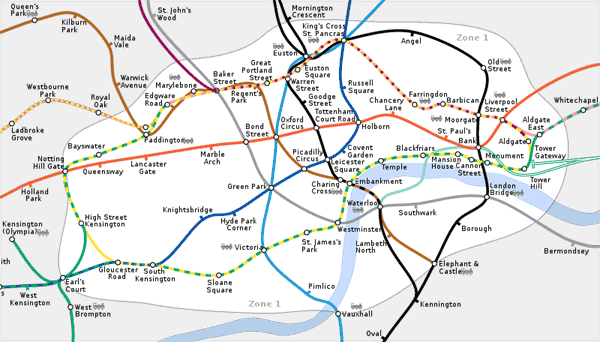
If you were riding the Tube, which map would you rather have?
Human-Environment Interactions
Human-Environment Interactions
One of the central contributions of the geographic discipline is its examination of the interactions between social and ecological systems. Thinking about these interactions requires addressing several key questions.
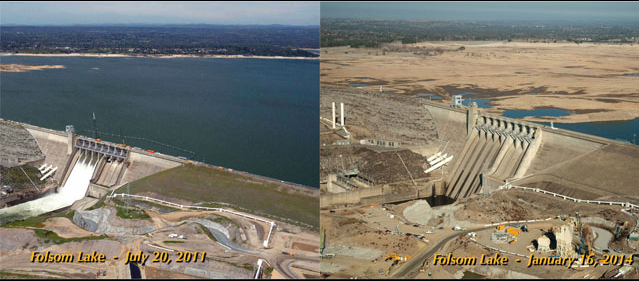
The first question is how does the natural environment shape, control, and constrain human systems? One way this is understood is in terms of natural hazards, which are natural events that disrupt human activity. For example, the ongoing and persistent drought in California (2012-Present, Figure 1.5) has resulted in devastating effects on ecosystems and human society. The threat of wildfire is greatly increased by the continued dryness and wildlife and people are suffering from severe water shortage. The dry conditions also have taken a heavy toll on agriculture, tourism, and recreational industries.
The second key question about human-environment interactions is how human decision-making and processes shape and change the natural environment, including ecosystems, river systems, vegetation, and climate. Humans have caused such significant environmental change that Nobel Prize-winning scientist Paul Crutzen suggested in 2000 that we have entered a new era known as the Anthropocene.
There is great concern about whether social and ecological systems can coexist in a sustainable manner. This has helped advance the concept of sustainability, which seeks to understand how human activities can exist without disrupting the ability of natural ecosystems to function. The sustainability concept will appear in various modules for this course, including coupled human-environmental systems, ethics and democracy, development, and individual responsibility. You will work through how sustainability is understood and the different ways that it is addressed.
An important consideration to sustainability is the concept of governance. Studies of governance consider how people make decisions and how they are constrained by external forces and structures to limit their range of options. An understanding of human-environment interactions attends to environmental governance in the ways that the ability of people to make decisions regarding the natural environment is shaped in part by external factors. As an example of this, the farmer in Brazil that we already discussed participates in governance decision-making with other stakeholders (the Brazilian government, other community members, etc.), state policies, and markets. The decisions that result in terms of transforming the natural environment are influenced by the governance mechanisms that shape the range of options available to particular actors. Environmental governance, which is in essence how natural resources are interpreted and managed by different stakeholders, connects to questions of sustainability. For example, one way of governing natural resources is through common property systems whereby individual actors are allowed access but with certain restrictions. Another example is exclusionary protected areas that restrict the movement of human populations and extraction of natural resources. These are two types of environmental governance strategies that have different impacts on social and ecological systems.
Finally, many of these discussions include concerns for ethics, as they involve how we prioritize human needs at the expense of non-human needs, how some human populations benefit from industrial development more than others, and what are the ecological costs of human-driven environmental change. The next course module, Coupled Human-Environment Systems, addresses these questions in more detail.
Social Science Perspectives
Social Science Perspectives
Geog 30N is, among other things, a social science course about the natural environment. At first glance, this might seem a bit odd. If the environment is a natural phenomenon, shouldn’t the study of it be more of a natural science?
Natural science is unquestionably important to understanding the natural environment. But, as we hope becomes clear in this course, social science is very important too. Here are some reasons why.
Human impacts on the environment. Human society has very large impacts on the natural environment. We are changing the makeup of Earth’s surface and atmosphere, depleting a variety of natural resources, changing the global climate, and even causing many other species to go extinct. These impacts are unprecedented in the entire course of Earth’s history. Natural science can help us understand the nature of these environmental impacts, but social science is needed to understand why and how human society is causing them.
Environmental impacts on humanity. Just as human society impacts the environment, so, too, does the environment impact humanity. Indeed, the environment has played a large role in the contours of human society throughout its entire history. Today, as the environment changes from human activity, these environmental changes are coming back around to impact humanity, often quite profoundly. Understanding how the environment impacts society requires social science.
Environmental policy. Given the importance of the impacts of humanity on the environment and the environment on humanity, society’s policies towards the environment are also important. This includes our policies on how we impact the environment and policies on how we respond to environmental conditions and changes in these conditions. The word “policy” here should be interpreted broadly to include the policies of governments but also the policies of businesses, schools, non-profit organizations, and even households and individual people. Understanding the environmental policies found throughout these portions of human society requires social science.
Geog 30N covers all of these ways social science is important to the environment. In the process, we’ll learn some core social science perspectives, many of which also appear in social science disciplines outside geography, such as economics, history, political science, and psychology. One advantage of studying the environment in a geography course is that geography is a diverse discipline that is very comfortable with including ideas from other disciplines. Indeed, some of the content for this course comes from natural science, the humanities (in particular ethics), and the design-oriented disciplines such as architecture, business, engineering, and policy. Different academic disciplines bring different perspectives, but, ultimately, the disciplines are all studying the same world. Our goal is to understand the world and society’s place within it. We will use whatever perspectives can help us achieve this.
Summary
Summary
This first module was designed to introduce you to major concepts within the geographic discipline, to understand how geographers examine and work in the world. While geography literally means “to describe the Earth,” geography is not just locating places on maps but understanding how those places are created and change over time. Understanding where places exist is essential to success in today’s world, especially because of globalization’s increasing economic and political integration of countries all over the world. Geographers thus pay a lot of attention to the spatial and temporal scales in which globalization and other processes play out. To help us visualize and understand these processes and the patterns they produce, geographers make maps and utilize Geographic Information Systems (GIS). Finally, geographers study human-environment interactions. This includes both how the environment affects humans and how humans affect the environment. Human impact on the environment in recent years has been very large, leading to big questions about what the future of life on Earth will be. Module 1 began with these concepts because we will be exploring them in even greater depth for the rest of the course.
Module 2 - Coupled Human-Environment Systems
Introduction
About Module 2
This module addresses the complex and coupled linkages between human systems and ecosystems. It provides an overview of the key concepts that are necessary for understanding many of the environmental problems we face today and considers potential solutions. The perspective proposed here is a “systems perspective” that shows how human and environmental systems are coupled, how they are sustained through feedback mechanisms, and what important properties are of relevance for their resilience and sustainability.
This module focuses on the following questions:
- What are coupled human-environment systems?
- What are feedback mechanisms and how do they work?
- What are resilience and stability, and what do they have to do with sustainability?
- How do humans impact ecosystems?
- Can ecological systems develop and evolve in positive ways? What are the risks?
Use these questions to focus your thinking as you work through the lesson.
What will we learn in Module 2?
By the end of Module 2, you should be able to:
- define and use these concepts: landscape, system diagram, positive and negative feedback loops, carrying capacity, overshoot, resilience, and stability;
- explain what a systems perspective is, and use this perspective for understanding complex human-environment systems;
- draw a systems diagram;
- draw a resilience diagram and explain the connection between resilience and sustainability;
- understand each of the terms in I=PAT equation, as well as the overall significance of this equation and different perspectives on it.
Become familiar with these terms to the point where you, too, can use these in your own work.
What is due for Module 2?
There are a number of required readings in this module and two short assignments to submit. The material covered in this module will be necessary for the completion of Written Assignment 1 due next week. We recommend that you take a look at that assignment this week.
| Requirement | Location | Submitting Your Work |
|---|---|---|
| Reading Assignment: What is Human Ecology? | What are Coupled Human-Environment Systems? | No submission |
| Reading Assignment: The St. Matthew Island Reindeers | Feedback Mechanisms | No submission |
| Reading Assignments: Ehrlich, Simon, Kurzweil, Hynes | Population, Affluence, and Technology | No submission |
| Citation Training (Part 2) Assignment | End of Module 2 |
Connecting In-text to Reference List (quiz) Reflect and Share with your Peers (discussion post) |
Questions?
If you have any questions, please post them to our Course Q & A discussion forum in Canvas. I will check that discussion forum often to respond. While you are there, feel free to post your own responses if you, too, are able to help out a classmate. If you have a more specific concern, please send me a message through Inbox in Canvas.
Landscape
Landscape
Let's begin our discussion of coupled human-environment systems with a concept that is also a very important geographic perspective: landscape. The concept of landscape has for quite a long time been important to geographers and other environmental scientists in understanding human-environment systems. It has been used since the 1800s to focus on human-environment interactions and continues to evolve and be in widespread use.
A landscape, in this context, is not just the scenery that you view from a scenic lookout point. Instead, it is the combination of environmental and human phenomena that coexist together in a particular place on Earth's surface. Landscapes include physical features like streams, oceans, forests, and soils as well as human-constructed buildings, trails, fences, and mines. One emphasis of a landscape-based approach is that none of these features is entirely natural or entirely human. While the concept of “environment” often refers only to the non-human phenomena that humans interact with, the concept of “landscapes” refers to both human and non-human phenomena. Landscapes thus remind us that it is actually impossible to completely disentangle the human from the non-human.
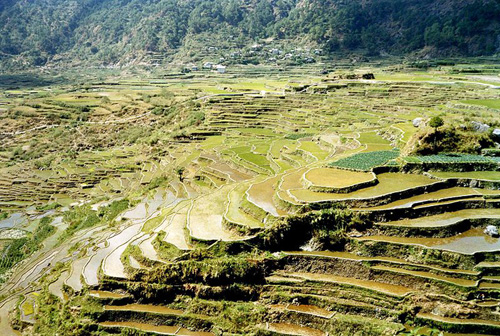
A vivid example of a landscape that shows the close coexistence of humans and environments is the agricultural terrace. A terrace for agriculture is a system of steps built into a hillside to facilitate growing crops or grazing animals. Compared to agriculture on unterraced slopes, terraces reduce erosion, capture more water, and make crops easier to harvest either mechanically or by hand. Terraces are found in sites across the world, including the Philippines, Peru, and England. Terraces show the coexistence and coevolution of human and environmental systems. If the environment were not hilly, then humans would not build terraces. This is an impact of the environment on humans. An impact of humans on the environment is the terrace structure, which becomes an enduring feature of the hill itself. Clearly, humans and the environment are inseparably part of the landscape. In other words, the human part and the environment part are closely coupled.
The famous geographer Carl Sauer (1889-1975) encouraged environmental thinkers to study the humanized environment (i.e., the environment as influenced by human activity) in terms of landscapes during the early and mid-twentieth century. This was a formative period in our understanding of the role of humans in environments. Sauer characterized the process of landscape creation as always ongoing and thus necessary to see in historical terms. He imagined a landscape being transformed through time from its original, natural form into a “cultural landscape” via the influence of human technologies and economies. As our understanding of the dynamism of human-environment systems has evolved, geographers have continued to recognize the importance of history while building a new emphasis on the recursive relationships (interactions in both directions) within the human-environment landscapes. We cannot simply think about how humans have shaped a landscape, we must also think about how the natural features have enabled and constrained human efforts. This bi-directional interaction, or coupledness, is why we study landscapes as a human-environment system.
A dynamic historical perspective also reminds us that there is no pre-determined way that a human-environment landscape will evolve or should evolve. For example, Iowa was not destined to become “the corn belt.” Its emergence as that type of cultural landscape was contingent upon the historical interactions between particular cultural values, economic systems, and environmental conditions. The ability for you to conceive landscapes that are multi-layered, recursive and contingent will enrich your studies of human-environment systems.
One final important feature of a landscape-based approach is the emphasis on perception. Geographer Donald Meinig (1924-2020) writes that "any landscape is composed not only of what lies before our eyes, but what lies within our heads." Landscapes aren’t just “out there” waiting for us to interact with and learn from them. Instead, our interpretations of landscapes are shaped by our own preferences, needs, and experiences. In other words, we mentally “construct” landscapes based on our perspective. For some, a particular landscape of coastal environments may represent environmental preservation. For others, it may reflect recreation. For still others, it may evoke labor and oppression. This means that when we study a landscape, we have to be careful not to imagine that we immediately see all that is there or that our initial perceptions are correct.
What Are Coupled Human-Environment Systems?
What Are Coupled Human-Environment Systems?
As the concept of the human-environment landscape clearly shows, humans impact the environment, and the environment impacts humans. These impacts happen in many different ways. In other words, there are very many interactions between humans and the environment. In order to help us keep track of all these interactions, and to learn from them, it is very useful to use a systems perspective. This means treating humans and the environment as systems: the human system and the environmental system. We could even treat them as one combined human-environment system.
What is a system? In simple terms, it is a collection of components that interact with each other to form some aggregated whole. For example, this course is a system. It has many components, including the modules, the course assignments, the instructor, and the students. These components all interact with each other to form the course. The components can also be thought of as systems. For example, this module has several web pages, some supplemental readings, and a learning activity at the end. Each of these module components can be thought of as a system, too.
To help us visualize and understand systems, it is often helpful to use a systems diagram. A systems diagram displays the system’s components and the interactions between them. In a systems diagram, we put short descriptive phrases (not sentences) in boxes to represent the components that make up the system. Interactions between the components are often symbolized by arrows pointing in a logical direction. Sometimes we also place single words or short phrases along the arrows to explain the nature of these interactions.
Here is an oversimplified systems diagram showing a human-environment system in which humans and the environment both impact each other:
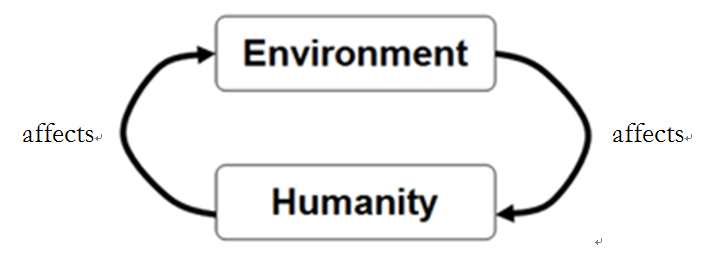
The systems diagram above is far too simple to illustrate how humans and the environment interact with each other. Let’s take a closer look at the concept of human-environment systems. This concept is developed very well in Gerry Marten’s online textbook Human Ecology. This textbook has excellent systems diagrams and discussions of other aspects of human-environment systems that could serve as a helpful resource for you if you need it.
Reading Assignment: "What is Human Ecology?"
Here, please read just the first section, “What is Human Ecology?” The second section covers sustainable development, which we’ll return to later.
- Marten, Introduction: What is Human Ecology?
As you’re reading this first section, think about how systems are being used to describe humanity, the environment, and interactions between them. Here are some more questions to think about as you read:
- What, according to this reading, is the relationship between humanity and the environment?
- What are some components of the human system and the environment system? How do these components interact?
- What are the specific examples of human-environment systems being presented? What are the components, and how do they interact?
- If you were given a story about a human-environment system, could you draw a systems diagram for it?
Feedback Mechanisms
What are feedback mechanisms and how do they work?
Let’s revisit that very simple human-environment systems diagram from the "What are coupled human-environment systems?" page:
The diagram in Figure 2.2 shows that humanity impacts the environment and that the environment impacts humanity. But if the environment impacts humanity, then that can in turn impact how humanity impacts the environment, which can in turn impact how the environment impacts humanity.
This phenomenon of system components both impacting each other creates a feedback loop. Feedback is an impact to a system component that is a consequence of an action performed by that component. For example, suppose you take the action of writing an email to the instructor, asking a question about the course. The email you get back is a feedback. A loop is a circumstance in which system components impact each other, such that an action by a component affects subsequent performances of that action. This circumstance has a circular, loop-like appearance in a systems diagram, as seen in the diagram above.
There are two basic types of feedback: positive and negative. A positive feedback loop is a circumstance in which performing an action causes more performances of the action. For example, suppose that every time you emailed the instructor with a question about the course, the instructor wrote back with an email so confusing that you had even more questions about the course, which cause you to write two emails back for more clarification. This would be a positive feedback loop.
A negative feedback loop is a circumstance in which performing an action causes fewer performances of the action. For example, suppose that every time you emailed the instructor with a question about the course, the instructor wrote back in an email that clarified the entire course for you, so that you had fewer questions about the course and thus wrote fewer emails for clarification. This would be a negative feedback loop.
It is important to understand that for feedback loops, the terms "positive" and "negative" do not mean good and bad. A positive feedback loop can be a bad thing, and a negative feedback loop can be a good thing or vice versa. Whether or not any given feedback loop is positive or negative is ultimately an ethical question. We’ll cover ethics in Module 3.
Self-check
Now that you have read a bit about what feedback loops entail, here are a few multiple-choice questions that will test your understanding of the differences between what a feedback loop is, and whether it is positive or negative feedback. These should be very simple questions and the purpose here is to give you some confidence in understanding this material so far.
Think About It!
Come up with an answer to these questions by yourself and then click below to reveal the answer.
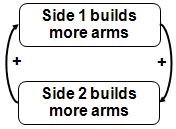
An arms race is an example of:
- Positive feedback
- Negative feedback
- Neither
1. Positive feedback - An arms race is an example of positive feedback because when one side of the race builds more arms, the other side then builds more arms, which causes the first side to build even more arms, and so on. For example, in the Cold War, when the United States built more nuclear weapons, this prompted the Soviet Union to build more nuclear weapons, which prompted the United States to build even more nuclear weapons, and so on.
Exponential population growth is an example of:
- Positive feedback
- Negative feedback
- Neither
1. Positive feedback - Exponential population growth is an example of positive feedback. Exponential population growth occurs when each set of parents have more children than there are parents, and then these children grow up to become parents themselves. Thus, having more children causes there to be more parents, which in turn causes even more children, and so on.
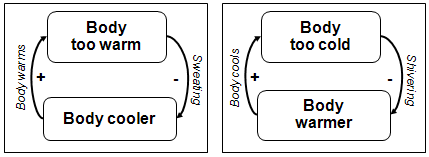
Body temperature control is an example of:
- Positive feedback
- Negative feedback
- Neither
2. Negative feedback - Body temperature control is an example of negative feedback because when body temperature goes too far in one direction, the control mechanisms push the temperature back in the other direction. For example, when our bodies get too hot, we start to sweat, which causes our bodies to cool. Or, when our bodies get too cold, we start to shiver, which causes our bodies to warm.
Population regulation is an example of:
- Positive feedback
- Negative feedback
- Neither
2. Negative feedback - Population regulation is an example of negative feedback because when a population gets too high for the ecosystem in which it's living, the population declines. Specifically, when individuals in the population consume too much, then there are no longer enough resources to sustain the population, and the population declines.
Carrying Capacity
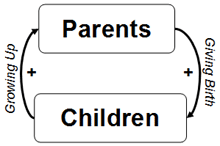
As the Self-check indicates, population change can involve either positive or negative feedback loops. When a population is growing exponentially, there is a positive feedback loop: more children bring more parents, which in turn bring even more children, and so on:
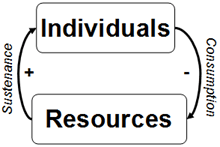
The plusses here signify that each set of parents brings more children, and each group of children brings more parents. If the birthrate is constant over time, and if each generation is larger than the previous, then there will be exponential population growth, as shown in Figure 2.10 in the Marten reading “What is Human Ecology?” But population can’t maintain exponential growth forever. To do so would require an infinite amount of resources, but we live in a finite world. Here’s where the negative feedback loop comes in. The resources provide sustenance to the population: food, water, energy, or whatever other resources are being used. As the population runs out of resources, it can’t have as many children – or, the children can’t grow up to become parents.
The + here signifies that more resources bring more individuals since individuals need resources to survive. The - here signifies that more individuals bring fewer resources since a larger population will consume more, leaving fewer resources available for anyone else. If a population continues to grow exponentially for long enough, eventually it will hit a point where there aren’t enough resources for it to continue growing. At this point, the population has reached the largest size that the resources permit. This size is called the carrying capacity.
It is important to understand that the carrying capacity refers to the largest population that can be sustained over the long-term. Carrying capacity is not constant and varies over time in response to changes in the environment. For example, disturbances from extreme natural events (e.g., volcanic eruptions) and human activities (e.g., pollution) can alter the environment to a great extent and consequently influence carrying capacity.
A population can temporarily exceed the carrying capacity. For example, imagine a population of rabbits that lives off of carrots. The rabbits have to leave enough carrots in the ground each year so that they will have enough carrots to eat the following year. The carrying capacity is thus the largest number of rabbits that can live one year while still leaving enough carrots left over for the same number of rabbits to live the following year. The rabbits could exceed the carrying capacity one year, but then there wouldn’t be enough carrots the following year. To exceed the carrying capacity is called overshoot, as seen in Figure 2.11 of the Marten reading “What is human ecology?” Overshoot is followed by a major decline in population.
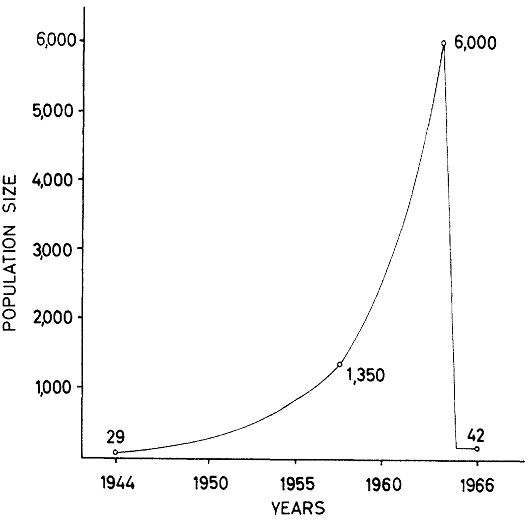
Reading Assignment: The St. Matthew Island Reindeers
A vivid example of population overshoot is found in the story of the reindeer that briefly lived on St. Matthew Island off the coast of Alaska. Please read the story in the following two articles by Ned Rozell:
St. Matthew Island -- Overshoot and Collapse, Resilience, November 22, 2003.
What wiped out St. Matthew Island's reindeer?, Anchorage Daily News, Published January 16, 2010; Updated December 29, 2017
As you read this, consider the following questions. When and why did the population crash occur? How could it have been prevented? Is the human population destined for the same fate? Why or why not?
Here's a graph showing the reindeer’s exponential population growth and dramatic decline. As you examine the graph, consider how the graph relates to the story and to the concept of feedback mechanisms within a system.
The full article is available via Penn State e-journals, in case you're interested in reading it.
Carrying Capacity and Sustainability
Carrying capacity is closely related to sustainability. Sustainability is, in the simplest terms, the ability for something to be maintained into the future. If that something is a population, then for it to be sustained, it cannot exceed the carrying capacity of the system it’s living in. This is just a brief introduction to the idea of sustainability. There is a lot more to it. We’ll cover sustainability in more detail in the ethics module.
A key question in GEOG 030N – perhaps the key question – is whether today’s human population is sustainable. You might try to answer this question by comparing the human population to Earth’s carrying capacity for humans. But this is not an easy answer to provide! One reason is that the global human-environment system is very complex. Another reason is that human activity is changing the carrying capacity, in both positive and negative ways. In fact, it is important to consider whether the carrying capacity concept (which was developed to model non-human populations) can actually be applied to humans. Our behavior and consumption habits do not follow the same rules and patterns that we see in non-human populations. Many of the new technologies that we develop enable us to support larger populations, thereby increasing the carrying capacity. Some things we do such as unchecked timber harvesting deteriorate our resource base, lowering the carrying capacity. We also have economies, social and cultural customs, and government regulations that can influence and change resource use in both positive and negative ways. Given all this, no one is sure just how many people can be sustained on Earth over the long term. But we can get some important insights by studying human-environment systems, as we do in this course.
Resilience and Stability
Resilience and Stability
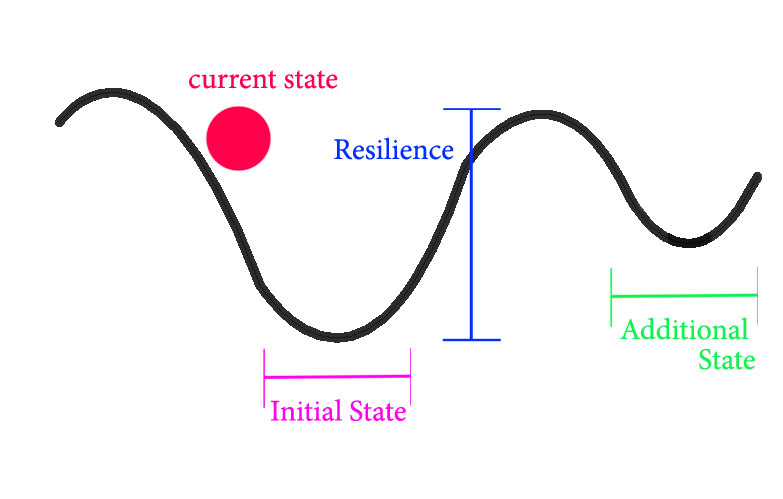
On the previous page, we saw that the idea of carrying capacity is closely related to the idea of sustainability. Here we’re going to explore another closely related idea: resilience. Resilience is a property of systems related to how a system responds to a disturbance or stressor. In rough terms, the more resilient a system is, the larger a disturbance it can handle.
To understand resilience with more precision, we need to first understand the concept of a system state. A system’s state is the general configuration that it is in. For example, if we think of a glass jar as being a system, then smashing the jar into little pieces would be a change to the system’s state. Or, if we think of a farm as being a system, then neglecting the farm for so long that it grows into a forest would be a change to the system’s state.
What qualifies as a state change depends on how we define the system. There are often many ways of defining a system, so there will also be many ways of defining its states and changes to them. We should have the mental flexibility to imagine systems and states being defined in different ways so that we can define them in ways that are helpful for our purposes, and so that we can understand how other people are defining them.
Given this understanding of system state, we can now define resilience with more precision.
Resilience is the ability of a system to maintain certain functions, processes, or populations after experiencing a disturbance.
Let's continue with the jar metaphor, and imagine that the jar is a system for holding sand. The system components would then be the glass jar, the lid, and the sand and air inside the jar. If our glass jar system is thrown at a wall with enough force, it will smash into little pieces and no longer be able to perform its principal function of holding sand (or anything, for that matter). But what if the force of impact was only strong enough to crack the jar without breaking it apart? In this case, one of the system components - the jar - is changed, but the system can continue to hold sand, and thus its system state remains essentially the same. The jar system's resilience, then, is the size of the impact it can withstand without smashing to pieces. Remember that disturbances always change systems in some way (otherwise we wouldn't call them disturbances). The more a system is able to maintain its functions and components after a disturbance, the greater its resilience to that disturbance.
With simple systems like the glass jar filled with sand, resilience can be (and often is) represented using the metaphor of a ball in a basin. If the ball is pushed a little bit, it will return to the bottom of the basin, i.e., to its initial state. If the ball is pushed hard enough, it will leave the basin and eventually settle somewhere else, i.e., in an additional state. The height of the basin thus corresponds with resilience: the higher the basin, the harder of a push the ball can withstand and still return to its initial state. Of course, this metaphor becomes less helpful with more complex systems that have many constituents, processes, and functions. In reality, most systems are only relatively resilient to most disturbances. Most complex systems are able to maintain some, but not all, components, processes, and functions after any given disturbance (as long as it is not catastrophic). In other words, resilience in real-world systems is usually relative to the type of disturbance and specific constituents, processes, and functions.
Is Resilience Good?
Resilience is often viewed as a good thing. If an ecosystem is resilient, or if human society is resilient, then they will be quite capable of withstanding the disturbances that they face. For any system to sustain any particular state, then the system cannot experience any disturbances that exceed its resilience for that state. Thus resilience, like carrying capacity, is closely related to sustainability. This is why we see efforts to enhance resilience from groups like the Resilience Alliance. They would like for our human-environment systems to be sustained.
But whether or not resilience actually is good is an ethical question, and the answer is not automatically yes. We’ll discuss ethics further in Module 3, but for now, consider this. An exploitative agricultural production system, such as one that sources labor from human-trafficking network, might be resilient if it can withstand efforts to dismantle it. In these two cases, resilience is certainly not a good thing. So, while resilience is certainly an important concept and may often be considered a good thing, we should not blindly assume that it always is.
Stability
An important concept related to resilience is stability. Stability refers to the disturbances a system faces. If there are few disturbances or small disturbances, then the system is relatively stable. If there are many disturbances or large disturbances, then the system is relatively unstable.
Stability is a very important concept in agriculture. We would very much like it if our farms would yield (produce) about the same amount of food each year because in general, we eat about the same amount of food each year. If there is an unusually large food yield one year, this can cause complications but is typically not a huge problem. However, if there is an unusually small food yield one year, then this can be a huge problem. A famine can ensue, and people can die. In the food and agriculture module, we’ll examine yield stability in more detail. There, we’ll consider the Irish Potato Famine, which occurred in the mid-1800s. This was a case of extreme instability in food yield, which had disastrous consequences.
One might think that a resilient system would be one with more stability. However, this is not always the case. Sometimes, some instability can help increase resilience. This occurs when the disturbances increase the system’s ability to respond to further disturbances. For example, think of our bodies as systems. If we don’t exercise a lot, then we can’t do much exercise before we collapse. However, as we get more exercise, then there is an increase in our ability to withstand further exercise without collapsing. Here, the exercise is a disturbance, and collapsing is sending our bodies into a different state. As we exercise more, our bodies get less stability but more resilience. This often happens with other systems, too.
Population, Affluence, and Technology
Population, Affluence, and Technology
Now that we’ve covered resilience, let’s return to the question of humans and carrying capacity. There is no doubt that human impacts on our environments are often very strong – frequently strong enough to exceed the systems’ resilience. Here, we’re going to explore the relationship between human population, resource consumption, and the impact on ecosystems.
The IPAT Equation: I = P x A x T
A classic attempt to explain the relationship between a human population and its impact on the environment is the IPAT equation. The equation maintains that impacts on ecosystems (I) are the product of the population size (P), affluence (A), and technology (T) of the human population in question. This equation was developed by biologist Paul Ehrlich and environmental scientist John Holdren in 1971, and you might notice that the concept is very similar to the notion of carrying capacity presented earlier in this module. It is elegant in its simplicity, and compelling because it presents such an intuitive narrative. But intuitive narratives are not always the best explanation for complex problems. Remember the caution about carrying capacity: does it really apply to human populations?
Reading Assignment: "Too Many People, Too Much Consumption"
To gain a more detailed understanding of the arguments supporting the IPAT equation, please read the article:
"Too Many People, Too Much Consumption” by Paul and Anne Ehrlich.
The Ehrlichs are among those who initially developed the equation and remain strong supporters of it.
As you read this, consider what the equation means for human impact on the environment.
- Which areas of the world will have the largest impact?
- Also, note that the equation has been controversial. What parts of it – including how it is being used – do you agree or disagree with? Why?
Ehrlich and other IPAT supporters might attempt to explain the geographic distribution of the PAT side of the equation by looking at a map of GDP (gross domestic product) density:
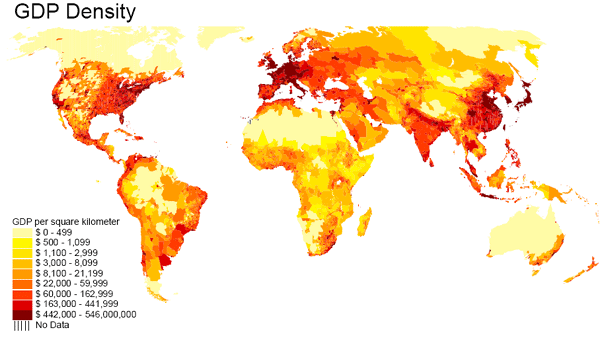
The map shows where economic activity is concentrated. This might be a reasonable approximation for population times affluence, though it does not factor in technology. GDP is an important statistic, but it is important to remember that it is a measure of gross economic production and not a measure of national wellbeing. One can have a high GDP and still not be well-off, for example, if the population is overworked and/or underpaid, or if the environment suffers excessively. High GDP could also mean more sustainable consumption, energy-saving and recycling technologies, and better environmental regulations. Finally, note that this is a (rough) map of some of the potential drivers of environmental impacts. It is not a map of the impacts themselves. While the environmental impacts may be driven by human activities in these regions, the impacts often occur in different places, due to the globalized nature of both human and environmental systems. For example, economic activity in one place can cause the extraction of resources in other places, or cause pollution which spread to other places.
Different Perspectives on IPAT
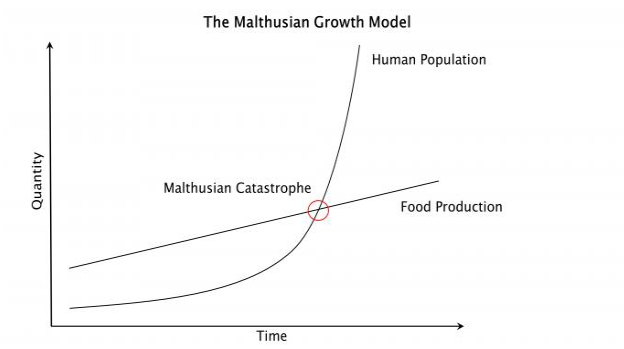
The IPAT equation and other environmental explanations based on population and resource scarcity became very popular in the 1970's with the birth of the modern environmental movement, and they have often dominated environmental activism and regulation since that time. But the ideas are actually much older than Paul Ehrlich. These arguments originated in late 18th Century England with the work of cleric and scholar Thomas Robert Malthus. In his 1798 book An Essay on the Principle of Population, Malthus argued that human population growth is exponential while natural resources (particularly food) are fixed, and their availability can only grow linearly. Thus, he argued that unless the human population was regulated in some way, the population would surpass resource availability, leading to famine, disease, and population collapse (a moment dubbed the 'Malthusian catastrophe.' see figure 2.8 below).
Straightforward though this may seem, Malthus placed most of the blame for human population problems squarely on the shoulders of the poor and people from less developed nations, finding fault with their ignorance and lack of moral discipline. You may think that this is a rather ugly position to take, and you are not alone. Malthusian arguments had lost prominence until the middle of the 20th Century when a new group of scholars took up the mantel of unchecked population and resource scarcity. These thinkers are known as neomalthusians because their theories are an update to the work of Malthus. The main difference in neomalthusian explanations is the acknowledgment that affluence and technology influence consumption and resource supply problems (and thus environmental impact) as well as total population. In other words, richer nations are also part of the problem - hence the IPAT equation. However, the basic premise still hinges on the notion of overpopulation and resource scarcity. Paul Ehrlich is perhaps the best known and most vocal of the neomalthusian thinkers, and his work and activism have contributed to the dominant position that neomalthusian arguments have in environmental and sustainability circles.
As mentioned earlier, these arguments are compelling, and in absolute terms they are correct. The Earth cannot support an infinite number of humans consuming an infinite number of resources. But neomalthusian arguments are based on a number of assumptions that might be problematic. First, they assume that human population growth is generally exponential. As we will discuss later on, this has not always been, nor is it now, true. Secondly, neomalthusians assume that natural resources are essentially fixed, which is why supply will eventually not keep up with demand. The truth, as you surely know, is much more complicated than that. Technology has played a crucial role in expanding resource availability in ways that may not be adequately considered in IPAT. Lastly, the neomalthusian argument assumes that growing affluence necessarily increases consumption and environmental impact. This is certainly true in some cases, like meat consumption, but not so in others, like renewable energy. Ehrlich and his neomalthusian colleagues have many critics, and we will now read a few of their arguments. As you read these articles, keep in mind our overarching question, does the carrying capacity concept really apply to human populations?
Reading Assignment: part of "The Doomslayer"
Please read part of the article:
"The Doomslayer" by Ed Regis, which was published in Wired Magazine
Read the text beginning “Still, that was a mere flash in the pan…” and stop at the paragraph beginning “A more perfect resolution of the Ehrlich-Simon debate could not be imagined…”
Consider the following. What are Simon’s views on the IPAT equation and how do they compare to Ehrlich’s?
Simon is essentially arguing that throughout history technological advances have made it so that natural resource and food production have more than kept up with population growth and demand. He also suggests that human impact on the environment is not as negative as some have claimed. These are important aspects of the IPAT equation: if more population, affluence, and technology do not bring resource scarcity and greater environmental impact, then the equation does not hold. Simon won his bet with Ehrlich (as described in the Wired Magazine reading), so there must be some substance to Simon’s ideas. He was certainly correct that in virtually all cases, natural resources and commodities like food are more plentiful now than in the past, and supply has certainly kept up with demand. What Simon does not mention, and what Ehrlich and his colleagues failed to realize, is that commodity prices are not merely a reflection of overall supply or scarcity. Consider the price of oil. Oil prices in 2016 reached record lows even though oil is absolutely a finite resource. Much of this is due to hydraulic fracturing technologies, which have temporarily increased supply, but at a potentially great environmental price. Thus, when looking at these debates, it is important for us to be able to analyze the evidence and the arguments for ourselves, so that we can avoid making the same mistakes as others may be making.
Reading Assignment: part of "What Are You Optimistic About? Why?"
Please read the following article by Ray Kurzweil:
What Are You Optimistic About? Why? by Ray Kurzweil.
Consider what Kurzweil’s views on the IPAT equation might be, and how they compare to Ehrlich’s and Simon’s.
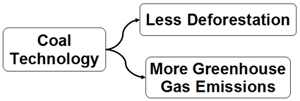
Kurzweil is a famous inventor and futurist. He argues that future technologies will be able to address our environmental concerns. This type of solution to environmental problems is called a technofix, and it raises an important point about the “T” in the IPAT equation. While some technology certainly does increase environmental impact, other technology decreases it. For example, coal power technology generally increases our greenhouse gas emissions, whereas solar power technology generally decreases emissions. To be more specific, some coal technology can decrease emissions, if it produces energy from coal more efficiently than other coal technology. Also, coal technology can reduce other environmental impacts, such as deforestation, if coal is used for energy instead of wood or charcoal. So, technology impacts the environment in many ways – which is a good reason for us to maintain a systems perspective.
Kurzweil's fervent belief in technology also relates to the "A" (affluence) component of IPAT. Alternative energy technologies and most other technological research and development happens in the richest nations. And wealthy countries are almost always the first to adopt these new technologies. This links Kurzweil's viewpoint with another prominent counterpoint to IPAT and the neomalthusian approach: the Environmental Kuznets Curve (Figure 2.10). Both Kuznets and the neomalthusian models assert that consumption increases with affluence, but the Kuznets model argues that the environmental impact of that increased consumption eventually levels off and decreases as more affluent populations adopt more sustainable consumption habits and technologies.
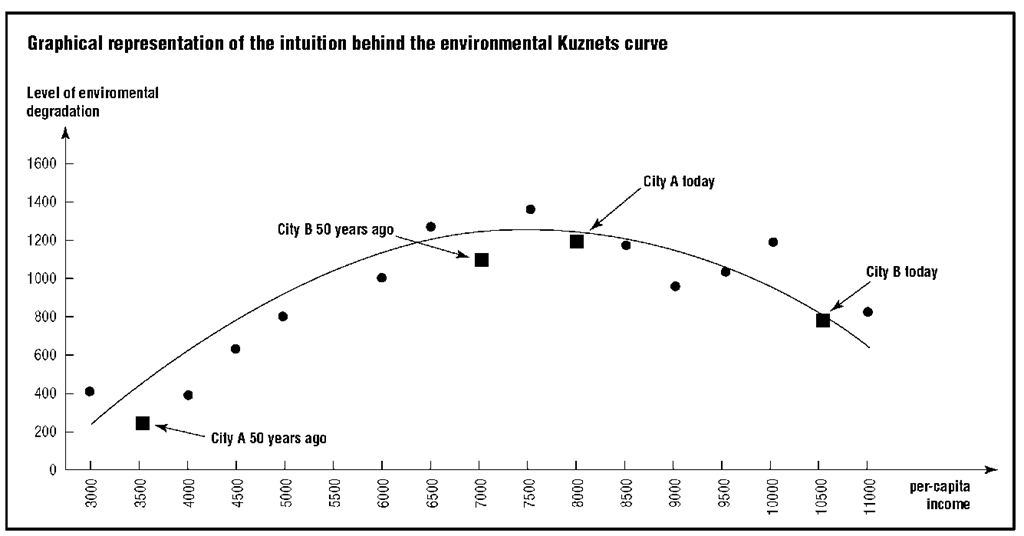
The arguments of Kuznets and Kurzweil are supported by numerous examples from wealthier and technologically advanced nations and cities around the world. A geographic approach to human-environment issues raises an important challenge: are these affluent populations really decreasing their environmental impacts, or are they just moving the impacts someplace else? Consider the example of forest cover. The United States and many western European countries have experienced a significant expansion of forest cover over the last 50-100 years. Kurzweil or the Kuznets model might argue that this is because the populations have developed resource saving technologies or more responsible consumption habits. To a certain extent, this is probably true. But over the same period that the US and Europe watched their forests grow back, forests in the tropics, particularly in Brazil and Indonesia, experienced devastating losses. This is partly because richer nations began sourcing some of their food and timber products from other places rather than producing them at home. The web of resource use is complex and difficult to unravel. One of the goals of this course is to give you the tools to think critically and geographically about human-environment interactions.
Kurzweil is arguing that technology can and will be developed so as to resolve some of our major environmental concerns. Is this true? Right now, it is very difficult to say. Technology is notoriously difficult to predict. While there probably will be at least some technological advances that decrease our environmental impact, we simply don’t know how successful this will be.
Reading Assignment: "Taking Population Out of the Equation"
Please read the article:
"Taking Population Out of the Equation" by H. Patricia Hynes, published by the Committee on Women, Population, and the Environment.
Consider what Hynes’s views on the IPAT equation are, and how they compare to the others we have seen.
Hynes is arguing that the IPAT equation has inappropriately focused attention on the world’s poor as causes of environmental problems. Hynes emphasizes a distinction between the environmental impacts of consumption that is necessary for survival and of consumption that is a luxury. Perhaps we should be more critical of luxury consumption. But what is luxury consumption, anyway? Hynes suggests things like golf courses and speedboats, but there is a big difference between necessary consumption and speedboats. The truth is that even average consumption in the US consumes vastly more resources than in even relatively well-off countries. You can calculate your ecological footprint , and you might be surprised what you find. In most cases, the American lifestyle would only be sustainable for a global population that is about 1/4 the current total. So is "P" or "A" the main problem? You be the judge. Hynes also emphasizes the environmental impacts of military activity. It is true that the military has a large environmental impact. For example, the United States military consumes more energy than any other organization in the world.
Finally, Hynes emphasizes the gender issues surrounding population, such as the ability of women to choose when to become pregnant. An alternative model to malthusian population growth is the demographic transition model (figure 2.11). The transition model argues that as populations become more industrialized, more educated, and more affluent, fertility and death rates decline significantly. In the long-term, this leads to a stabilization and eventual decrease in total population. As Hynes would point out, the developments that lead to the demographic transition usually usher in more rights for women, including access to effective family planning. We've seen this transition in many of the world's countries, and fertility rates have been in decline in virtually all areas of the world. You can explore the rates by country. Notice that in many countries, the fertility rate is around 2.5, and in most industrialized countries like the US, it is well below 2. Many demographers consider a fertility rate of 2.5 to be stable since not all children will survive to reproduce. Rates of 2.5 or less are considered a long-run contraction of a population. This is yet another reason why it is so difficult to apply the carrying capacity concept to humans.
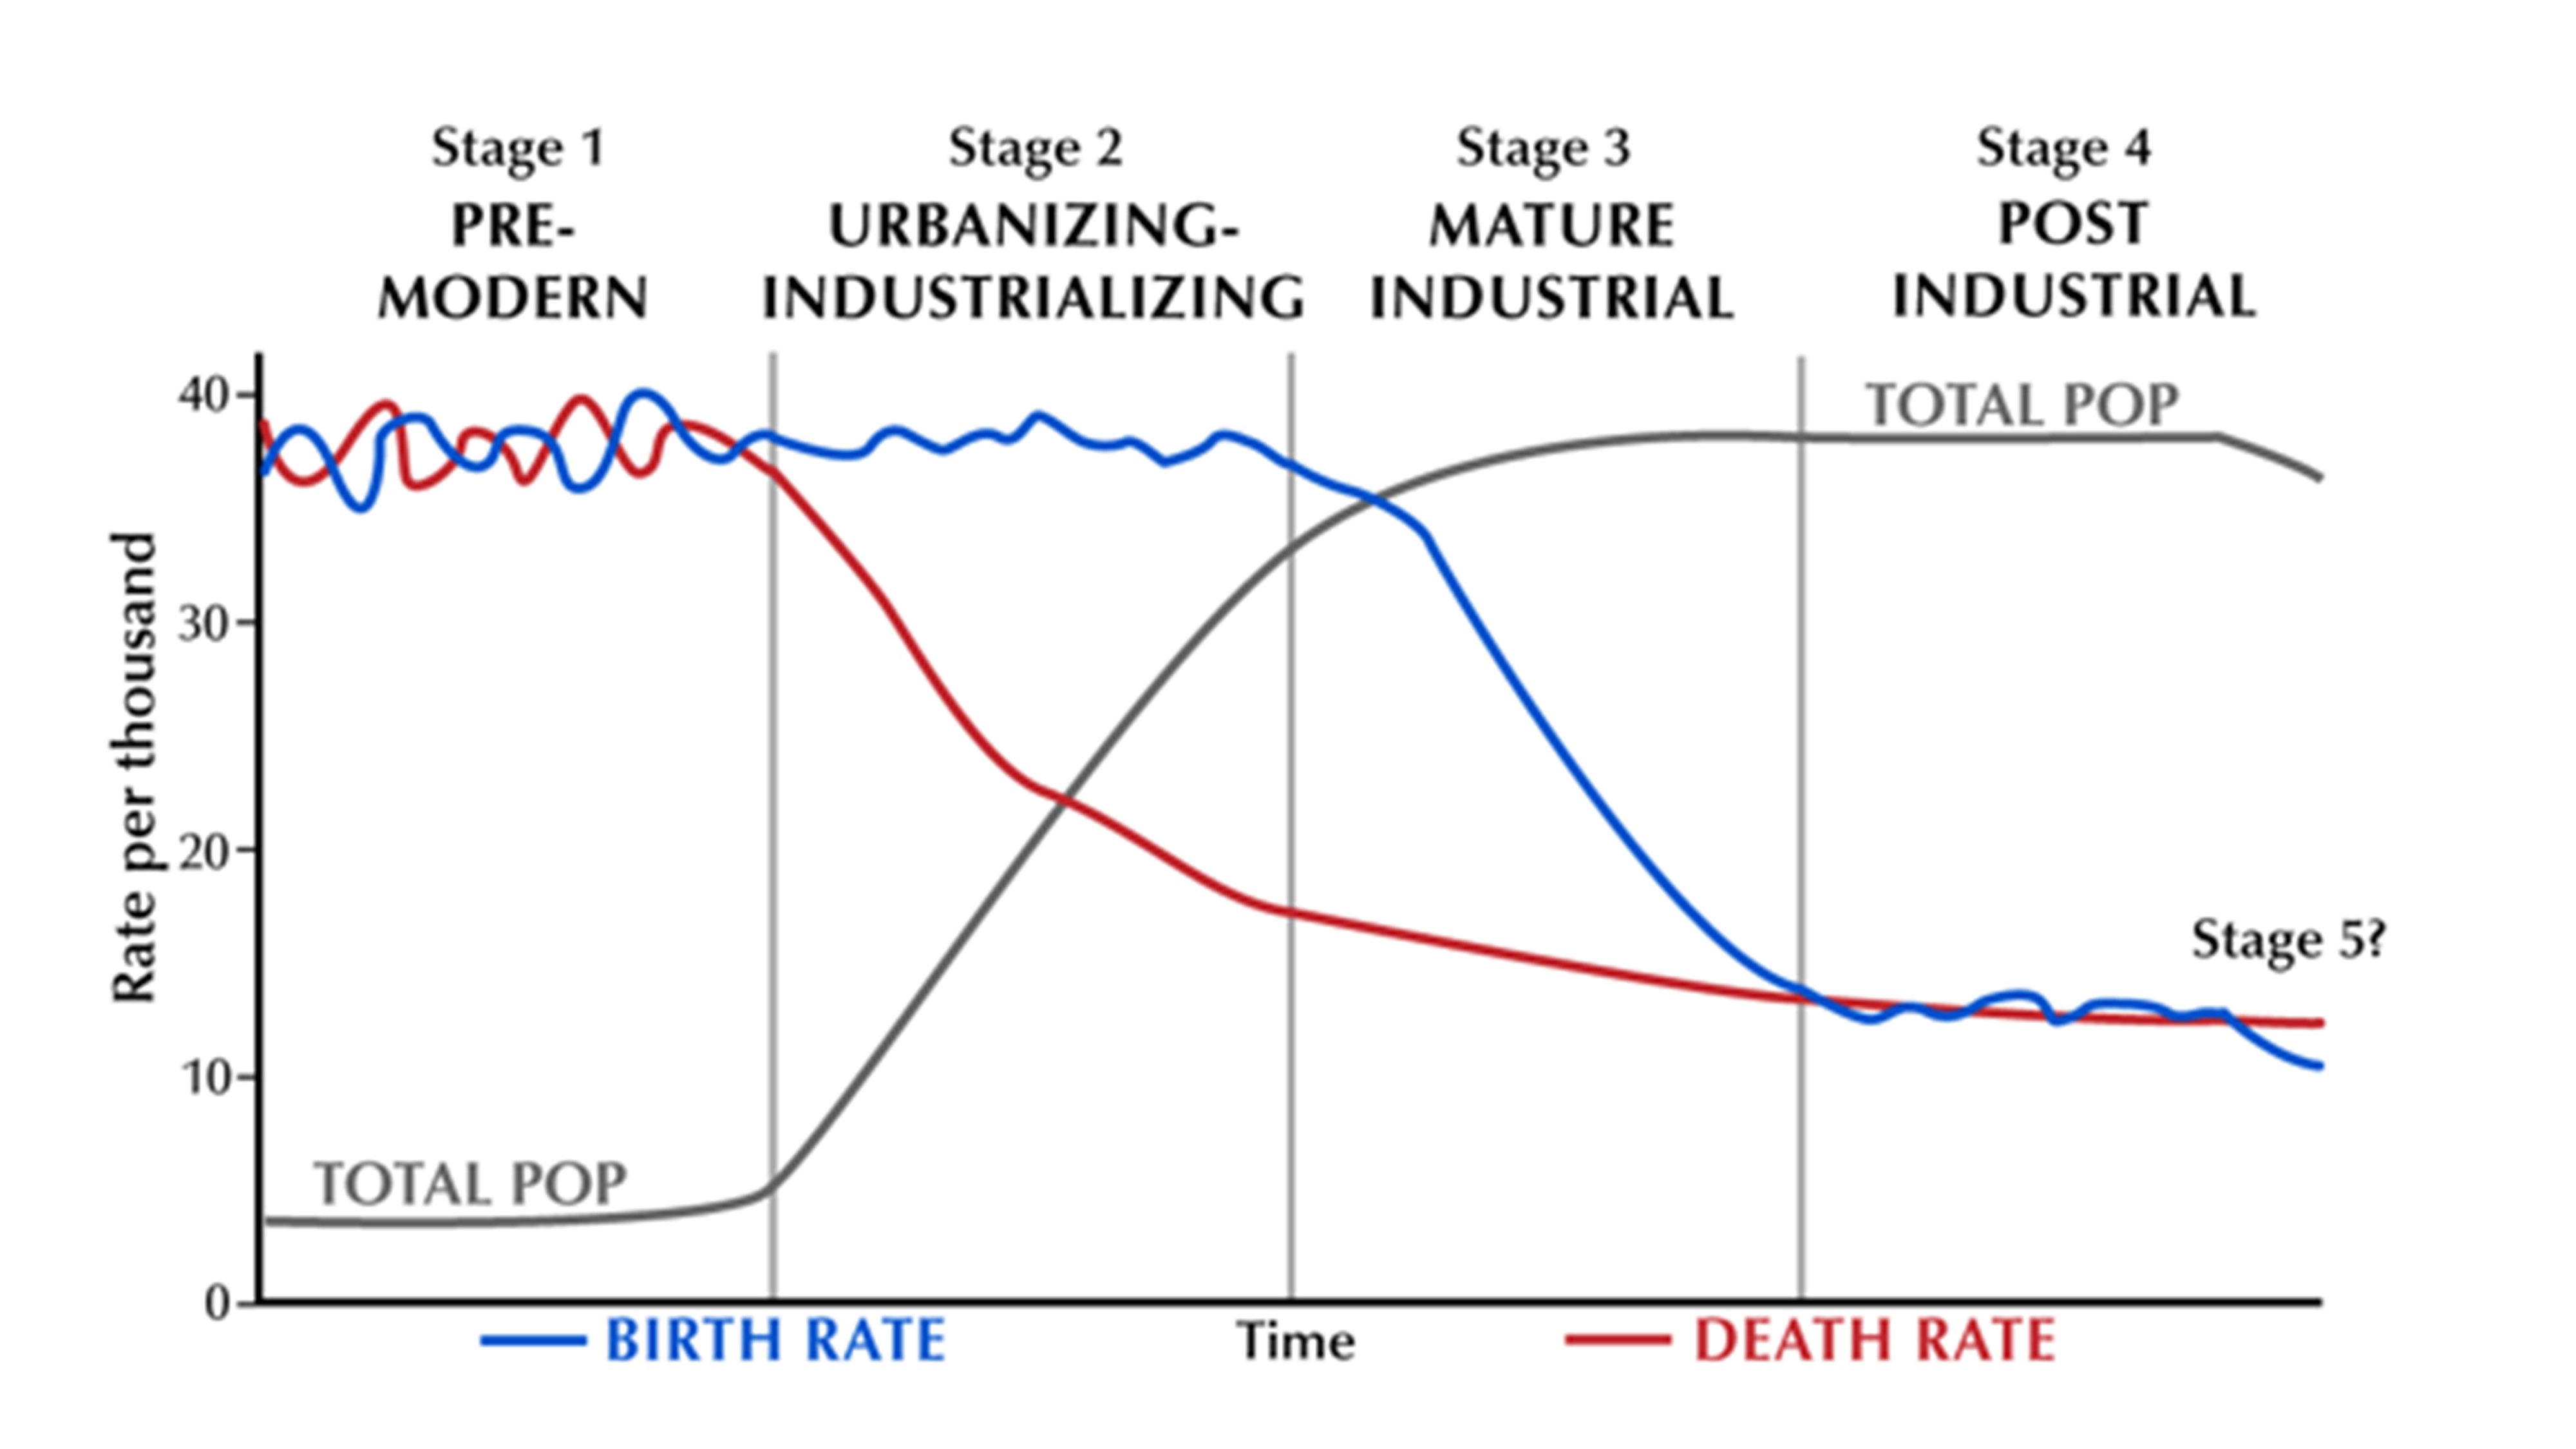
Graph of birth and death rate per thousand over time through four stages. The four stages from longest time ago till now are: stage 1 – premodern, stage 2 – urbanizing/industrializing, stage 3- mature industrial, stage 4 – post-industrial.
Total population begins is steady through stage 1 increasing drastically till stage three where it stays steady till the end of stage four where is starts to drop slightly.
Birth rate is fluctuating between 36 and 40 births per thousand during stage 1, steading out to ~38 births per month in stage 2 then dropping steadily in stage 3 till it steadies out ~12 births per thousand in stage 4. At the very end of stage 4 it starts to drop slightly.
Death rate is fluctuating between 36 and 40 deaths per thousand during stage 1, declining roughly during stage 2 to ~15 deaths per thousand, then declining less rapidly in stage 3 to ~12 deaths per thousand in stage 4.
The Takeaway
As you have now read, there are many different viewpoints on the impact of humans on their environments. Malthus and his modern proponents like Ehrlich have made many dire predictions, none of which have come true. Does that mean that human population has nothing to do with human impacts on the environment? Of course not. What it does mean is that population is far from the whole story and that technology and human adaptation are also incredibly important. The Demographic Transition model suggests that the global population will eventually stabilize, or even contract. Does that mean that economic development and equal rights are the checks to population growth that Malthus called for? Perhaps. One thing we can say for sure is that these issues are far too complex for any one theory or approach to be completely correct. Keep your critical eyes open as we continue through the course!
Summary
Summary
This module was designed to introduce you to systems analysis as applied to coupled human-environment systems. A system is a collection of components that interact with each other to form some aggregated whole. A coupled human-environment system is a system in which there are both human components and environmental components which interact with each other, i.e., are coupled to each other. Here, humanity affects the environment and the environment also affects humanity. For example, landscapes are systems in which human activity interacts with the natural environment to produce specific patterns on Earth's surface.
Interactions in human-environment systems often occur in a variety of often complex ways. The complexity can often be well represented in a system diagram, which displays system components and their interactions. Systems often contain positive and negative feedback loops, such as in exponential population growth (positive) or in the population regulation that occurs when a population exceeds its ecosystem's carrying capacity (negative). A population that exceeds the carrying capacity is unsustainable, as is a system that receives a disturbance that exceeds its resilience. Disturbances (or impacts) of human activity on the environment is often conceptualized as the product of population, affluence, and technology, but many scholars have questioned this conceptualization.
References
Sources for this module include:
Adams, W.M. 2001. Green Development: Environment and Sustainability in the Third World. London: Routledge (Second edition).
Beck, U. 1992. Risk Society: Towards a new Modernity. Sage: London.
Module 3 - Environmental Ethics
Introduction
About Module 3
In Module 2, we learned some fundamentals of how humans are impacting the environment and the environment is impacting humans. These are key components of this course, but equally important to our work this semester is assessing whether these human-environment relations are sustainable. We will explore more about the concept of sustainability in this module, but as with the neomalthusian debates from Module 2, there are many competing ideas about what is (and is not) sustainable. At the heart of many of these sustainability debates (as well as many others in life) are competing ethical positions.
Ethics is a common word, and you probably associate it with intuition, concepts of right and wrong, or more formal discussions of morality. This is true. But why you feel that something is right or wrong, moral or immoral, is much more complex than intuition.
This module introduces the concepts of ethics and democracy as part of our thinking on how we should make decisions about the environment. It provides an overview of fundamental ethical views, understandings of the concept of sustainability, and the nature and role of democracy. Key concepts are introduced through readings, discussions, and activities based on important environmental topics.
What will we learn in Module 3?
By the end of Module 3, you should be able to:
- understand the relationship between ethics and science;
- explain the differences between major types of ethical positions;
- define key ethics terms: distributive justice, procedural justice, anthropocentrism, ecocentrism, speciesism, democracy;
- identify ethical viewpoints implicit in definitions of sustainability and other texts;
- develop and refine your own ethical views;
- begin to recognize how ethical viewpoints inform specific decisions we face.
What is due for Module 3?
For due dates for Module 3, please see Canvas.
There are a number of required activities associated with this module, including your first Written Assignment. The chart below provides an overview of the activities for Module 3. For assignment details, refer to the location noted.
| Requirement | Location | Submitting Your Work |
|---|---|---|
| Reading Assignment: Muir and Pinchot | Fundamentals of Normative Ethics | No Submission |
| Reading Assignments: Warner & DeCosse, Sibole, Davis | Sustainability | No Submission |
| Written Assignment 1: Arguing Environmental Ethics | Written Assignments | Submit in Canvas |
Questions?
If you have any questions, please post them to our Course Q & A discussion forum in Canvas. I will check that discussion forum often to respond. While you are there, feel free to post your own responses if you, too, are able to help out a classmate. If you have a more specific concern, please send me a message through Inbox in Canvas.
What is Ethics?
What is Ethics?
As mentioned in the introduction to this module, ethics is probably a familiar idea - things that are good or bad, right or wrong. We encounter situations every day that requires ethical thinking in this general sense. But ethics can also be defined more specifically as a framework for assigning value to things and making decisions about how to act in response to these values. As you will learn throughout this module, the general definition of ethics is very much based on the specific definition, and it is this more specific definition that we are primarily concerned with in this lesson.
Moral Philosophy

Calvin and Hobbes Cartoon.
Calvin & Hobbes are walking along and Calvin says “Whenever I need to do some serious thinking, I go for a walk in the woods.
Calvin, poking a stick at a rock says “There are always a million distractions out here.”
Calvin and Hobbes continue to walk and Calvin says “I don’t believe in ethics anymore.” “As far as I’m concerned, the ends justify the means.” “Get what you can while the getting's good. That's what I say. Might makes right! The winners write the history books.” “It's a dog-eat-dog world, so I'll do whatever I have to and let others argue about whether it's 'right' or not.”
Hobbes pushes Calvin into the mud and Calvin yells, “HEYY!!” “Why’d you do THAT?!?”
Hobbes says “You were in my way. Now you're not. The ends justify the means.”
Calvin says “I didn’t mean for EVERYONE you dolt, Just ME!”
Hobbes, walking away says “Ahh..”
Your first response to the question 'what is ethics?' might be that ethics are your moral standards that come from your religion or cultural values. And that's true. Ethics is also one of the major fields of philosophy - frequently called moral philosophy. Over the centuries, the line between categories such as 'cleric,' 'religious thinker,' and 'philosopher' have not been easily drawn, and you might be surprised to know that many of the ethical positions that you intuitively hold are based on the work of philosophers that produced their theories centuries ago. Your notions of right and wrong behavior can likely be traced to Thomas Aquinas and Immanuel Kant; your ideas of fairness, justice, and rights are at least partially formed by David Hume, Thomas Hobbes, and John Locke; even your beliefs about the qualities that constitute a 'good person' are heavily influenced by the work of Aristotle. And that list only includes Western philosophical influences!
There are three major areas within the field of ethics: metaethics, normative ethics, and applied ethics. For this course, we are primarily concerned with normative ethics, which is the branch of moral philosophy that is concerned with identifying and justifying ethical actions. Philosophers working on normative ethics focus on identifying and defining what constitutes right behavior for humans. This includes not only discussing the behaviors themselves, but also the justification for what makes the behavior right - the foundation of ethics. We will focus in on more of the specifics of normative ethics in the next section of this module, but for now let's move on to discuss value, which is at the heart of ethical foundations.
Value and Ethical Decision Making
Formal ethical viewpoints are based on logical arguments in support of certain actions. These are essentially rules for right behavior. Like all good rules, moral philosophers support their arguments with some type of evidence that serves as the foundation of their position. Ethical arguments weigh the merits of moral decisions based on the relative value of parties involved in the decision. In ethics, there are two types of value: intrinsic value and instrumental value.
A thing (a human, an animal, a tree, an ecosystem, etc.) has intrinsic value simply because it exists. If a thing has intrinsic value, ethicists argue that it has moral standing, and therefore its well-being must be taken into account in moral decision making. Nearly all ethical viewpoints consider a human life to have intrinsic value, for instance. That is why taking a human life is almost always considered unethical because there are very few situations in which the outcome outweighs the intrinsic value of that human life. Moral philosophers argue over how one comes to the conclusion that it is unethical to take a human life, but they almost all base their arguments ultimately on the fact that human life has intrinsic value. It is important to note that in ethical terms, not all things have intrinsic value. As you will hopefully see as this course continues, many of the debates about human-environment interactions and sustainability boil down to disagreements over what things have intrinsic value, and therefore moral standing.
Instrumental value is the value a thing possesses because of its usefulness to humans (or some other thing with moral standing). This is sometimes also called use value. A forest, for instance, has instrumental value to humans because it provides raw materials, a place for recreation, or perhaps some ecosystem service like carbon cycling and storage. This usefulness can and is considered in moral decision making, but it does not warrant moral standing. The intrinsic value of non-human things like forests can be a powerful motivator for conservation. However, it is also often used as justification for resource extraction that can degrade the environment. And the lack of moral standing also leads to the justification of environmental degradation because the value of human life and well-being is said to outweigh the negative impact.
Earlier we noted that the lines between religion and philosophy are not always clear, and there are some ethical theories that are justified by religion or appealing to a higher power (Natural Law theory, for instance). These are fascinating theories, but in this course, we will focus on ethical theories that base their argument on other lines of reasoning. This does not discount those theologically influenced positions. Rather, it is based on the fact that secular ethical frameworks are much more prevalent in modern thought. And in this course, we are less concerned with the ultimate source of moral authority, and more focused on understanding how differing ethical positions influence human-environment relations and cause conflict over sustainability planning.
Ethics, Science, and Sustainability
Remember in Module 1 when we discussed the value of social science perspectives in a course on sustainability? About now you might be asking the same question about ethics: why are studying ethics in a class about sustainability? Isn't that about science? The simple answer is that sustainability is about science. But let's ask another question: what is science, anyway? Another simple answer is that science is the study of the world around us through observation and analysis.
Often when we use the word 'science' we are referring to the physical sciences that focus on the non-human world. And we assume that science is objective - just the facts based on observations. The truth, though, is that how, where, and when we make our observations greatly influences what we find. And those decisions are made by humans that instinctively make value judgments that are informed by their personal experiences and ethical viewpoints. Likewise, analyzing scientific observations and making sustainability policy based on that analysis is inherently influenced by ethical viewpoints.
Sustainability is about science, but it is also about people, and wolves, and trees, and ecosystems. That makes it very much about ethics, too. In the next section, you will learn more about normative ethics, and how they can and do influence debates about sustainability.
Fun Fact!
The scientific method that is considered the bedrock of modern science and knowledge was actually developed by late 16th Century empiricist philosopher, Sir Francis Bacon.
Fundamentals of Normative Ethics
Fundamentals of Normative Ethics
Examining the study of normative ethics in more detail will better help us recognize different ethical viewpoints, and their impact on sustainability, as we move through the course.
Ethical Action
Normative ethics has three major subfields: virtue ethics, deontology, and consequentialism. We will focus on deontology and consequentialism because these two subfields are concerned with how to determine what makes ethical actions. Deontology and Consequentialism are two different approaches for determining the moral correctness of an action. Deontology considers the action in and of itself, regardless of the outcome. In many ways, deontological ethics focus on rules for right behavior. Consequentialism is an ethical framework that focuses on the end result of behavior and can justify acts such as lying, stealing, or even violence if the end result brings the most benefit to all those with moral standing.
Look back at the Calvin and Hobbes cartoon from the previous section. It's a funny illustration of the fundamental debate between deontology and consequentialism. Let's consider an example that falls within the scope of this course. Is the act of clearing forest cover fundamentally unethical? Is it acceptable to do so if the end result is more beneficial, such as preventing the spread of forest fire, or providing needed resources to humans? It is not an easy question to answer. And you've hopefully noticed that it raises an equally important ethical question: do trees (or forests) have intrinsic value? We will consider this last question in more detail in a moment.
Justice
Justice is a core concept for the study of sustainability and human-environment relations. Justice is essentially a concept of fairness, but in ethical terms, it refers to the fair treatment due to all things that have intrinsic value (and thus moral standing). In many cases, justice is defined by legal systems, but regardless of how just treatment is defined, the concept is closely related to ethics. For this course, we will focus on two particular forms of justice: distributive and procedural.
Distributive justice emphasizes the fair distribution of gains and losses across populations. Distributive justice is thus closely related to consequentialist ethics, and particularly utilitarianism. Sustainability and other environmental policies often impact different segments of a population differently. The decision to locate a mine, for instance, will have a very different (and often negative) impact on the people living and working at the selected location than those living farther away. All the people in this situation may equally benefit from the copper produced by the mine, but only those that live nearby will have to deal with pollution, or degraded drinking water often associated with mineral extraction. Often, the distribution of these positive and negative impacts closely mirrors divisions of race and class, which adds a complex but important layer to discussions of ethics and justice. The field of research and activism that focuses on the unequal impact of environmental pollution and degradation on the poor and people of color is known as environmental justice. This is an important area of distributive justice research in the field of geography.
Procedural justice is closely related to distributive justice but emphasizes how decisions are made. Procedural justice is thus mainly interested in the process of deciding which actions to take and has some overlap with deontological ethics. A core procedural justice principle is that everyone who is affected by a decision should have some say in how the decision is made. There are many ways to implement procedural justice. Democracy is one of them and we'll explore the concept in depth later in this module.
Environmental change is very challenging for procedural justice because it is very difficult to include everyone's opinions in a decision. The following reading develops this challenge further.
Consider This: O'Neill On Procedural Justice
John O'Neil is a contemporary scholar in the field of environmental politics. One topic he studies is the challenge to procedural justice posed by environmental issues. Please read the following paragraph from his 2001 article "Representing people, representing nature, representing the world":
The problems raised thus far are general problems for deliberative institutions that arise in any domain of choice, not problems peculiar to the environment. However, environmental decisions raise very particular problems for democratic theory concerning the nature and possibility of representation over and above those discussed so far. The central problem is that for many of those affected by decisions, two central features of legitimization – authorization and presence – are absent. Indeed for non-humans and future generations there is no possibility of those conditions being met. Neither non-humans nor future generations can be directly present in decision making. Clearly, representation can neither be authorized by non-humans or future generations nor can it be rendered accountable to them. The politics of presence which underlies much of recent literature in deliberative democracy is ill suited to include future generations and non-humans. In the case of current non-humans this might be regarded as untrue. Something like an Alejandro solution is possible. Consider the success of Muir’s strategy of taking Roosevelt out into the landscapes he aimed to preserve. There is a sense in which one might say that the strategy consisted in nature being represented by itself. However, while there is certainly a case more generally for taking deliberation into the places which are the object of deliberation, the articulation of any non-human interests or values here remains a human affair. The presence of non-human nature in deliberation about environmental choices requires human representation.
Authorization here means that representatives are authorized to speak or act on behalf of those they represent. For example, our elected representatives in Congress are authorized to speak or act on behalf of us. Presence here means that each group affected by a decision is in some way present in that decision. For example, our Congressional representatives are always from the district that we live in, meaning that each geographic district has some presence in the decisions made in Congress.
Given the paragraph and these definitions, what would you say is the core challenge to procedural justice posed by environmental issues?
Note that O'Neill's paper is an academic journal on environmental politics and thus may be challenging to read - except for scholars in the field of environmental politics. In general, academic journal articles are often challenging to read because they are written for experts in specific subject areas. But if you can read academic journal articles, then you have access to a very powerful and state-of-the-art portion of human knowledge.
For your reference, Representing people, representing nature, representing the world was published in the academic journal Environment and Planning C: Government and Policy, Volume 19, pages 483-500. You can read this journal and many others via Penn State's e-Journal system.
The excerpt from O'Neil's paper raises an important question for considerations of justice, and ethics in general: what would it mean to have justice for environments? Thus far, our discussion of ethics has focused on humans, particularly human individuals. What would it mean, in ethical terms, to extend moral consideration to non-humans and ecosystems? That is one of the primary concerns of the field of environmental ethics.
Anthropocentrism, Biocentrism, and Ecocentrism
As you can imagine, there is much debate among environmental ethicists as to incorporate non-humans and environments into normative ethical considerations. Many of these debates contrast several ethical viewpoints that differ in regard to what things possess intrinsic value. In this course, an important contrast is between ethical viewpoints known as anthropocentrism, biocentrism, and ecocentrism.
Anthropocentrism is an ethical perspective that holds that only humans - particularly individual humans - possess intrinsic value. And anthropocentric ethical argument considers all non-human individuals (wolves, chickens, trees, etc.), as well as collective entities like ecosystems, possess only instrumental value in so far as they are a benefit to humans. This is not to say that anthropocentrists do not advocate for conservation or environmental sustainability. Quite the contrary. But they pursue environmental protection because it maintains or expands those instrumental values for humans.
Biocentrism and ecocentrism are ethical perspectives that also afford intrinsic value to non-human things. Biocentrism, as the name implies, expands intrinsic value and moral consideration to non-human living things (animals, and sometimes plants). Like anthropocentrism, biocentrism in most cases only gives moral consideration to human and non-human individuals, and it is sometimes called moral extensionalism because it simply extends traditional anthropocentric ethics to non-humans. Ecocentrism also affords intrinsic value to non-humans, but as a collectivist ethic, it also extends moral standing to holistic entities like ecosystems or species. From an ecocentric perspective, then, both the living and non-living members of ecosystems have intrinsic value.
Keep in mind that in both of these perspectives humans also have intrinsic value, and in most cases, biocentric and ecocentric ethical perspectives do not place non-humans of ecosystems above humans. But humans are no longer morally exceptional. That means that when considering issues of distributive or procedural justice from a biocentric or ecocentric viewpoint, non-humans and ecosystems must also receive fair treatment in the decision-making process and the distribution of positive and negative environmental impacts. This brief exploration of ethics makes it clear why environmental issues that bring groups of people with anthropocentric and ecocentric ethical viewpoints into conflict can produce seemingly intractable disagreements. These ethical issues are a critical component of effective sustainability policy and action.
Reading Assignment: Muir & Pinchot
John Muir (bio) and Gifford Pinchot (bio) are major figures in the history of conservation and environmentalism in the United States. While their words are old, their classic ideas remain very relevant today. Please read:
- Chapter 16, "Hetch Hetchy Valley" from The Yosemite, by John Muir, 1912.
- The Fight for Conservation, by Gifford Pinchot, 1910.
Pay particular attention to the highlighted sections of these readings. One of these readings is considered to hold an anthropocentric perspective and the other an ecocentric perspective. Which do you think is which, and why?
Speciesism
The expansion of moral standing and consideration that comes with biocentrism and ecocentrism often introduces the concept of speciesism: the practice of giving greater moral consideration to one species over others. Speciesism is similar to racism, or sexism, but it is often much more difficult to detect. This is partly because what many call speciesism is usually humans giving greater moral consideration to other humans over non-humans. This is classic anthropocentrism, and it is very common - even instinctive. But there are many people that consider the practice of putting humans first as unethical as racial discrimination.
The concept of speciesism raises major questions. Should any species – human or otherwise – be given greater intrinsic value than any other species? On what grounds could this be? People have argued that humans are exceptional because of language and human reasoning (a position made famous by the philosopher René Descartes), emotional capacity, and other abilities. But biologists consistently find that, while humans are relatively strong in these ways, they are not unique: other animals can use language and reason or feel emotions. Thus many people argue that we should care about non-human animals similarly to how we care about humans. (We say "other animals" and "non-human animals" because (obviously) humans are classified as animals, too.)
For example, if we care about human welfare – about human happiness and suffering and life flourishing – then perhaps we should care about the welfare of non-human animals as well. Such considerations are especially important in discussions about food and agriculture, given the vast numbers of livestock animals that are alive in our food system.
You might feel like the notion of speciesism creates some intractable problems. Would a rejection of speciesism require equal legal rights and protections for all non-human animals? For trees? Must we all become vegetarians? Some ethicists and activists say yes. Others argue that there are distinctions. Philosopher Paul Taylor, for example, argues that it is immoral for a human to kill a wild animal when it is not necessary for subsistence, but in cases where the human would otherwise starve, it is permissible. He also argues that so long as livestock animals do not suffer while alive, there is no moral difference between eating that animal and eating a plant (since both possess intrinsic value). Taylor does argue for vegetarianism in most cases, however, because plant based diets allow more land to be devoted to nature (a point that is debatable). What moral consideration do we owe, then, to a living animal that is destined to be our food?
Consider This: Bentham On Speciesism
Jeremy Bentham (bio) (1748-1832) was an early and very important ethicist. He wrote many, many things throughout his life. One of his most famous writings is this passage on the issue of speciesism:The day may come when the rest of the animal creation may acquire those rights which never could have been withholden from them but by the hand of tyranny. The French have already discovered that the blackness of the skin is no reason why a human being should be abandoned without redress to the caprice of a tormentor. It may one day come to be recognized that the number of the legs, the villosity of the skin, or the termination of the os sacrum, are reasons equally insufficient for abandoning a sensitive being to the same fate. What else is it that should trace the insuperable line? Is it the faculty of reason, or perhaps the faculty of discourse? But a full-grown horse or dog is beyond comparison a more rational, as well as a more conversable animal, than an infant of a day, or a week, or even a month, old. But suppose they were otherwise, what would it avail? The question is not, Can they reason? nor Can they talk? but, Can they suffer?
From Introduction to the Principles of Morals and Legislation, second edition, 1823, chapter 17.
Is the argument here anthropocentric, biocentric, ecocentric, or something different? Do you agree with the argument? Why or why not? If we accept the argument, then what might some implications be for the human-environment issues we discuss in this course?
Moving Forward
These last few sections offer up quite a few profound ideas to ponder. As we move through the course, keep a critical eye open for the ways that differing ethical perspectives, even unconscious positions, influence debates about human uses of the environment.
Optional: Additional Reading & Ethics Terminology
There are several great resources online that explain these basic ethics concepts in much more detail. The two most comprehensive resources are Wikipedia and the Stanford Encyclopedia of Philosophy (SEP). The SEP is particularly valuable because it contains high-quality content written by experts. If you read and understand these, then you will have a strong understanding of ethics as it is relevant both to this course and much more.
Utilitarian Ethics: Watch this short video from the producers of the TV Series "The Good Place" titled "Mother Forkin' Morals with Dr. Todd May" (4:34 minutes). Utilitarian ethics is an example of consequentialism.
[Intro] Man on bus: Oh God, Michael. What did you do!
[Text on Screen]: Mother Forkin' Morals: A No Bullshirt Guide with Dr. Todd May.
Dr. Todd May, Philosphy Professor, Clemson University: My name is Todd May. I teach philosophy at Clemson University. I've been teaching philosophy for about 30 years.
[Text on Screen]: Utilitarianism It Just Works
Dr. Todd May: Utilitarian philosophy goes back a couple hundred years. Probably the first person really associated with it is an 18th-century thinker named Jeremy Bentham. And it goes up through John Stuart Mill, and it's still very big in philosophy.
Eleanor: Cool.
Dr. Todd May: It's all about the consequences of what you do. It's not about what you intend, it's not about following rules. It's about whatever your action is, the world should be a little bit better off when you're done with that action than when you started. For Bentham, it's all a matter of introducing more pleasure into the world than was there before. It's all a matter of suffering and pleasure.
Janet: Huh.
Dr. Todd May: The problem is, for a lot of folks, it isn't just about how much pleasure you can get. Let's suppose that I could design a pleasure machine for you. You go into the machine, you feel nothing but pleasure for the rest of your life. You won't be doing anything, but it's gonna feel great. Here's the proviso -- if you go into that machine, you can't come back out. You decide once and for all -- would you take the machine? And not many people would take it.
Eleanor: Really? Huh.
Dr. Todd May: When I teach in prisons, one of my classes is a group of lifers. Right, they're not going anywhere. They're gonna be in that maximum-security prison for the rest of their lives. And I've posed the question to them. I had 15 people, and I said, "Would you take that machine?" 14 of them said no. All right, because for all of them, there has to be more to life than just generating pleasure.
Michael: This is so interesting!
Dr. Todd May: You can think of utilitarians as not necessarily being about pleasure. We can think, say, of happiness, right, as a broader category. What binds all these together is that for the utilitarian, it's the consequences that count. Alright? It's not how you get there. It's where you wind up.
Michael: I think I'm really starting to get it.
Dr. Todd May: The trolley problem is one of the classic places where people think about utilitarianism and think about whether or not we ought to be utilitarian.
Chidi: You are driving a trolley, and on the track ahead of you are five workmen that you will run over. Now, you can steer to another track, but on that track is one person you would kill instead of the five. What do you do?
Dr. Todd May:Some people think of the trolley problem as a way of defending utilitarianism. "Look, if you got to kill one person to save five, that's what you ought to do". So, in one scene, Chidi is running the trolley.
Michael: There are five workers on this track and one over there. Make a choice.
Eleanor: Quick, Chidi, what's your decision?!
Chidi: I am choosing to switch tracks so that way, I only kill one person.
Dr. Todd May: But in some ways -- and the show brings this out -- it's a way of illustrating some of the problems of utilitarianism. In another scene, which comes from philosophy, instead of running over one person to save five, the question is, "Do you find a healthy person and carve them up in order to use their organs, each one for a different operation?"
Eleanor: Dude, what the fork?
Michael: These five people all need organ transplants or they will die. Eleanor's perfectly healthy. Chidi, do you want to slice her open and use her organs to save the five sick people?
Dr. Todd May: People who are willing to throw the switch to kill the one to save the five in the trolley problem generally are not gonna say yeah, it's okay to go out in the street and kill one person or harvest their organs to save five other lives.
Chidi: Although five people will die, I cannot harm one innocent person to save them. It's unethical.
Dr. Todd May: But then the question becomes "What's the difference?" Utilitarian's gonna say it's the same problem, should have the same answer. But, right, what Chidi begins to recognize in that actually may not be the same problem for reasons that are difficult to say. One seems obvious to do, and the other seems obvious not to do. And for Chidi, this becomes a very difficult thing to sort out.
Chidi: Oh, come on!
Dr. Todd May: For Jason, I guess the question is "What would Blake Bortles do?"
Jason: Jacksonville Jaguars rule!
Dr. Todd May: But for Chidi, he's got to think philosophically about this.
Michael: Why don't you just tell me the right answer?
Dr. Todd May: I would say that there may be contradictory right answers. That is to say, it's probably at least okay and maybe right to throw the switch, and it's not okay to carve up the one to save the five. But if you ask me, "Yeah, what's the difference?", I don't know what to tell you.
Eleanor: Well, that's good.
Virtue ethics: See Wikipedia's page on Virtue Ethics and SEP's page on Virtue Ethics.
Consequentialism: See Wikipedia's page on Consequentialism and SEP's page on Consequentialism.
Deontology: See Wikipedia's page on Deontological Ethics and SEP's page on Deontological Ethics.
Environmental Ethics: See SEP's page on Environmental Ethics. The Markkula Center for Applied Ethics at Santa Clara University has numerous excellent resources on environmental ethic, and much more.
Sustainability
Sustainability
At this point, you might be wondering why we would wait until the third week of class to begin defining sustainability as a concept, and why we are doing so in a module on ethics. The biggest reason is that sustainability is an incredibly complex concept in today's globalized society. The first two modules are aimed to introduce you to some of this complexity and to introduce you to some important concepts and tools to help you think critically and geographically about sustainability.
We introduce the concept of sustainability in this module on ethics because, as you have hopefully gathered, sustainability issues are inherently ethical issues. This is not to say that 'sustainable uses' of the environment are morally good and all others are bad. Consider a hydroelectric project. Its implementation would decrease the carbon footprint of electricity generation in that region (positive), but it would also have a profound impact on the environment, not to mention the people displaced by the new reservoir (negative). Sustainability policy and decision making have a profound impact on people's lives, as well as on the lives of non-humans and ecosystems. These are ethical issues. And the debates that we humans have about sustainability are shaped by our ethical perspectives.
Ethical Viewpoints on Sustainability
There are many, many definitions of sustainability. The most prominent is from the Brundtland Commission Report Our Common Future. The Brundtland Commission was organized by the United Nations in 1983, and published their report in 1987:
Sustainable development is development that meets the needs of the present without compromising the ability of future generations to meet their own needs.
Pretty vague, right? Yet this remains the most commonly used definition of sustainability. One of the problems with this definition is that it leaves significant room for ethical interpretations. Whose needs must be met now and in the future? Should sustainability be pursued by any means (i.e., consequentialism)? Below, you will read several pieces written by current philosophers on the ethical dimensions of sustainability. Keep in mind the ethics concepts that you have just learned as you read.
Reading Assignment: "The Ethical Dimension of Sustainability"
Read "The Ethical Dimension of Sustainability," by Keith Warner Douglas and David DeCosse. As you read, consider what ethical perspective the authors take in their arguments.
What do you think of their "three E's" of sustainability? Do they address all three in this article?
Warner and DeCosse do an excellent job of communicating the human dimensions of sustainability, particularly our ethical obligation to future generations. Their argument is also strikingly anthropocentric. You might have noticed that non-human nature is considered only as a resource for human use. The authors may not consider non-human nature to only have instrumental value, but that is the implication in this short article. Are there other ways to think about sustainability that avoid the anthropocentric position?
Reading Assignment: "The Ethics of Sustainability: Why Should we Care?"
Read "The Ethics of Sustainability: Why Should we Care?" by Allie Sibole.
Does Sibole take an ethical viewpoint that clearly falls within the categories that we have discussed? Why or why not?
Sibole is an eloquent writer, and she paints a compelling picture of the symbiotic relationship between humans and the rest of nature. Sibole argues for care and moral considerations of nature based on reciprocity. The Earth cares for us and we must also care for it, not just because it is in our best interests, but because it is morally right. This argument has a strong ecocentric justice current. She also calls for a displacement of ethical focus from the individual to the global community. Does this include non-humans as well? How would this collectivist ethic work for sustainability decision-making?
Reading Assignment: "Nature in Other cultures?"
Read "Nature in Other Cultures" by Bret W. Davis that was originally published on the Everyday Ethics blog at the Rock Ethics Institute at Penn State.
Davis explains why it is so important to understand cultural differences and ethical perspectives when considering sustainability issues. Studying the intersections of these cultural and ethical differences across space, time, and scale is a central part of a geographic approach to human-environment relations. Davis is very optimistic about the benefit of exploring difference, and its ability to break down barriers to conflict and improve sustainability for the future. But he does not address how such decisions should be made. In the next section, we consider democracy as an ethical approach to decision-making.
Democracy
Democracy
Our discussion of sustainability thus far has made it clear that many people, or groups of people, disagree about what constitutes sustainability, and how to achieve it. This sort of disagreement is very commonplace in our society, about a wide range of issues related to the environment and just about everything else. This makes decision making much more difficult. If we all agreed, then we could just do what we all thought was right! But when we disagree, what should we do? That's what we're considering in this last section of Lesson 3.
Let's first note that we're working within the realm of procedural justice because we're considering how decisions are made, not what decisions are made. There are many different ways of making decisions. Here we're going to discuss one of the ways, which is very common in our society: democracy.
(To clarify what democracy means, we can look at where decisions are made not in a democratic way. For example, soldiers take orders from their superiors and their superiors do not need to consult with their subordinates.)
We are probably all familiar with democracy, given its prominence in our lives. We have probably voted, or at least followed elections. We have probably also seen many discussions of the civic issues that our elected officials work on. Perhaps we have contributed to these discussions ourselves, via contacting our representatives, writing to newspapers, talking with our friends, or via some other means. Contributing to these discussions is known as using our voice. Voice and vote are two core ways of participating in democracy. They are also important aspects of human-environment geography.
Voice
When we speak out on civic issues, we are exercising our voice. We do this for several reasons. We can be letting the government know what our views are so that it can take our views into consideration. We can be arguing for our views so as to persuade our fellow citizens to agree with us. Or we can be providing information that we think is relevant to an understanding of the issue.
Voice can be a powerful factor in environmental issues. These issues are often highly complex and full of many different views. Without people speaking out, all these different facets of the issues could not be untangled and understood. Many organizations are dedicated to exercising voice on environmental issues. One of these is the Sierra Club, which is the oldest environmental non-profit organization in the United States. It was founded in 1892 by John Muir, whose ideas we read earlier in this module. The Sierra Club is very active in helping people speak out on environmental issues, as seen on the Actions page of the Sierra Club website. Another organization that is active in exercising voice on environmental issues is the American Petroleum Institute (API), which is a major trade organization for the oil industry. API funds several lobbyists whose job is to argue in favor of certain government actions. An overview of policies and issues that API is interested in can be found on API's Policy and Issues page.
As a citizen, and in particular as a Geography 30 student, you have an important voice to add to civic discussions of environmental issues. The topics that we're learning about in this course are very central to many issues, and it is important for them to be considered in discussions of the topics. Your own interpretations, ideas, and opinions on these and other topics are especially important. As you formulate your views on the issues, you should think through the ethics underlying your views, and then argue for them.
Vote
The process of discussing civic issues is ongoing, but, periodically, decisions must be made. In a democracy, the decisions are typically made through voting. Voting raises two major ethical questions. First, how should we vote? Second, who should vote, and how should the votes be counted? The first question, how we should vote, will, of course, vary from issue to issue. The second question raises some important and fundamental procedural and geographic questions worth considering in more detail.
Since who votes and how votes are counted is often determined by very well-established procedures, we often take these procedures for granted without questioning them. However, none of the procedures in use today have been around forever. At some time, decisions were made on these matters. In some places today, the decisions are still being made. These decisions are quite often very contentious and controversial, and thus should not be taken for granted.
In the United States, one of the contentious decisions concerned how members of the House of Representatives and the Senate were to be allocated. The large states wanted members allocated by population, whereas the small states wanted a fixed number of members per state. In what's now known as the Connecticut Compromise of 1787, the states decided that the House would allocate by population and the Senate would allocate by state. This means that one citizen's vote has different meaning depending on which branch the vote is for. Also, for senators, the vote will have different meaning depending on whether the citizen is in a small state or a large state.
Voting procedures often have a very strong geographic component. This is perhaps seen most visibly in the practice of gerrymandering. To gerrymander is to create an electoral district that is in a strange geographic shape so as to achieve some desired result. Often the result is to keep incumbents in office or to diminish the power of certain segments of the population. It is named after a districting scheme devised by former Massachusetts governor Elbridge Gerry; the scheme included a district which looked like a salamander:
Voting procedures are very important in many environmental issues. Within the United States, views on environmental issues often vary from region to region around the country. Midwestern and Appalachian states have a lot of coal and often favor pro-coal environmental policies. Southeastern states are exposed to hurricanes and favor policies that offer protection from or insurance for hurricanes. How votes are allocated across regions can have a large effect on which policies are produced.
Internationally, the effect of voting procedures can be even stronger. Many international or global environmental issues are products of decisions made at the national scale in which the foreigners affected by the decisions have no vote (and often also no voice). This violates a basic principle of procedural justice, but it occurs nonetheless quite often. Meanwhile, when international agreements are made, there is no established procedure for aggregating votes from different countries. International agreements are often formed mainly by certain more powerful countries, though recently many other countries have been more successful at shaping the agenda. The situation is further complicated by the fact that some countries do not have democracies, or have democracies that disenfranchise large portions of their populations. How should the world's disenfranchised citizens be represented in global environmental policies? This is an important question, but it has no easy answer. At least, we can be aware of it as we approach the environmental policy process.
Summary
Summary
This module was designed to introduce you to some fundamentals of ethics and democracy. Ethics is the study of value, and how we reason and make decisions about how to act according to those values. Important issues include how decisions should be made; what the consequences of our decisions should be; and to what extent humans, ecosystems, and nonhuman animal welfare should be considered as we make these decisions.
Sustainability is ultimately grounded in some notion of ethics because sustainability decisions have a profound effect on humans and non-humans alike. Given disagreements over ethics, we need the knowledge to constructively engage with others and a procedure for making collective decisions about human-environment issues. Democracy is often the system we use. Democracy involves both voices - speaking up with our knowledge and views - and vote. Both of these facets of democracy have strong geographic features and are quite important to human-environment systems, as is ethics in general.
Module 4 - Individual and Collective Action
Introduction
About Module 4
In Module 3, we learned some basic ethical principles related to what actions we should take with respect to the environment. In this module, we’ll learn some fundamentals of actually achieving successful (or unsuccessful) actions.
There are two main types of action: individual action and collective action. This module discusses both. In addition, through the Written Assignment associated with this module, we’ll address an imaginary situation where collective action is needed to avoid the depletion of natural resources.
Note that a lot of what we’ll learn in this module is applicable to a broad range of actions, not just actions related to the environment. How can you get your roommates to keep your apartment clean? How can societies get everyone to contribute to public services? These topics and many others are informed by the content in Module 4.
What will we learn in Module 4?
By the end of Module 4, you should be able to:
- explain the difference between individual action and collective action;
- define collective action problems, as well as a specific type of collective action problem, "the tragedy of the commons";
- explain the three types of solutions to collective action problems: government regulation, private ownership, and community self-organization;
- explain the relationship between collective action and social norms, as well as the influence of social norms on individual actions.
What is due for Module 4?
There are several required activities in this module. The chart below provides an overview of the activities for Module 4. For assignment details, refer to the location noted.
| Requirement | Location | Submitting Your Work |
|---|---|---|
|
Reading Assignment: The Tragedy of the Commons, Revisited |
Solving collective action problems | No submission |
| Reading Assignment: The Maine Lobster Marketing Collaborative | Solving collective action problems | No submission |
| Written Assignment 2: Carbon Footprints Individual vs. Collective Action | Written Assignments | Submit in Canvas |
Questions?
If you have any questions, please post them to our Course Q & A discussion forum in Canvas. I will check that discussion forum often to respond. While you are there, feel free to post your own responses if you, too, are able to help out a classmate. If you have a more specific concern, please send me a message through Inbox in Canvas.
Individual vs. Collective Action
Individual vs. Collective Action
Your actions affect the environment. For example:
- When you use a car, bus, or airplane, oil is burned, sending greenhouse gases into the atmosphere and changing the global climate. Fueling these vehicles also involves extracting oil from oil wells in the ground. (There are some exceptions: vehicles that use electricity or natural gas instead of oil, though both of these typically involve emitting greenhouse gases and extracting resources from the ground.)
- When you eat meat or other animal products that come from “factory farms” – which are most meat/animal products sold in the United States – the farming process causes several environmental impacts, including deforestation, water pollution, and greenhouse gas emission.
- When you choose where to live – including which city to live in and which neighborhood to live in within the city – there are several environmental impacts, including how much energy your residence and transportation uses and how heavily you will stress water supplies.
- When you exercise your voice or your vote in a democracy, you influence the policies that the government will take, including policies it takes on the environment.
But for each of these actions, you’re not the only person doing it. Other people drive, ride buses and airplanes, eat meat and other animal products, choose certain cities and neighborhoods, and speak up and vote in any given democracy.
Individual action refers to the actions taken by one individual person, acting based on his or her personal decisions. Collective action refers to the actions taken by a collection or group of people, acting based on a collective decision. For example, if you choose to walk instead of drive, then you are taking an individual action. Or, if you are part of a neighborhood that chooses to install sidewalks to help people there walk more, then you are involved in a collective action. Collective action often involves larger scales, since there are more people involved. However, it is possible to take individual action on large-scale issues, such as reducing greenhouse gas emissions to reduce global climate change.
One question that often comes up in the context of collective action, especially for big global environmental issues, is: Given that there are so many other people whose actions are affecting the issue, what difference do my own individual actions make? The answer is that an individual’s actions almost always still make a difference, even if there are many other people involved. For example, if you reduce your greenhouse gas emissions, there will be less climate change. To be sure, there still will be climate change. No one can prevent something as big as climate change without any collective action. But there will be less climate change, and that is something we can care about.
But an individual can also influence what collective actions are made. When you get involved in your government, or your neighborhood, or an organization, or even just a group of friends or family, you often influence what actions other people take. Likewise, other people are often influencing what actions you take. There are specific steps you can take to influence collective action. We’ll learn some of these later in this module.
Collective Action Problems
Collective Action Problems
Two concepts from ethics that we did not touch on in Module 3 are altruism (selflessness) and selfishness. Perhaps we should be altruistic and make personal sacrifices to help others. But, for better or worse, people often are at least somewhat selfish. Collective action problems arise when people are selfish and thus fail to achieve successful collective actions.
A collective action problem is a scenario in which there is conflict between the individual interest and the group interest. In the scenario, each individual in the group faces a choice to either act selfishly or cooperate. In a collective action problem it is always in the individual’s best interest to act selfishly, regardless of what the other individuals do. However, if all individuals act selfishly, then they all get worse outcomes than if they all cooperate. In other words, it is in the individual’s interest to act selfishly, but it is in the group’s interest to have everyone cooperate. This is the conflict between the individual interest and the group interest.
Environmental Collective Action Problems
Collective action problems are widespread throughout environmental issues. Usually, they involve scenarios in which individuals want to act selfishly in a way that would harm the environment, but groups would benefit from environmental protection. Here are some examples:
- Individuals often want to do things that emit a lot of greenhouse gases, but society overall may be better off with less climate change.
- Individuals often want to drive cars so as to get around faster, but driving causes more air pollution that harms the whole group. Additionally, driving can cause traffic jams, whereas public transit avoids traffic jams. The car/transit decision is often a collective action problem for travel time: each individual travels faster by driving regardless of what other individuals do, but the group will overall travel faster if everyone takes transit than if everyone drives.
- Individuals may want to harvest scarce natural resources that are up for grabs, but society overall may be better off if everyone avoids using too much of these resources.
This last example is closely related to the "tragedy of the commons". This concept has an important connection to sustainability and is worth considering in greater detail.
The Tragedy of the Commons
Have you ever been to Boston, Massachusetts? Did you visit the Boston Common?
Today, the Boston Common is a public park in downtown Boston. It is used in the same ways as any other city park: for leisurely walks, for sports, and for community events.
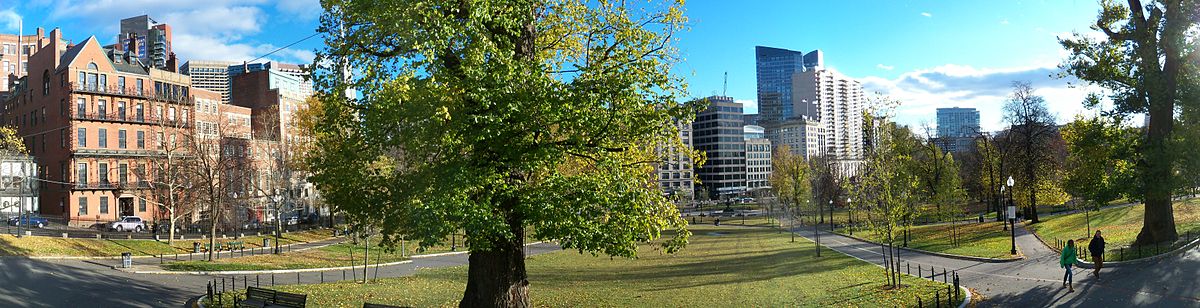
But the Common was not always used in this way. In the 1600s, long before Boston was a big city, the space was shared as a grazing pasture for cows. The cows were owned by families who lived in the area.
The cow grazing caused a collective action problem. Each individual family wanted their cows to eat as much grass from the Common as they could because then the cows would grow more and be worth more to the family. However, the Common had a finite amount of grass that could be eaten at any one time. Soon the cows were eating the grass faster than it could regrow. At this point, the grazing became unsustainable, and it was only a matter of time before the Common ran out of grass, forcing families to cease grazing their cows.
One could reasonably argue that if the families had collectively established rules for grazing and exercised moderation in their grazing practices, then the grass would not have been depleted, and the cows could have continued grazing indefinitely. However, the original idea behind the "tragedy of the commons" is that the depletion of a shared resource like the Boston Common is unavoidable due to individuals' selfish behavior.
Defining the Tragedy of the Commons
The term "tragedy of the commons" was coined by Garrett Hardin in his 1968 article published in the journal Science, titled The Tragedy of the Commons. Hardin argued that in the absence of private property rights or strict government regulation, shared resources (i.e., the commons) would ultimately be depleted because individuals tend to act selfishly, rushing to harvest as many resources as they can from the commons.
Often, but not always, certain kinds of limited natural resources are shared by communities because there are significant challenges to establishing and enforcing private property rights. These are called common-pool resources. Fish, forests, and water are good examples of common-pool resources and they are often managed by local communities with or without some government regulation.
What happened in the Boston Common is one example of the tragedy of the commons. Another important example of the tragedy of the commons is overfishing. Fish can be found in lakes, oceans, rivers, and streams, which are typically not owned by any one person. Anyone can fish in these places, so the places are a “commons" and the fish are a common-pool resource. But there is never an infinite supply of fish. Each individual fisher may want to catch as many fish as they can, but if everyone does this, then the supply of fish will be depleted. The depletion is the “tragedy," and it is unsustainable. Eventually, there will be no more fish, and no one will be able to fish anymore. On the other hand, if everyone exercises restraint and doesn’t remove too many fish, then the fish will be able to reproduce, the supply of fish will not become depleted, and fishing can persist indefinitely.
Overfishing is a major global issue. Many fish populations have become severely depleted due to overfishing. One example is the population of cod off the Atlantic coast of the United States and Canada.
Case Study: Atlantic Cod
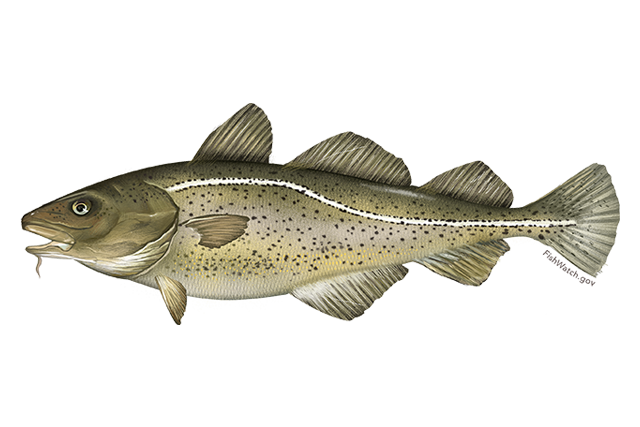
Between the mid-1970s and early 1990s, a series of poor management decisions and inadequate understanding of complex marine ecosystems led to the collapse of the cod fishery, devastation of livelihoods, a flux of environmental refugees, and long-term impacts on the northwest Atlantic ecosystem off the coast of the northern United States and Canada.
The graph below shows the amount of cod captured and taken ashore (fish landings) between 1850 and 2000. The spike in landings beginning around 1960 was caused by innovations in detecting and capturing cod.
How does that relate to the I=PAT equation?
The smaller increase in landings beginning around 1978 follows the Northwest Atlantic Fisheries Organization (NAFO)'s new program to manage fisheries by adopting fish capture quotas and determined minimum mesh sizes. Notice how both attempts to increase landings were short-lived, and today landings are as low as they've ever been.
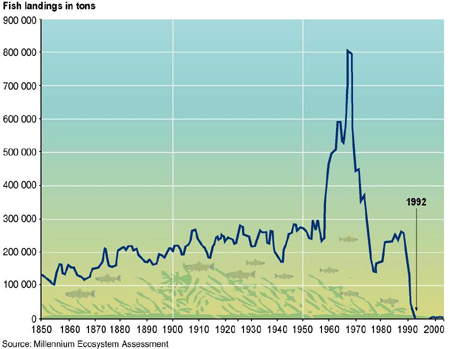
Individual action can help avoid overfishing. For example, you as a consumer can choose to not eat fish whose populations are threatened. The Monterey Bay Aquarium in Monterey, California maintains a Seafood Watch program which explains which fish populations are threatened and which are not. The program makes simple guides for each region of the country, available online. (Ask yourself this question: Why does the Seafood Watch program produce different guides for different regions of the country?)
Overfishing can result in permanent collapses in fish supplies. If a population of fish gets completely wiped out, then it cannot reproduce and regrow its numbers, even if people stop fishing entirely. In other words, the collapse can be irreversible. Irreversible collapses can be found in other instances of the tragedy of the commons, including biodiversity loss and certain ecological disruptions. But not all instances of the tragedy of the commons are irreversible. For example, overgrazing in Boston Common causes only a temporary loss of grass, since people can always grow more grass there.
Also importantly, Hardin's arguments about the tragedy of the commons have been thoroughly analyzed and critiqued. While there are several examples of the tragedy of the commons, there are also numerous counterexamples--cases in which common-pool resources are managed successfully by self-organizing communities of users, without private property rights or strict government intervention. Read on.
A Second Look at The Tragedy of the Commons
As with the neomalthusian IPAT argument, there are many critiques of Hardin's view of the inevitable depletion of the commons. The first question you should ask when considering a scenario involving the human use of a shared resource is: what is really driving resource depletion? Hardin argues that it is individual selfishness. But take a second look at the Atlantic cod example. It is true that the fishery was massively overfished, leading to a significant collapse of the cod population. But was the overfishing really driven by the individual actions of private fishers, or was it global market forces, large corporate interests, and lax environmental regulations? Remember, the fishers that were bringing in cod in the North Atlantic were not families fishing for subsistence like those keeping a few cattle on the Boston Common. Nor are they small-scale fishers. Commercial fishing like that of the North Atlantic cod is a highly capital-intensive enterprise that involves large boats, significant resources for the time at sea, and corporate contracts. So is this resource degradation a tragedy of the commons, or an inherent problem of capitalism? If you read Hardin's article in Science, you will notice that he favors, when possible, the enclosure of common resources in favor of private holdings, which is a hallmark of capitalist market economics. This is not to say that capitalism is evil, just that like any other economic system, it is not perfect. And looking past the individual fishers toward larger economic forces is a classic example of using scale in a geographic inquiry. Was it the fishers living and working in the North Atlantic that depleted the fishery, or was it economic processes operating over much larger scales? Or was it some of both?
The second thing to keep in mind when considering the tragedy of the commons is that it has been shown more often than not to be the same sort of doomsaying that we encountered with the IPAT predictions of future human tragedy. It is true that groups of humans do sometimes overuse and exhaust natural resources that could be renewable. But at least as frequently, we see examples of effective institutions for resource governance and stewardship (which we will read more about in the next section). So when seeing something that looks like a tragedy of the commons - like global climate change - perhaps it is not just a problem of individual selfishness. Perhaps an equally significant problem is that the existing systems of governance are not matched to the scale of the problem and are therefore not able to effectively foster successful cooperation.
Solving Collective Action Problems
Solving Collective Action Problems
Fortunately, as we learned at the close of the last section, we are not doomed to suffer the consequences of failing to cooperate on collective action problems. People can and often do act collectively, even if they still hold selfish ethical views.
There are three major types of solutions to collective action problems:
- Government regulation: A government can declare it against the law to act selfishly and require individuals to cooperate.
- Private ownership: If someone owns a resource, then he or she can restrict access to it. Furthermore, it will be in his or her interest to prevent the resource from collapsing.
- Community self-organization: Groups of individuals can work together to foster cooperation.
Historically, academic research on collective action problems focused on government regulation and private ownership. Researchers often assumed that without the formalized mechanisms of government and private property, individuals could not come together to cooperate. As we noted in the last section, Garrett Hardin - author of The Tragedy of the Commons - was advocating for privatization (he was also, incidentally, a neomalthusian). However, over recent years, research has shown that community self-organization can be successful – and often is. Furthermore, we now know that in many cases government regulation and private ownership fail to solve collective action problems. Much of what we know about community self-organization comes from the research of Elinor Ostrom. Ostrom was a political scientist who spent most of her career at Indiana University and Arizona State University before she passed away in 2012. For her work, Ostrom was a co-recipient of the 2009 Nobel Prize in economics – the first woman ever to receive this award.
Reading Assignment: "Tragedy of the Commons Revisited"
Please read the article "The Tragedy of the Commons Revisited" from Scientific American, available online.
As you read this, think about what factors make some types of solutions to collective action problems succeed and others fail. How might you use these insights to help solve collective action problems in your own life?
The viability of community self-organization is especially important because it is often the only option available. Governments have busy agendas and cannot consider all collective action problems. Some resources cannot be owned privately. But we can often connect with each other outside of government channels and work together to foster effective collective action.
Reading Assignment: The Maine Lobster Marketing Collaborative and Video (2:20 minutes)
So far, we have seen two examples of the tragedy of the commons: the Boston Common and the Atlantic cod fisheries. Now let's look at a successful case of community-based management of a commons: the Maine lobster fisheries.
Explore the Maine Lobster Marketing Collaborative's website and watch the video below. As you read and watch, make a mental note of the collectively designed rules that lobster fishers abide by. Reflect on the community values that may have led the Maine lobster fishers to self-organize and successfully manage their marine commons long before environmental concerns were in the mainstream. Finally reflect about self-interest and cooperation. Are the lobster fishers acting selfishly or are they cooperating? Or maybe both?
[Music]
Barton Seaver, Chef/Author: Anyone interested in food is also interested in the story behind it, and the story behind Maine lobster is as good as it gets.
[Text on Screen] Maine, USA.
Linda Greenlaw-Wessel, Lobster Fisherman: I've been lobstering on and off all my life. I got a license when I was a little kid.
Barton Seaver: Maine New Shell Lobster and the Maine lobster fishery as a whole is an incredibly sustainable undertaking. In fact, it's an example of what a sustainable fishery should look like.
Sonny Beal, Lobster Fisherman: There could be a perfect fishery, and we've implemented many measures to take care of our resources.
Frank Gotwals, Lobster Fisherman: Two really critical sustainability measures that are in place relate to female lobsters. One measure is that we return all of the egg-bearing females back into the water. The state of Maine is the only place that has the v-notch law. If you catch a female lobster, you put a v-notch in one of her fins, marking her as a breeder. Not only do you return those with eggs, but you also return proven breeders, allowing them the opportunity to breed again. Another significant measure in Maine is the oversized measure.
Linda Greenlaw-Wessel: In Maine, you throw back the small lobsters and the big ones. So it's a slot you have to fill.
Frank Gotwals: Making sure that you have a viable population that's always growing into the legal size and also a viable breeding population.
Linda Greenlaw-Wessel: And that's also been very good for the health of the industry. To me, the lobster fishing industry is more of a harvest and not a fishing. Really, you're growing an industry.
Frank Gotwals: You know, what I'd like to see is the kind of opportunity that this presents for people to make a living to go on indefinitely.
Linda Greenlaw-Wessel: I like the way I feel when I'm on the water. I love being aboard a boat. I love fishing. I've been doing this all my life.
Frank Gotwals: It would be nice to think that, you know, 50 years from now, that there would still be a pocket of this type of work available for those who really are meant to do it.
Sonny Beal: I take great pride in being a lobsterman. I mean, there's no better job in the world.
Damon Beal, Lobster Fisherman: It's been going on for four generations—Dad, Grampy Ossi, Grampy Eddy. I want to keep doing it. I mean, just like dad, keep the generation going on, pass it down to my sons.
Social Norms
One important component of community self-organization is the establishment of social norms.
Social norms are views or practices that a group of individuals considers to be normal. They are “unwritten rules” that a group of people, a community, or society adhere to. Social norms define our default behaviors. Tipping your server in a restaurant in the U.S. is a good example of a social norm. You are not required to leave a tip by law, and it is generally not included in the bill, but it is so expected that servers are often paid very low hourly wages based on the assumption that they will earn tips. And failing to tip - even if you are from another country where tipping is not the norm - can be taken as an offense.
Consider This: Cycling as a Social Norm in Copenhagen
Copenhagen has a strong tradition for people to cycle. The Danish capital is world famous for its cycling culture, but the bike culture of Copenhagen was threatened in the 1960s with the advent of car culture. People in Copenhagen have spent several decades seeking ways to “take the city back” and reestablishing the bike as a most popular means of transport.
Please watch the following 5-minute video.
Mikael Colville-Anderson, Denmark's Bicycle Ambassador: We're here in Copenhagen. Welcome to Copenhagen. Climate conference is in full swing at the moment.
And we're standing here on what is regarded as the busiest bicycle street in the Western world. We have a long proud tradition of cycling in Denmark, and in Copenhagen. It all started to disappear in the 1960s, with the advent of car culture.
We've spent the last 30 years working hard towards re-establishing the bicycle as a feasible and acceptable form of transport here in the city.
We can see here, we're standing next to one in the city of Copenhagen's bicycle counters. And there's two reasons for implementing these bicycle counters in Copenhagen. One of them is, that the data that is gathered here is transmitted to the city-- so they can track patterns, weather patterns-- if it's snowing, how many people are riding today, or what not.
But it's also to instill a form of civic pride in Copenhagen. Because you know what, we don't notice the bicycles. The bicycles are tools for us. It's the quickest way to get around the city.
So instilling the kind of civic pride in Copenhageners. Hey, you know what, you live in the world's cycling capital, and look how many people are riding. And hopefully this will encourage more people to ride.
In Copenhagen at the moment, we have 37% of all commuters choosing to bicycle to work, or to educational institutions, or schools, or whatnot-- 37%. Actually, if you look at the number of all trips by bike-- to the supermarket, to the cinema-- we're up to 55% in the city of Copenhagen. But we're actually working towards increasing these numbers. We want the number of commuters on bike up to 50% by 2015.
We're going to take a ride around Copenhagen and see some of the infrastructural things that we were doing to encourage more people to cycle, and to keep our cyclists safe. And this street here is called Norrebrogade-- Northbridge Street. And we're going to take a ride up here, because this is actually quite a well-known street this year, and the last couple of years-- from an urban planning perspective, and a bicycle planning perspective.
You can see on this stretch-- this is the busiest bicycle street in the Western world-- over 38,000 cyclists. But what we've done, first of all, is on some of the busy stretches we've doubled the bike lanes. We took another lane away from the cars. And we have a double bike lane here to accommodate the enormous amount of traffic.
This is the first place in the world where we created the green wave for cyclists. For six kilometers into the center of the city, all the traffic lights are coordinated for bikes. You have to ride 20 kilometers an hour. If you do that, you're not going to put a foot down all the way to the center of the city.
The evolution of our bicycle culture and our bicycle infrastructure-- it's always evolving. We're always working on improving safety, improving the mobility of the bicycles. At a lot of intersections, we have pre-greens, we call them, where the lights for bicycles turn green seconds before the car.
It's between two seconds, and in some cases up to 12 seconds before the cars. And this is just to allow the bicycle traffic to start flowing. But every intersection is individual.
This intersection used to be one of the most dangerous intersections in Denmark. 15 serious accidents a year in this intersection here by the lake. So now, we've reduced it to one serious accident a year, which is absolutely amazing.
And this is brand new from last week, is that we've introduced LED lights on our bicycle infrastructure, to help avoid right-turn conflicts between cars and bikes. So what we have is, these flashing lights that indicate that a bicycle is on the way through the intersection. So it's only visible to cars and their side mirrors. They're not visible for the cyclists who are riding, because we would rather have them looking at the traffic.
So now you can see they've turned off. The cyclists have stopped, and the cars are allowed to turn. One of the things that makes Copenhagen very unique is, the number of cargo bikes that we have here. When so few people own cars, we still need to transport various things around. In Copenhagen, there's about 30,000 cargo bikes on the streets every day. These are really our SUVs. You cannot live without them.
The bike I've been riding on today-- I pick up my two kids every day from school and daycare, and go to the supermarket and whatnot. So the problem with these is, that they're expensive. You don't really want to leave them on the street. The city of Copenhagen has a new initiative, which they're just test driving at the moment. And this is a way to give our cargo bikes a place to park on the street.
It's a car, but there's cargo bikes in it. And it's locked, and it's secured. And we took away one parking spot for cars by implementing this here. So there's room for four people to park, where there used to be only room for one.
If you make the bicycle the quickest way to get around the city for the citizens-- with separated bicycle infrastructure, with lots of initiatives for the bicycle-- you're going to get everybody and their dog to do it. And they're going to do their bit for the environment, and for reducing pollution in the city. And all the good things-- and for the public health.
I hope we can inspire other cities to do the same - implementing the bicycle as a respected and accepted and feasible form of transport. And really, this is bicycle culture 2.0. The bicycle wasn't invented yesterday. All cities in the world used to have bicycles as a main feature on the urban landscape.
We did it again here in Copenhagen. Other cities are doing it again. It's possible for every city in the world.
The video conveys one important message - that Copenhagen's cycling haven was not designed and constructed overnight. Through many years of community-led efforts, the city now boasts some of the most extensive infrastructures for cyclists and most bicycle-friendly practices thanks to the consistency in prioritizing cyclists on the street.
In addition, cycling is considered as a basic skill in Copenhagen. Most children are taught to ride a bike at home and they can cycle by the time they start school. All this helps make cycling an ingrained part of Copenhagen’s culture and (re)establishes cycling as a social norm in Copenhagen. Given how strong this social norm is, it is easy to forget that this wasn’t always the case and that quite a lot of citizen effort was required to make Copenhagen what it is today.
The fact that the citizens of Copenhagen achieved so much is encouraging to citizens of other cities who are interested in achieving similar results. While the car has become the dominant mode of transport in today’s society, one of the keys to the establishment of a new social norm is the integration of public and stakeholder engagement in creating an enabling environment for normalizing cycling as part the culture of the city.
This simple procedure can be very effective in small communities, such as the ones we live in. But what about our home planet? Do the procedures work at larger scales? Big global environmental issues like climate change (Module 9) and biodiversity loss (Module 10) present very challenging collective action problems due to their massive scale. These issues involve billions of people across the entire planet. We simply cannot establish one single social norm for so many people! However, we can still use social norms to promote cooperation, even if the social norms affect only a small portion of the relevant individuals.
Summary
Summary
Our actions have large impacts on the environment. These actions include individual actions taken by one person and collective actions taken by groups of people. While we can make a difference through our individual actions, collective actions pose some distinct challenges worthy of dedicated attention. In particular, collective action problems occur when individual interest conflicts with group interest. One type of collective action problem is the tragedy of the commons, which involves the sustainability of natural resources. Collective action problems such as the tragedy of the commons can be avoided. The three main types of solutions are government regulation, private ownership, and community self-organization. Depending on interactions with larger-scale factors, such as global market forces and climate change, any of these basic solutions may not be sufficient on its own.
Module 5 - Development
Introduction
About Module 5
In Modules 1-4, we learned key concepts that appear throughout the course and in human-environment interactions in general. Module 1 introduced the geographer’s perspective on the world and explained why we would study the natural environment in a social science course. Module 2 introduced systems thinking, which is invaluable for mentally managing the complexity of human-environment systems. Module 3 introduced ethics, which underlies all decisions concerning what we should do about the environment. Module 4 introduced individual and collective action to help us understand how we can successfully make a difference.
In Module 5, we transition from a more abstract discussion of concepts towards a more applied discussion of select human-environment topics by covering the concept of development. We begin by considering what development is. We then examine development around the world both today and throughout history. We then consider some downsides to development and conclude with a discussion of sustainable development.
What will we learn in Module 5?
By the end of Module 5, you should be able to:
- explain the meanings of and differences between each of several definitions of development;
- describe major trends in development around the world;
- explain the environment's role in human development throughout history and today;
- define the concept of environmental determinism and discuss its merits and limitations;
- discuss advantages and disadvantages of various forms of development;
- define sustainable development.
What is due for Module 5?
There are a few required readings in this module. There is no Written Assignment with this Module; although the Written Assignment in the next module will require you to engage material from this module.
| Requirement | Location | Submitting Your Work |
|---|---|---|
| Reading Assignment: Did the BP Oil Spill Increase US GDP? | What is Development? | No submission |
| Health Disparities in Black and White | Development's Downsides | No submission |
Questions?
If you have any questions, please post them to our Course Q & A discussion forum in Canvas. I will check that discussion forum often to respond. While you are there, feel free to post your own responses if you, too, are able to help out a classmate. If you have a more specific concern, please send me a message through Inbox in Canvas.
What is Development?
What is Development?
As a geographically literate scholar and citizen, you should be following current events around the world. If you do this, you will undoubtedly hear many discussions of development. You’ll hear discussions of some countries that are “developing” and other countries that are “developed.” You might also hear terms like “First World” and “Third World.” You’ll also hear about how well development in the United States or other countries is going at any given time. Finally, you’ll hear discussions of certain types of development, such as sustainable development. But what does all this mean?
It turns out that “development” does not have one single, simple definition. There are multiple definitions and multiple facets to any one definition. There are also multiple, competing opinions on the various understandings of what “development” is. Often, “development” is viewed as being a good thing, and it is easy to see why. People in “developed” countries tend to have longer lives, more comfortable housing, more options for careers and entertainment, and much more. But whether or not “development” is good is ultimately a question of ethics. Just as there are multiple views on ethics, there are multiple views on whether or not “development” is good. Later in this module, we’ll see some cases in which “development” might not be considered to be good.
The simplest and most common measures for development are those based on monetary statistics like income or gross domestic product (GDP, which measures in monetary terms how much an economy is producing). These monetary statistics are readily available for countries and other types of places across the world and are very convenient to work with. Likewise, it is easy to find a good map of these statistics, such as this one of GDP:
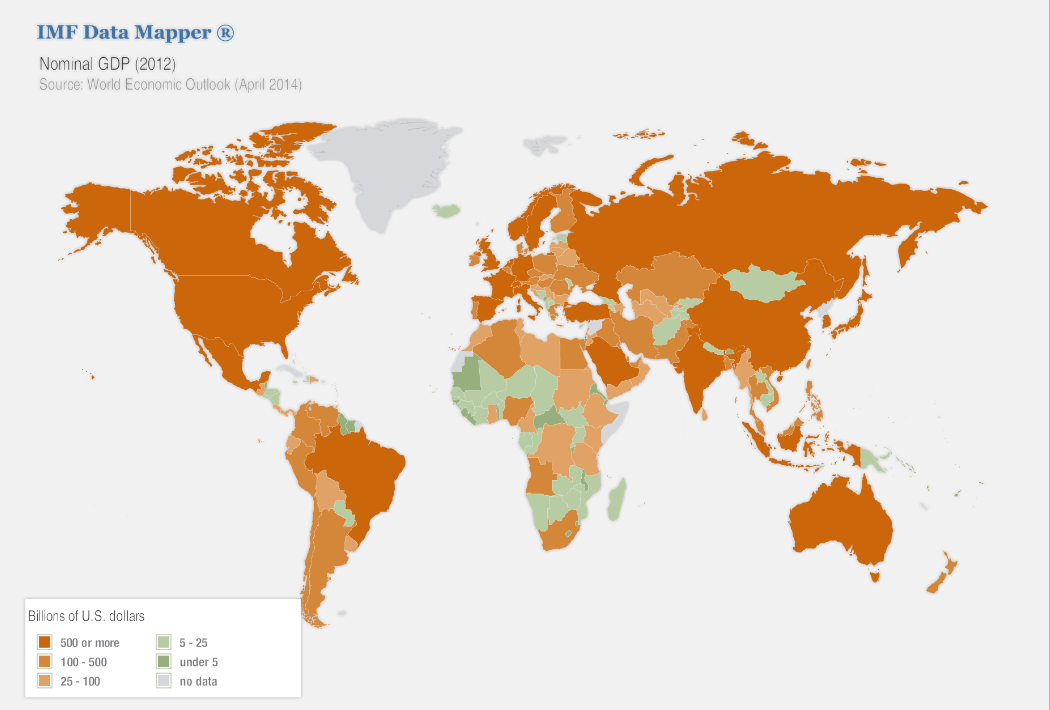
Take a quick glance at the map in Figure 5.1. What do you see? Does anything interesting stand out? We’ll revisit the map later in the module.
But statistics like income and GDP are controversial. One can have a high income or GDP and a low quality of life. Simply put, there’s more to life than money. Furthermore, monetary statistics often overlook important activities that don’t involve money, such as cooking, cleaning, raising children, and even subsistence farming. These activities are often performed by women, so a focus on monetary statistics often brings large underestimates of the contributions of women to society. Finally, high incomes and GDPs are often associated with large environmental degradation. From an ecocentric ethical view, that is a problem.
Another way of looking at development is one based on health statistics such as life expectancy or child mortality. These statistics show another facet of development. In many cases, those with a lot of money also have better health. But this trend does not always hold. Take a look at this life expectancy map:
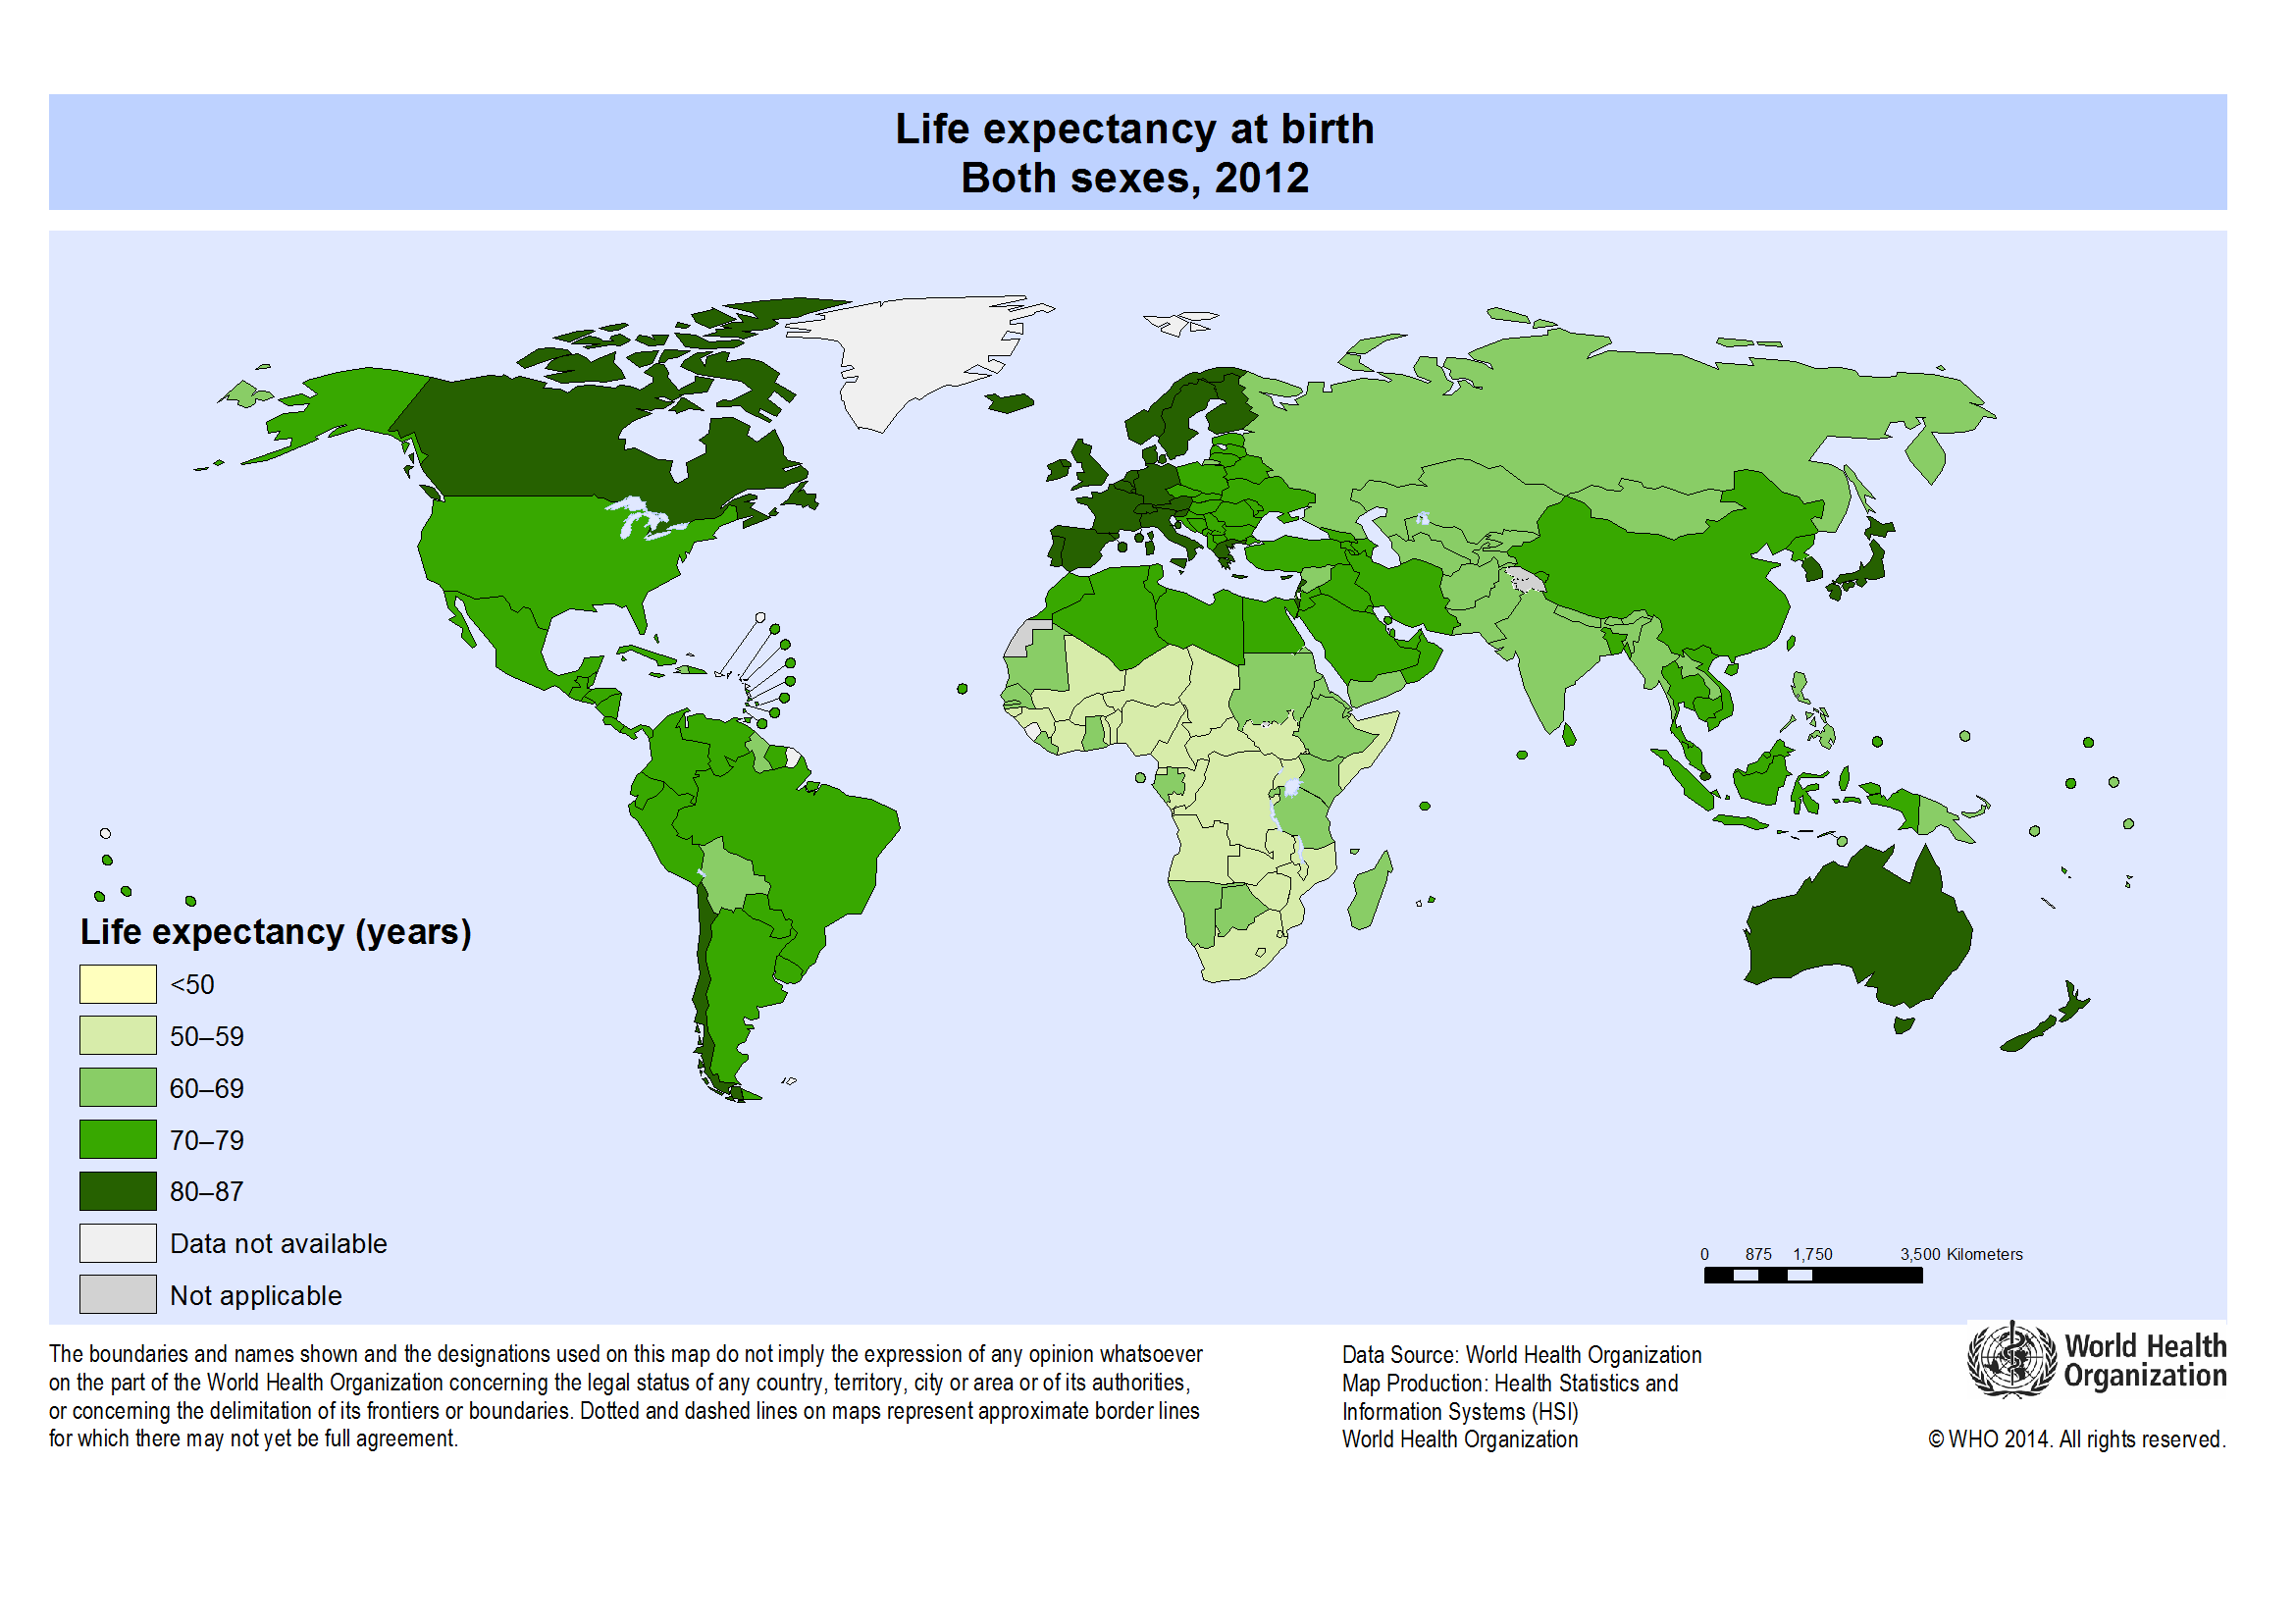
How does the Life Expectancy map in Figure 5.2 compare to the GDP map (Figure 5.1)? What patterns are similar? Is there anything different? Why might this be?
A third way of looking at development is one based on end uses. End uses are the ultimate purposes of whatever our economies are producing. For example, the end uses of agriculture are proper nutrition, tasty eating experiences, and maybe a few other things like the socializing that occurs during meals. The end uses of the construction of buildings involve things like having places for us to be in that are comfortable, productive, and beautiful. For transportation, end uses are being in the places we want to be.
Take a look at the following undernourishment map: How does this map compare to the GDP and Life Expectancy maps? What patterns are similar? Is there anything different? While most of the world's undernourished live in low-income countries, is there an exception?

Reading Assignment: Did the BP Oil Spill Increase US GDP?
Please look at the article “Oil Spill May End Up Lifting GDP Slightly” by Luca Di Leo of the Wall Street Journal.
Unless you have a subscription to the WSJ, you will only be able to read the first couple paragraphs, but that is enough to start thinking about the different understandings of what “development” is, in particular, monetary statistics and end uses. Which understandings are better? Is development a good thing? What is it that society should aim for?
At the core of this discussion of development is one very fundamental question: What is it that we ultimately care about as a society? If we ultimately care about money, then the monetary statistics are good representations of development, and we should be willing to make sacrifices of other things in order to get more money. Or, if end uses are what we ultimately care about, then it is important to look beyond monetary statistics and consider the systems of development that bring us the end uses that we want. Modules 6 and 7 do exactly that.
Consider This: A Note On Terminology
Before continuing, let’s pause for a brief note on terminology. Though they are often used as such, the terms First World and Third World are actually not intended to be development terms. Instead, they are a legacy of the Cold War. The First World was the group of major capitalist countries, led by the United States. The Second World was the group of major communist countries, led by the Soviet Union. The collapse of the Soviet Union explains why we don’t hear the term Second World much anymore. Finally, the Third World was everyone else, who were viewed as relatively unimportant to the Cold War. These days, the terms First World and Third World are often used not for the politics of the Cold War but for conversations about development. This use of the terms is inappropriate and should be avoided. Another common set of terms is the developing world and the developed world. These terms fit better, though they’re still not perfect. In particular, no part of the world has stopped developing, so, in some sense, all countries are developing countries. Finally, there are no clear divides between the more-developed countries and the less-developed countries, and there are also multiple ways of defining and measuring development. So, a safer choice is to use terms that precisely describe the type of development you intend, such as "high-income countries" and "low-income countries."
World Development Today
World Development Today
Let’s begin by viewing a video (about 20 minutes) about global demographics.
Consider This: Hans Rosling, Rockstar Demographer
Hans Rosling is a Swedish demographer and teacher who has gained global fame through lively videos about global demographics, in particular at the TED conferences. If you’re not already familiar, TED is a wonderful resource of entertaining and informative talks from a great variety of people. Here’s a TED talk from Rosling (20:35):
HANS ROSLING: About 10 years ago, I took on the task to teach global development to Swedish undergraduate students. That was after having spent about 20 years, together with African institutions, studying hunger in Africa. So I was expected to know a little about the world. And I started, in our medical university, currently in [INAUDIBLE] Institute, an undergraduate course called Global Health.
But when you get that opportunity, you get a little nervous. I thought, these students coming to us actually have the highest grade you can get in Swedish college systems. So I thought maybe they know everything I'm going to teach them about. So I did a pretest when they came.
And one of the question, from which I learned a lot, was this one-- which country has the highest child mortality of these five pairs? And I put them together so that in each pair of country, one has twice the child mortality of the other. And this means that it's much bigger, the difference, than the uncertainty of the data. I won't put you at a test here, but it's Turkey, which is highest there, Poland, Russia, Pakistan, and South Africa.
And these were the results of the Swedish students. I did it so I got a confidence interval, which was pretty narrow. And I got happy, of course-- at one point, eight right answer of the five possible. That means that there was a place for a professor of international health and for my course.
[LAUGHTER]
But one late night, when I was compiling the report, I really realized my discovery. I have shown that Swedish top students know statistically significantly less about the world than the chimpanzees.
[LAUGHTER]
Because the chimpanzee would score half right. If I gave them two bananas with Sri Lanka and Turkey, they would be right half of the cases. But the students are not there. The problem for me was not ignorance. It was preconceived ideas. I did also an unfair, unethical study of the professors of the [INAUDIBLE] that hands out the Nobel Prize in medicine, and they are on par with the chimpanzee there.
[LAUGHTER]
So this is where I realized that there was really a need to communicate. Because the data of what's happening in the world and the child health of every country is very well aware. So we did the software which displays it like this. Every bubble here is a country. This country over here is-- this is China. And this is India. The size of the bubble is the population.
And on this axis here, I put fertility rate. Because my students, what they said when they looked upon the world, and I asked them, what do we really think about the world? Well, I first discovered that their textbook was Tintin mainly. And they said the world is still we and them. And we is Western world, and them is third world. And what do you mean with Western world? I said. Well, that's a long life and small family. And third world is short life and large family.
So this is what I could display here. I put fertility rate here-- number of children per woman, one, two, three, four, up to about eight children per woman. We have very good data since 1962, 1960 about, on the size of families in all country. The error margin is narrow. Here, I put life expectancy at birth from 30 years, in some countries, up to about 70 years.
And in 1962, there was really a group of countries here that was industrialized countries. And they had small families and long lives. And these were the developing countries. They had large families, and they had relatively short lives.
Now, what has happened since 1962? We want to see the change. Are the students right, it's still two types of countries? Or have these developing countries got smaller families, and they live here? Or have they got longer lives and live up there? Let's see. We start the world. And this is all the UN statistic that has been available.
Here we go. Can you see there? In China, they're moving against better health. They're improving there. All the green Latin American countries--
[LAUGHTER]
--they are moving toward smaller families. Your yellow ones here are the Arabic countries, and they get larger families, but they-- no, longer live, but not larger families. The Africans are the green, down here. They still remain here. This is India. Indonesia is moving on pretty fast. And in the '80s, here, you have Bangladesh still among the African countries there.
But now Bangladesh, it's a miracle that happens in the '80s.
[LAUGHTER]
The moms start to promote family planning, and they move up into that corner. And in '90s, we have the terrible HIV epidemic, that takes down the life expectancy of the African countries. And all the rest of them all moves up into the corner, where we have long lives and small family, and we have a completely new world.
[APPLAUSE]
Let me make a comparison directly between United States of America and Vietnam. 1964-- America had small families and long life. Vietnam had large families and short lives. And this is what happens-- the data during the war indicate that, even with all the death, there was an improvement of life expectancy. By the end of the year, the family planning started in Vietnam, and they went for smaller families. And the United States, up there, is getting for a longer life, keeping family size.
And in the '80s now, they give up Communist planning, and they go for a market economy. And it moves faster even in social life. And today, we have, in Vietnam, the same life expectancy and the same family size, here in Vietnam, 2003, as in the United States, 1974, by the end of the war. I think we all, if we don't look in the data, we underestimate the tremendous change in Asia, which was in social change before we saw the economic change.
So let's move over to another way here in which we could display that distribution in the world of the income. This is the world distribution of income of people-- $1, $10, or $100 per day. There's no gap between rich and poor any longer. This is a myth. There's a little hump here, but there are people all the way. And if we look where the income ends up, the income-- this is 100% of world's annual income, and the richest 20%, they take out of that about 74%. And the poorest 20%, they take about 2%.
And this shows that the concept developing countries is extremely doubtful. We sort of think about aid like these people here giving aid to these people here. But in the middle, we have most of world population. And they have now 24% of income. We heard it in other forms. And who are these? Where are the different countries?
I can show you Africa. This is Africa-- 10% of world population most in poverty. This is OECD, the rich country, the country club of the UN, and they are over here on this side; and quite an overlap between Africa and OECD. And this is Latin America. It has everything on this earth, from the poorest, to the richest, in Latin America.
And on top of that, we can put East Europe. We can put East Asia, and we could South Asia. And how did it look like, if we go back in time, to about 1970? Then there was more of a hump. And we have most who lived in absolute poverty were Asians. The problem in the world was the poverty in Asia.
And if I now let the world move forward, you will see that, while population increased, there are 100s of millions in Asia getting out of poverty and some others get into poverty. And this is the pattern we have today. And the best projection from the World Bank is that this will happen. And we will not have a divided world. We will have most people in the middle. Of course, it's a logarithmic scale here.
But our concept of economy is growth with percent. We look upon it as a possibility of percent of increase. If I change this, and I take GDP per capita instead of family income, and I turn these individual data into regional data of gross domestic product, and I take the regions, down here, the size of the bubble is still the population. And you have the OECD there, and you have sub-Saharan Africa there.
And we take off the Arab states there, coming both from Africa and from Asia, and we put them separately. And we can expand these axes. And I can give it a new dimension here by adding the social values, the child survival. Now I have money on that access, and I have the possibility of children to survive there. In some countries, 99.7% of children survive to 5 years of age, others only 70.
And here, it seems that there is a gap between OECD, Latin America, East Europe, East Asia, Arab states, South Asia, and sub-Saharan Africa. The linearity is very strong between child survival and money. But let me split sub-Saharan Africa. Health is there and better health is up there. I can go here, and I can split sub-Saharan Africa into its countries. And when it bursts, the size of each country bubble is the size of the population-- Sierra Leone down there, Mauritius up there.
Mauritius was the first country to get away with trade barriers. And they could sell their sugar, they could sell their textiles, on equal terms as the people in Europe and North America. There's a huge difference between in Africa. And Ghana is here in the middle; in Sierra Leone, humanitarian aid; here in Uganda, development aid; here, time to invest; there, you can go for holiday. It's a tremendous variation within Africa, which we very often make that it's equal everything.
I can split South Asia here. India is the big bubble in the middle, but huge difference between Afghanistan and Sri Lanka. And I can split Arab states. How are they? Same climate, same culture, same religion-- huge difference, even between neighbors; Yemen's civil war, United Arab Emirates money, which was quite equal and well used, not as the myth is. And that includes all the children of the foreign workers who are in the country.
Data is often better than you think. Many people say that data is bad. There is an uncertainty margin, but we can see the difference here-- Cambodia, Singapore. The differences are much bigger than the weakness of the data. East Europe, Soviet economy, for a long time, but they come out of the 10 years very, very differently. And there is Latin America. Today we don't have to go to Cuba to find a healthy country. In Latin America, Chile will have a lower child mortality than Cuba within some few years from now.
And here, we have high income countries in the OECD. And we get the whole pattern here of the world, which is more or less like this. And if we look at it, how it looks, the world, in 1960, it starts to move. 1960-- this is Mao Zedong, he brought health to China. And then he died. And then Deng Xiaoping came and brought money to China and brought them into the mainstream again.
And we have seen how countries move in different directions like this. So it's sort of difficult to get an example country which shows the pattern of the world. But I would like to bring you back to about here, at 1960. And I would like to compare South Korea, which is this one, with Brazil, which is this one-- the label went away from me here-- and I would like to compare Uganda, which is there.
And I can run it forward like this. And you can see how South Korea is making a very, very fast advancement, whereas Brazil is much lower. And if we moved back again here, and we put on trails on them, like this, you can see, again, that the speed of development is very, very different. And the countries are moving, more or less, in the same rate as money and health.
But it seems you can move much faster if you are healthy first than if you are wealthy first. And to show that, you can put on the way of United Arab Emirates. They came from here, a mineral country. They catch all the oil. They got all the money. But health cannot be bought at the supermarket. You have to invest in health. You have to get kids into schooling. You have to train health staff. You have to educate the population.
And Sheik Sayad did that in a fairly good way. And in spite of falling oil prices, he brought this country up here. So we got a much more mainstream appearance of the world, where all countries tend to use their money better than they used in the past.
Now, this is more or less if you look at the average data of the countries. They are like this. Now, that's dangerous, to use average data, because there's such a lot of difference within countries. So if I go and look here, we can see that Uganda, that today is where South Korea was 1960. If I split Uganda, there's quite a difference within Uganda. These are the quintiles of Uganda. The richest 20% of Ugandans are there. The poorest are down there.
If I split South Africa, it's like this. And if I go down and look at Niger, where there was such a terrible famine lastly, it's like this. The 20% poorest of Niger is out here, and the 20% richest of South Africa is there. And yet, we tend to discuss on what solutions there should be in Africa. Everything in this world exists in Africa.
And you can't discuss universal access to HIV for that quintile up here with the same strategy as down here. The improvement of the world must be highly contextualized. And it's not relevant to have it on a regional level. We be much more detail.
We find that students get very excited when they can use this. And even more, policymakers and the corporate sectors would like to see how the world is changing. Now, why doesn't this take place? Why are we not using the data we have? We have data in the United Nation, in the national statistical agencies, and in universities in other non-governmental organization. Because the data is hidden down in the databases.
And the public is there, and the internet is there, but we have still not used it effectively. All that information we saw changing in the world does not include publicly-funded statistics. There are some web pages like this, but they take some nourishment down from the databases. But people put prices on them, stupid passwords, and boring statistics.
[LAUGHTER]
And this won't work.
[APPLAUSE]
So what is needed? We have the databases. It's not a new database you need. We have wonderful design tools, and more and more are added up here. So we started a nonprofit venture, which we called linking data to the design. We call it Gapminder, from London Underground, where they warn you, mind the gap. So we thought Gapminder was appropriate.
And we started to write software which could link the data like this. And it wasn't that difficult. It took some person years. And we have produced animations. You can take a dataset and put it there. We are liberating UN data. Some few UN organizations, some countries, accept that their databases can go out on the world. But what we really need is, of course, a search function, a search function where we can copy the data up to a searchable format and get it out in the world.
And what do we hear when we go around? I've done anthropology on the main statistical units. Everyone says it's impossible, this can't be done. Our information is so peculiar indeed, so that cannot be searched as other can be searched. We cannot give the data free to the students, free to the entrepreneurs, of the world. But this is what we would like to see, isn't it?
The publicly funded data is down here, and we would like flowers to grow out on the net. And one other crucial point is to make them searchable, and then people can use the different design tool to animate it there. And I have a pretty good news for you. I have good news that the present new head of UN statistic, he doesn't say it's impossible. He only says, we can't do it.
[LAUGHTER]
And that's a quite clever guy, huh?
[LAUGHTER]
So we can see a lot happening in data in the coming years. We will be able to look at income distributions in completely new ways. This is the income distribution of China, 1970. This is the income distribution of the United States, 1970-- almost no overlap, almost no overlap. And what has happened? What has happened is this-- that China is growing. It's not so equal any longer, and it's appearing here, overlooking the United States, almost like a ghost, isn't it? It's pretty scary.
[LAUGHTER]
But I think it's very important to have all this information. We need really to see it. And instead of looking at this, I would like to end up by showing the internet users per 1,000. In this software, we access about 500 variables from all the countries quite easily. It takes some time to change for this. But on the axises, you can quite easily get any variable you would like to have.
And the thing would be to get up the databases free, to get them searchable, and with a second click, to get them into the graphic formats, where you can instantly understand them. Now, the statisticians doesn't like it, because they say that this will not show the reality. We have to have statistical analytical methods. But this is hypothesis generating.
I end now with the world-- there, the internet are coming. The number of internet users are going up like this. Is the GDP per capita. And it's a new technology coming in, but it amazingly how well it fits to the economy of the countries. That's why the $100 computer will be so important.
But there's a nice tendency. It's as if the world is flattening off, isn't it? These countries are lifting more than the economy, and will be very interesting to follow this over the year, as I would like you to be able to do with all the publicly funded data. Thank you very much.
NARRATOR: What if great ideas weren't cherished? What if they carried no importance or held no value?
There is a place where artistic vision is protected, where inspired design ideas live on, to become ultimate driving machines.
Rosling makes several important points in this video:
- Many of us have misperceptions about global demographic data such as child mortality.
- The variation within regions (such as sub-Saharan Africa) and within countries can be larger than the variation between different regions or countries.
- The divide between the more-developed and less-developed countries no longer exists. Instead, there is a continuum of development around the world with no gap in the middle.
- Quality visualization is essential for understanding and communicating demographic data.
All of these points are important for Geography 30.
Now, let's take a look at the map of GDP per capita, of course bearing in mind the limitations of the GDP statistic.
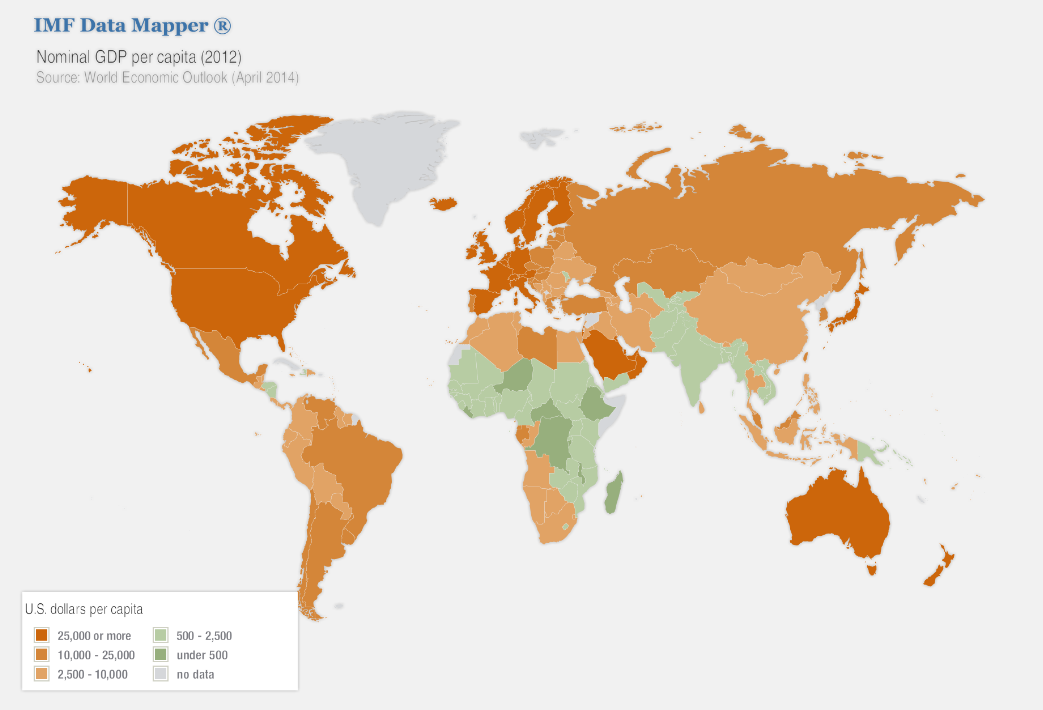
Click link to expand for a text description of Figure 5.4
A few points are worth making about this map. First, the map shows GDP per capita, i.e., per person. Per capita statistics are usually more helpful for showing what’s going on in a place. Recall the map of world GDP from the previous page. That map would show, for example, that China has a much larger GDP than, say, Switzerland. But that is because China has a much larger population than Switzerland, not because China has reached a more advanced level of development. Most people would consider Switzerland to be more developed than China.
Second, the wealthier areas are North America, Western Europe, Australia, New Zealand, Japan, South Korea, and a few countries in the Middle East. These are the countries that are commonly considered to be “developed.” The rest of the countries are commonly considered to be “developing.” But there is no clear divide between “developed” and “developing” visible on this map. Instead, there are countries at all points along the continuum from “developed” to “developing.”
Third, there are a few places on the map that are colored gray. These are places where no data is available. Usually, there is an interesting reason for data as basic as GDP to be unavailable. The map here uses data from the International Monetary Fund (IMF), so the gray represents places that the IMF has no data for. Here are probable reasons for why some data is unavailable for this map: Greenland is not an independent country but is a territory of Denmark. French Guiana (in northern South America) is also not an independent country but is a territory of France. Western Sahara is a disputed territory fighting for independence from Morocco. Somalia has dysfunctional government and probably didn’t report data to the IMF. Finally, Cuba and North Korea are not part of the IMF. GDP statistics are available for most of these regions from sources other than the IMF.
Note that Cuba left the IMF when Fidel Castro came to power, claiming that the IMF was too slanted in favor of US capitalism. It is an interesting case worth considering further.
Consider This: How Developed is Cuba?
Cuba is an interesting case of development. To illustrate, Cuba's 2015 GDP per capita is $7,602, far behind the United States' 2015 GDP per capita of $56,207. Since Cuba isn’t in the IMF, the data here comes from the World Bank, which is an excellent resource for demographic and other data. Meanwhile, Cuba's life expectancy as of 2015 is 79.55 years, which is significantly higher than the world average of 71.66 years and slightly higher than the United States’ life expectancy of 78.74. Cuba’s high life expectancy can be seen on the life expectancy map on the previous page.
Why is it that Cuba performs so much better in a health statistic like life expectancy than with a monetary statistic like GDP?
The answer is the unusual nature of Cuba’s economy. Cuba has a socialist economy with a high degree of central planning. It is also relatively isolated from the globalized economy, especially now that the Soviet Union no longer exists. Because of this, its government has emphasized healthcare, education, and other social development practices instead of activities that would generate a large GDP. While Cuba lacks the expensive medical facilities found in the United States and other wealthy countries, it has universal healthcare and the most doctors per person of any country in the world.
Recently, there was a fuss in the media to report that diplomatic relations had finally been established between Cuba and United States as of July 20, 2015. This means that up until July 2015, US citizens had not been allowed to even travel to Cuba. The relations between the two countries had been poor ever since the Castro regime tied Cuba to the Soviet Union. Relations remained poor for a long time even after the dissolution of the Soviet Union, in part because of disagreements about economic issues and in part because of US concern about Cuba’s limited political freedoms. Regardless of what your view of Cuba is, it is important to recognize and learn from its unique approach to development.
World Development Throughout History
There is one more point to consider about the GDP map shown earlier: It only shows one point in time. The map tells us something about development around the world today, but it doesn’t explain how we got here. Even the Rosling video, which shows an animation over time, doesn’t offer much in the way of explanation. This leaves out the important question: Why is it that some countries are more developed – or at least have more money – than others?
Understanding the patterns of development we see today requires understanding the history of development around the world. Historical geography is the study of the historical dimensions of our world and is very important here. It turns out that certain aspects of the environment have played important roles in the history of development on Earth. This is a very old story, and it’s worth starting at the beginning: at the origin of agriculture. Agriculture is an important starting point for development because the increased food supplies enable larger populations and enable some people to devote their time to tasks other than producing food. This labor specialization is necessary for the diverse other human activities required for development.
Agriculture originated independently in several regions around the world. In the map below, the green areas are regions where agriculture originated and the arrows show directions that agriculture spread from its areas of origin.
But all agriculture is not equal. Some agriculture is more productive than others. Likewise, some of these regions where agriculture originated are likely to develop more successfully than others. Key factors include the region’s growing conditions (including temperature, precipitation, latitude, and soils) and the types of plants and animals available for planting and domestication. Many regions had good growing conditions, but of all the regions in the world, one had especially rich plants and animals to use. That region is the Fertile Crescent, which is located in the Middle East as seen on the map above.
Consider This: The Fertile Crescent’s “Geographic Luck”: Guns, Germs, and Steel
Guns, Germs, and Steel is a Pulitzer Prize-winning book written by geographer and physiologist Jared Diamond. In the book, Diamond seeks to answer a question posed to him by a man in Papua New Guinea: Why does Diamond have so much more “cargo” than the Papua New Guineans? “Cargo” here essentially means “stuff,” including advanced stuff like helicopters. Note that Papua New Guinea has had agriculture for a long time – it is the green space located just north of eastern Australia on the map above. Why didn’t Papua New Guinea’s agriculture lead to advanced civilization as it did elsewhere? The explanation that Diamond comes up with is that Papua New Guinea had less “geographic luck:” It had less in the way of resources conducive to successful agriculture, in particular, plants and animals. In contrast, the Fertile Crescent had better resources.
In order to learn more about Diamond’s ideas, please watch part of the National Geographic video made based on Guns, Germs, and Steel. Please begin at Episode 5, at time 4:30. Then watch Episode 6 from the beginning through time 8:25. As you watch the videos, consider this: What are the major parts of Diamond’s arguments? What are critiques that others have made? How does Diamond respond? Is his response successful?
Video: Guns, Germs, and Steel Part 5 of 18 (4:30-9:18, 4 minutes and 48 seconds)
Presenter (4:30): The big four livestock animals—cows, pigs, sheep, and goats—were native to the Middle East, the very same area that was home to some of the best crops in the world. It was also home to some of the best animals. Little wonder that this area became known as the Fertile Crescent. The people of the Fertile Crescent were geographically blessed with access to some of the best crops and farm animals in the ancient world, giving them a huge advantage. What had begun with the sowing of wheat and the penning of goats was leading toward the first human civilization.
The archaeological site of Göbekli Tepe in southern Jordan is 9,000 years old, but it has all the hallmarks of a town. A few hundred people lived there in rows of houses that were a wonder of technology. Every time I visit, I am amazed by what those people were doing. Some of the houses had a kind of air conditioning—this window here is for controlling the air coming from the street inside the house. The walls and the floors of the houses were covered with plaster from the inside, at least. People were starting to move toward the concept of homes—not just places to sleep, but proper homes. They began decorating the houses from the inside. People started investing in their homes, as plaster was time-consuming, effort-consuming, and expensive to apply.
As villages grew bigger, there were more people to work the land. More people could produce more food more efficiently, enough to support specialists within the community. Freed from the burden of farming, some people were able to develop new skills and technologies. Making plaster from limestone was a major technological breakthrough. The stones had to be heated for days at a time at a temperature of 1,000°. While it may seem insignificant today, understanding how to work with fire was the first step toward forging steel, a technology that would transform the world.
By contrast, places like New Guinea never developed advanced technology. Even today, some people in the highlands are working in ways that have barely changed for centuries. When I first came to New Guinea in the 1960s, people were still using stone tools like axes in parts of the island. Before European arrival, people were using stone tools everywhere in New Guinea. So, why didn’t New Guinea develop metal tools on its own? Eventually, I realized that in order to have metal-working specialists who could figure out how to smelt copper and iron, the rest of society, the farmers, would need to generate enough food surpluses to feed them. But New Guinea’s agriculture was not productive enough to generate those food surpluses, and the result was no specialists, no metalworkers, and no metal tools.
Video: Guns, Germs, and Steel Part 5 of 18 (0:00-8:25, 8 minutes and 25 seconds)
Presenter: The way of life in New Guinea was perfectly viable; it had survived intact for thousands of years. But according to Diamond, people didn't advance technologically because they spent too much time and energy feeding themselves. Then Westerners arrived and used their technology to colonize the country.
Yet for all its advantages, the Fertile Crescent is not the powerhouse of the modern world, nor is it the breadbasket it once was. How did it lose its head start? Within a thousand years of their emergence, most of the new villages of the Fertile Crescent were abandoned. Ironically, the region had a fundamental weakness. Despite having some of the most nutritious crops on the planet, its climate was too dry and its ecology too fragile to support continuous, intensive farming. People were destroying the environment. The waters had been over-exploited, the trees had been cut, and this is what happened when you face a dilemma. You are facing the wall. You will end with a landscape like that—few trees, no grass, and less water. So what we are looking at today is the outcome of exploiting the environment. Unable to farm their land, entire communities were forced to move on. The advantages they had accrued from centuries of domestication might have been lost, but again, geography was on their side.
The Fertile Crescent is in the middle of a huge landmass—Eurasia. There were plenty of places for farming to spread, and crucially, many of those places were to the east and west of the Fertile Crescent, at roughly the same line of latitude. Why is that so important? Because any two points of the globe that share the same latitude automatically share the same length of day, and they often share a similar climate and vegetation. Crops and animals domesticated in the Fertile Crescent were able to prosper at other places along the east-west axis of Eurasia. Wheat and barley, sheep and goats, cows and pigs all spread from the Fertile Crescent east toward India and west toward North Africa and Europe. Wherever they went, they transformed human societies. Once the crops and animals of the Fertile Crescent reached Egypt, they caused an explosion of civilization.
Suddenly there was enough food to feed the pharaohs and generals, the engineers and scribes, and the armies of people required to build the pyramids. The same is true of European civilization. From ancient times until the Renaissance, the crops and animals of the Fertile Crescent fed the artists, inventors, and soldiers of Europe. In the 16th century, the same crops and animals were taken by Europeans to the New World. At the time, there was not a single cow or ear of wheat in all the Americas. Now, there are 100 million cattle in the U.S. alone, and Americans consume 20 million tons of wheat a year. Modern industrialized America would be unthinkable without the spread of farming from the Fertile Crescent.
There are some who think Jared Diamond's argument is too neat and easy. Can the distribution of wealth and power really be reduced to cattle and wheat? What about culture, politics, and religion? Surely they've been just as important. Diamond's been criticized for being too deterministic, for ignoring the part people have played in shaping their own destiny. My years in New Guinea have convinced me that people around the world are fundamentally similar. Wherever you go, you can find people who are smart, resourceful, and dynamic. No society has a monopoly on those traits. Of course, there are huge cultural differences, but they’re mainly the result of inequality, not its root cause. Ultimately, what's far more important is the hand that people have been dealt—the raw materials they've had at their disposal. New Guineans acquired pigs from Eurasia, but not cows, sheep, goats, horses, wheat, or barley. They didn’t develop in the same way as Europeans and Americans because they didn’t have the same raw materials.
I'm not saying that those divisions of the world are set in stone and can’t be changed. It’s quite the opposite. The towns of Papua New Guinea are becoming bigger and more developed, populated by modern New Guineans trying to catch up with the rest of the world. Unfortunately for them, there's still a big gap to overcome. “Why do white men have so much cargo and we New Guineans have so little?” Yali caught me by surprise 30 years ago. I had no idea what to say to him then, but now I think I know the answer. It wasn’t for lack of ingenuity that your people didn’t end up with modern technology. They had the ingenuity to master the difficult New Guinea environments. Instead, the whole answer to your question was geography. If your people had enjoyed the same geographic advantages as my people, your people would have been the ones to invent helicopters.
[Required transcript end at 8:25]
Environmental Determinism
The idea that the outcomes of civilization were determined entirely by environmental factors is known as environmental determinism. This idea has been heavily critiqued. Even though environmental factors like plants and animals for agriculture can help explain some major patterns in development, such as why advanced civilization developed in Eurasia but not in Papua New Guinea, it cannot explain everything. For example, it cannot explain the major differences in development found today between adjacent countries such as the Dominican Republic (richer) and Haiti (poorer) or South Korea (richer) and North Korea (poorer). The distinction between the Dominican Republic and Haiti is even visible from space. Environmental determinism assumes that the environment determines all development and difference, but some patterns, like what we observe between the Dominican Republic and Haiti, are not explainable by environmental factors alone.
In this image, Haiti is on the left and the Dominican Republic is on the right. This part of Haiti is almost completely deforested, as is much of the rest of the country, but the deforestation ends abruptly at the political border. From our systems perspective, this is clearly humanity impacting the environment, not the environment impacting humanity. What is important to understand is that the patterns of development that we see have both environmental and social causes. The environment can explain some of why advanced civilization emerged on Eurasia instead of elsewhere, but only social factors can explain why, for example, the Dominican Republic is richer than Haiti or South Korea is richer than North Korea. In other words, environmental resources can contribute to development trajectories, just like many other geographic factors such as culture, climate, topography, proximity to major waterways, etc. But no single one of those components is ever the determining factor.
Environmental determinism came to prominence in the early twentieth century, but its popularity declined over time. This is partly due to its shortcomings, and also a recognition that it was often used as a justification for colonial conquest and slavery. In contrast to the unidirectional conceptualization of human-environment relationships, environmental possibilism arose as a concept in which environmental constraints are still recognized but the freedom and capability of humans to change and structure the environment are highlighted. Environmental determinism and possibilism represented geographers’ first attempts at generalizing what accounts for the pattern of human occupation of the Earth’s surface in modern times.
Development’s Downsides
Development’s Downsides
Thus far in the module, we've seen several examples in which development has increased health and quality of life. However, development can also reduce health and quality of life. Oftentimes, when development has these downsides, it is for reasons related to the environment. When development impacts the environment in ways that harm certain groups of people, it raises issues of environmental justice.
First, let's consider some connections between economic development, human health, and justice by completing the following reading assignment:
Reading Assignment: Walker, "Health Disparities in Black and White"
Walker, Bailus Jr. 2007. "Health Disparities in Black and White." Crisis (July/August).
A scanned copy of the article with images can be downloaded as a PDF here: Walker, Health Disparities in Black and White
An easier-to-read text only html version of this article is also available through the Penn State Library system.
Here are some questions to consider as you read this article:
- What are some of the main causes of poor health within the United States?
- What are some of the relationships (correlations) between health and race and class in the United States?
- What are some pieces of legislation that have been passed to try to deal with these patterns?
- While the correlations between health and race are clearly understood, what are some of the challenges in showing causation (proving that African American communities are targeted to live with these facilities, for example)?
The fact that poor, and often minority, populations are more likely to live within close proximity to facilities that have negative health effects has helped establish the environmental justice movement. Research on environmental justice has shown that political and economic systems structure the conditions that contribute to poor health and help explain variations within societies in the rates of non-communicable chronic diseases such as diabetes or cancer.
Within the United States, the environmental justice movement has worked to show how the byproducts of development, such as chemical factories, waste facilities, and toxic chemicals, create hazardous conditions for people living near them. Here's one example of environmental justice in the United States; watch this video about Fighting for Safe Water in Flint (13:25 minutes):
Melissa Mays: The first time we heard that they were thinking of switching to the Flint River, we laughed. We thought it was a joke. Because there's a ton of cars in there, shopping carts, and we knew that industry had dumped in the river for 100 years and didn't clean it up.
[Crowd] Three, two, one.
Mays: When they actually pushed the button, it was on TV, and we were shocked that we were actually going to be forced to drink from the Flint River. Here's to Flint. Here's to Flint.
[Crowd] Here, here!
Mays: About a month later, people were complaining about orange and brown water. You would watch the news, and they would say, Well, river water is a little bit harder to treat than lake water, and we've got it under control. It's just a bump in the road.
Pastor Overton: When I really recognized that Flint has switched is one early morning that I heard on 10 or 12 News, that General Motors had begun to switch from the Flint River water back on to the Detroit water because it was corroding their products. Flint city officials insist Flint River water is good enough to drink, but it's been causing problems with issues at General Motors. And I just knew, common sense told me that if it's messing up their automotive parts, it has to be a problem for consumption. So that's when I got up and got mobilized and got engaged to find out what was going on with this water. This church was where we spearheaded a group called the Coalition for Clean Water, bringing together other community groups that were out working to fight this water crisis.
Dimple Chaudhary: NRDC started to understand the magnitude of the crisis in Flint back in the summer of 2015. The ACLU of Michigan started to suspect that there may be potential litigation related to the environmental issues, the safety of the drinking water. They reached out to NRDC because they knew that we have expertise and a deep knowledge of safe drinking water laws and how to bring these types of environmental citizens' suits.
Dr. Mona Hanna-Attisha: Pediatricians know lead. We know what lead can do. Every agency tells us, from the CDC to the American Academy of Pediatrics, that there's no safe level of lead. When I heard of the possibility that there was lead in the water, it was a call to action. We decided to look at the lead levels just in our clinics. So the Hurley Children's Clinic sees the most Flint kids, and we compared lead levels before the water switch to lead levels after the water switch, and we did see this increase in the percentage of children with elevated lead levels. And we were absolutely heartbroken. We had to share this information as soon as possible. So we decided to hold a press conference. This research is concerning. These results are concerning. To alert our families to stop using this water, to use bottled water, to use filters and to hopefully get the water source changed back to Detroit. Right after we shared this information, my science was dismissed, the research was dismissed, the state came out publicly stating that I was wrong, that I was causing near hysteria. So, I shouldn't have been surprised, because for 18 months, the heroic people of Flint had been dismissed- the moms, the activists, the pastors, the journalists, the scientists.
Chaudhary: After we realized that there was data that could confirm that there were widespread elevated lead levels in Flint- so a real serious concern about toxic lead in people's water- we knew that the ultimate fix for a lead problem is to get the lead pipes out of the ground. So that was the central and primary goal of the case.
Sarah Tallman: In our lawsuit, we brought claims against the city of Flint and state officials claiming that they violated the Safe Drinking Water Act in several ways. The first major violation was called "a failure to optimize corrosion control treatment," which means the city and state failed to treat the drinking water appropriately to make sure that they were minimizing the amount of lead that was leaching from the pipes into drinking water. And the second violation was that they failed to monitor tap water for lead appropriately. Because they failed to do the right kinds of testing, they failed to uncover a problem for months and months, which exacerbated the crisis.
Anjali Waikar: After we filed our lawsuit, we started hearing a lot of concerns from the community about people not being able to access basic bottled water and filters that the city and state were providing.
Chaudhary: The state had set up some distribution points around the city, but it was very clear to us that that was inadequate.
Tallman: And the state really expected individual residents of Flint to have to go out and find water day in and day out every day for months and months. And that was frustrating and appalling and shocking, really.
Jared Knicley: Flint is a very poor city; one in five households doesn't have access to a vehicle, and requiring residents to go carry multiple cases of water home a day- it's just extremely burdensome on anyone. Particularly if you have any sort of disability or if you don't have a car. The same was true for filters. Every household in Flint was provided with a filter early on in the process, but they weren't taught how to install filters, they weren't taught how to maintain filters.
Chaudhary: What do you do when in a given moment, people don't have access to safe water? How can we, as attorneys, as advocates, try to help them? And so we started to think about how can we put in place kind of a temporary emergency solution? Something that could ensure that people had ready access to safe drinking water day to day until these larger issues, until they could be addressed.
Tallman: The case that we were trying to make was about how the lack of water was affecting people's everyday lives. And so we had to talk to people and get to know them and develop relationships with them so that they would be willing to share their story in a federal court, which is a scary thing and not an easy thing to do.
Waikar: Ten or twelve of us would come out into Flint over the course of several weekends. We went out in teams of two, literally walking down streets and knocking on doors, and identifying those people who are most in need.
Tallman: It was those stories and those experiences that were ultimately persuasive to the court.
Mays: So we wake up in the morning, and we go to brush our teeth; you have to use bottled water for that. I have three teenage boys who have to use bottled water to wash their face or they break out. Then you take your fast showers, and you move through your day making sure the kids have bottles of water to pack to take to school with them, making sure that we have enough bottled water for whatever I plan to cook that night. Over Thanksgiving, it took 58 bottles of water just to make Thanksgiving dinner. We give bottled water to the dogs, the cat because otherwise, we don't know what would happen. Then at the end of the day, you better make sure you've gotten to the point-of-distribution site if you're going to run out of water. The points-of-distribution centers are open noon to six, Monday through Saturday. My husband and I both work, so a lot of times it's one of us going on our lunch hour, or in between my husband's two jobs to go pick up water really quickly. Because by the time we get done with work, they're closed. So you can go pick up 10, sometimes 14, cases depending on what they'll give you; each site is a little bit different. Then you have to fill up the giant recycling bags and take them out, and you fill up a bag that holds 120 bottles awfully quickly in a family of five. What I do is at night, I make sure that I've refreshed the bottles of water in the bathroom for the boys. The only thing we do now in our home now is we flush our toilets and we shower.
Pastor Overton: The churches have been a big part of this entire recovery process in this crisis. This community worked together to get the people the water, to get the people the filters. Go into homes; I can't even count the number of homes that I went into to install filters. We were in crisis mode. It was a real tough time. You had people that had become very depressed because they felt they had failed their children. So you had parents who felt that they had neglected their children, no fault of their own, just a situation they had been placed into. And now we're trying to heal and recover. Trust is a big issue in this community. Most folks won't even say they're from Flint. They'll say they're from somewhere else, because they don't want the stigmatism that their children have been poisoned.
Knicley: The first big moment in the case was when the judge denied the state and the city's motions to dismiss in the summer of 2016.
Chaudhary: The judge issued a ruling that was incredibly comprehensive and ruled for us on every single issue and said, No, there's enough here for this case to continue. This community has raised some really serious questions about the safety of their water that deserve to be heard. And I think that was that moment when we felt like, OK, we have something here.
Knicley: And that set the stage for us moving forward, taking bottled water delivery and filter installation and maintenance.
Chaudhary: This order came requiring the city and state to make sure that people had safe water in the interim while the case was pending. The city and the state sought to overturn that order. By the end of December, it was clear that they were not going to be successful. Both our judge and the Sixth Circuit Court of Appeals had said, No, there's a real concern for public safety and for public health, and there needs to be more done. At that point, the governor of Michigan requested that the parties be convened for a mediation, and the judge ordered that, and then we all sat down at a table to talk.
Knicley: Once we had a settlement that all the parties were agreed upon, we submitted it to the court for its consideration and approval.
Chaudhary: We went to the courthouse in Detroit. Our clients were there, lots of members from the community were there. I stood up in front of the judge and said, Here's what we've been working on. Here's what we're asking you to approve, and the judge accepted the settlement and entered it and it was an incredible moment. Today is a great win for the city of Flint and an unprecedented outcome in a case like this. Our clients were thrilled. They worked so hard for this result. They're such an inspiring community. We were just so happy and honored that we could help them with this.
Mays: Flint proved that even while poisoned, even while worried about surviving, that we're not just victims, we are fighters.
Tallman: The settlement agreement means that there's an enforceable commitment on the part of the city and state to replace the lead and galvanized steel pipes in the city within three years. And that the state will commit up to $97 million to make that happen. In addition, the state is committing to make sure that every resident in Flint has a properly installed filter in the meantime so that they'll have safe water to drink while all this pipe removal is happening. The settlement also provides that the city and state will conduct robust tap water monitoring to make sure that lead levels in the city continue to go down over time. Everybody should be walking out of here with a water-testing kit.
Mays: We're sitting in the courtroom and I'm sitting next to Pastor Overton and I was like, "Did we just win?" And he was like, "I think so." And we just sat there. Both of us just sat there like, Is this real? Did we actually just get the state to agree to replace pipes? And then we just sat there in shock and then the attorneys turned around and everybody started hugging each other and it was just surreal. That all this work, the year and a half we'd been working on this lawsuit, that it had come to a settlement that was actually helpful for Flint residents.
Pastor Overton: And that was the no. 1 thing that we wanted to do was to get those service lines removed. And we accomplished that. We're now working to get all the lead service lines removed from the city of Flint.
Chaudhary: There's still a lot to be done. We have this great agreement, but it has to be honored and enforced, and so we're going to be watching every step of the way to make sure that the city and state comply with their obligations, and if they don't, we'll be back in court.
Rhea Suh: I hope that the story that comes out of Flint is a story about citizens taking matters into their own hands, utilizing partnerships with organizations like NRDC to seek the justice and the outcome that they deserve. It was the activity of individual people, normal people standing up and advocating for their rights, for their families, for their communities.
Waikar: Flint is an example of how every community can hold government officials accountable, especially when they are simply not doing their job or disregarding the public health and disregarding, frankly, their moral and ethical obligations to ensure the safety of an entire community.
Knicley: For communities that find themselves in a situation similar to Flint, I think this case provides a ray of hope. It shows that courts are a viable option for those communities to enforce their rights to safe drinking water even when it seems like everyone else is against them.
Mays: The state of Michigan didn't expect what happened, which is for all of us to stand up, become educated and become organized, and fight back.
But environmental justice is not just a domestic American issue. It is also a global issue. The globalized nature of our economy and our environment causes pollution and other environmental harms to become concentrated in certain world regions. Quite often, these regions are made up of the world's poorest and least powerful people. This can be seen in the following video on e-waste (or electronic waste) in Accra, Ghana's capital city (4 minutes):
Narrator/Reporter: Recycling West Africa style consumer electronics smashed sorted and the valuable metals extracted. This is Agbogbloshie, Accra where technology goes to die. Workers here are smelting feeding fires with TV casings and fridge interiors, a heat fierce enough to burn the insulation of electrical cables. A fingertip search through the ashes glean scraps of metal that are then sold on take-home pay between five and seven euros. The men boys working here and they range between 13 and 35 years old they're not from Accra they come from the north of the country. And they came here on a sort of gold rush promised riches from waste, but the riches turned out to be a pittance and the gold turned out to be lead, cadmium, and other heavy metals lodged in their bodies and slowly poisoning them.
Hanna Inusah, E-waste Processor: We have problems because if you didn't bathe or maybe bad finish until we just we been in your body unless you get some get some medicine.
Narrator/Reporter: Hanna is just 17 years old taking medicine to work in an environment so toxic that even some of the boys here refused to touch the river running through the site.
Vincet Kyere Nartey, Environmental Specialist: And you could see the smoke also. The smokes is also traveling at any place that in deposit this heavy metals or this the people there can be contaminated. The soil itself, the soil itself, you could see is hugely contaminated just by your sight.
Narrator/Reporter: Time to leave Agbogbloshie and head with Vincent to Ghana's Atomic Energy Commission. The lab has performed a battery of tests on soil from the site they found cadmium 30 times over acceptable levels it can cause cancer kidney failure bone disease levels of lead which attacks the nervous system topped 100 times the recommended maximum dose.
Doctor in Agbogbloshie: You wouldn't live here. I will not advise anybody to live there. Meanwhile this place has been classified as one of the most polluted or contaminated sites in the world.
Narrator/Reporter: The processing at Agbogbloshie she is fed by the illegal traffic of e-waste into Ghana. Today used TVs from Australia and Spain are being loaded onto waiting trucks there's nothing wrong with importing used Tek if it works. If it doesn't, its hazardous waste and it shouldn't be here.
So how many of these TVs actually work? They all work?
Man #1: Yeah 100 percent. About ninety nine percent.
Narrator/Reporter: How big is one percent?
Ghana is working on legislation to prevent illegal e-wastes imports but it's taking time as legislators don't want to curb the legitimate trade in used tech.
Thomas Naada, Ghanian Journalist: We do have some of the equipment that functions when it is imported into the country. So what the tests are seeking to do is to ensure that they don't end up preventing the valuable trade and use electric and electronic equipment.
Narrator/Reporter: In the meantime, young men and boys will continue to stoke the fires at Agbogbloshie and pay a heavy price with their health for a handful of change.
When you no longer want an electronic device that you own, what do you do with it? Where does it end up? Does it end up causing harm to other people? Who are these people? Do they deserve to be harmed by your e-waste? And what can you do about it? These are all difficult questions raised by our ownership of electronic devices. Similar questions are raised by other items that we own and activities that we pursue.
Finally, it is noteworthy that environmental justice is not only about which populations suffer from the burdens of economic development (also known as environmental bads), but also about who has access to environmental goods that contribute to human health. For example, poor communities and populations of color are often denied access to parks, open space, full service grocery stores, and hospitals. The environmental justice movement, therefore, has expanded to ask critical questions about which human populations suffer the burdens of economic development, and which benefit the most from it.
Consider This: Mapping Environmental Justice
Scientists, activist organizations, and stakeholders from different arenas have been working together to map out global environmental justice. The Atlas of Environmental Justice, for example, is a platform that visualizes hotspots of environmental justice across a wide range of fields (e.g., coal extraction and processing, landfills, deforestation, etc.). It is also a database of case studies of communities that grapple with and struggle against the disproportionate distribution of environmental “goods” and “bads.”
Sustainable Development
Sustainable Development
The ideas behind sustainable development can be traced back to early works of scholars such as Rachel Carson's Silent Spring (1962), Garrett Hardin's Tragedy of the Commons (1968), and Paul Ehrlich's Population Bomb (1971). Despite the different focuses of these classic works related to population and environment, all raised public concerns over environmental problems resulting from human activities and highlighted the importance of systems thinking.
Consider This: Sustainable Development Timeline
In Module 3, we learned that there is no single definition of sustainability or sustainable development. The most famous definition is from the United Nations Brundtland Commission Report Our Common Future (1987):
"Sustainable development is development which meets the needs of the present without compromising the ability of future generations to meet their own needs."
So what progress have we made in the decades since the idea of sustainable development was popularized?
Read the Sustainable Development Timeline authored by IISD (International Institute for Sustainable Development) and think about your answers to the question.
Note: The timeline was published in 2012. A few more milestones have been reached since then. One salient milestone is the Paris Agreement on climate change, which was signed in 2015 and entered into force in 2016. Among other things, the Paris Agreement requires all signatory parties (regardless of their industrial development status) to commit to a nationally determined goal of reducing emissions of greenhouse gases. You will read more about international climate change negotiations in Module 9.
Some tremendous efforts and notable achievements have been made towards sustainable development, but is our contemporary civilization sustainable? It turns out that in many ways, it is not. The basic idea of unsustainable development is that there are some things that we are doing today that we cannot continue doing forever. Much of our development depends on natural resources that either cannot be replaced or are not being replaced as fast as we are depleting them. Some major examples are:
- fossil fuels (oil, coal, and natural gas) used for energy
- fresh water supplies used for irrigation and drinking
- minerals used for manufacturing
- trees used for construction and fuel
- fish used for food
Each of these resources is becoming increasingly scarce. We cannot continue using them as we do today. Either we will need to shift away from them on our own, or shortages will force us to change our ways.
There are other reasons why some aspects of contemporary development may be considered unsustainable. Development is changing the global climate system and affecting biodiversity in ways that could have very perilous consequences. We’ll learn about these topics towards the end of the course, but, for now, just note that if we try to continue with development as we have been, then the ensuing changes to climate and biodiversity could eventually prevent us from maintaining our state of development. Finally, as we saw on the previous page, development even today is not necessarily something to be desired. On the other hand, development involves much of what is important to us and thus is not something we can easily walk away from. Achieving development that is both desirable and sustainable is a major goal for our lives and our society.
In the next two modules, we’ll examine some important aspects of sustainable development in greater detail.
Summary
Summary
This module was designed to introduce to you the idea of development, including sustainable development, and give an overview of development around the world. Development is a complex and contested concept, lacking a single universally accepted definition. But we can still recognize some general features of development, whether measured via monetary, health, end uses, or other indicators. We can see that today the world is unevenly developed and that this contemporary pattern is not solely determined by the natural environment but the product of both social and environmental factors that have been going on throughout human history. It is this development that enables us to enjoy the comforts and conveniences of our time and place, such as the opportunity to take online courses. But development has its downsides and, for better or worse, these downsides frequently affect the nation's and the world's poorest and least powerful. Finally, our contemporary development depends on certain natural resources that will not last forever, raising questions about the sustainability of our development.
Module 6 - Food and Agriculture
Introduction
About Module 6
Food and agriculture are important for one simple reason: Everyone eats. Without food, we could not survive, let alone do anything else. And there are a lot of people around the world - more than eight billion. This means that there is a lot of agriculture going on in order to produce a lot of food. Finally, there are concerns about whether our agriculture can persist into the future. All this means that food and agriculture are crucial aspects of sustainable development around the world.
In this module, we are going to learn about some major facets of food and agriculture as they relate to sustainable development and other important individual and societal issues. We'll see how food is produced and how it affects both our health and the natural environment. We'll consider a variety of ethical and policy issues raised by food and agriculture. And we'll consider how agriculture can be sustained into the future.
What will we learn in Module 6?
By the end of Module 6, you should be able to:
- discuss what industrial agriculture is and the social and environmental impacts that it has;
- explain the unique issues raised by the use of livestock animals;
- describe connections between food-agriculture systems and nutrition;
- discuss major societal issues in food choice and policy.
What is due for Module 6?
Module 6 has an unusually large number of required readings. These readings are all quite short, generally one to two pages. A large number of short readings has been selected to present you with a breadth of perspectives. A Written Assignment is also due this week drawing from this module and the previous. Check Canvas for due dates and to submit.
| Requirement | Location | Submitting Your Work |
|---|---|---|
| Reading Assignment: The Global Food System | Food and Agriculture Systems | No submission |
| Reading Assignment: Detonator of the Population Explosion | Industrial Agriculture | No submission |
| Reading Assignment: USGS Fact Sheet | Industrial Agriculture | No submission |
| Video Assignment: The Meatrix | Livestock's Long Shadow | No submission |
| Reading Assignment: Impacts of Factory Farming | Livestock's Long Shadow | No submission |
| Reading Assignment: Healthy Eating Pyramid | Nutrition | No submission |
| Video Assignment: The Hidden Cost of Hamburgers | Food Choice and Policy | No submission |
| Written Assignment 3: Development and Agriculture | Written Assignments | Submit in Canvas |
Questions?
If you have any questions, please post them to our Course Q & A discussion forum in Canvas. I will check that discussion forum often to respond. While you are there, feel free to post your own responses if you, too, are able to help out a classmate. If you have a more specific concern, please send me a message through Inbox in Canvas.
Food and Agriculture Systems
In Module 2, we learned the importance of a systems perspective for understanding relationships between humanity and the natural environment. We’re going to begin this module by applying this systems perspective to food and agriculture.
The core idea here is to consider all factors that are relevant to food and agriculture. These are our system components. Here is a simple diagram giving a broad overview of food and agriculture systems:
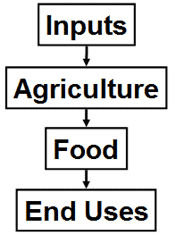
Inputs to agriculture include all of the resources that agriculture draws on in order to succeed. Resource inputs can include natural resources such as air, sunlight, rainwater, and soil nutrients for plant crops, or wild grasses and bodies of water for livestock animals to graze on and drink. Resource inputs can also include artificial resources such as artificial lighting, irrigated water, and synthetic fertilizers for plant crops, or prepared feed and water for livestock animals. Without these inputs, the plants and animals could not grow. Finally, the inputs also include the seeds and parents of the plants and animals, which are of course also necessary for the plants and animals to grow.
The sustainability of inputs is a core aspect of sustainable agriculture. Simply put, if we run out of the resources we need for successful agriculture, then our agriculture cannot be sustained. When agriculture depletes input resources such as water or fossil fuels, then the agriculture is probably unsustainable. But even if inputs are sustained, it is still possible for agriculture to be unsustainable. This is because agriculture impacts other things besides its inputs. Some of these other impacts can render agriculture unsustainable. These other impacts are discussed elsewhere in this module and in other modules.
Agriculture is, in the simplest of terms, the process for converting the inputs into food. Seeds are planted in soil. The soil is fertilized and watered as needed. Plants grow, and they are tended to as needed, such as by keeping pests away. Food from the plants is then harvested and eaten by humans, or fed to livestock animals who are eventually eaten by humans. The eating of food by humans, and in particular the nutrition derived from the eating, is perhaps the core end use of the agriculture. Thus, we can think of food and agriculture as being the process of getting nutrients from the natural environment into human bodies. And it is this. But it is also a lot more.
Throughout the process of getting nutrients from the natural environment into human bodies – that is, from inputs to end uses – there are other important components to the food-agriculture system, components that cannot be defined strictly in terms of nutrients. These include:
- social inputs, including the knowledge about how to conduct agriculture, the labor that performs the agriculture, and policies that facilitate the agriculture;
- the enjoyment of foods that taste good – an enjoyment that comes at least somewhat independently of the food's nutritional value;
- the socialization that occurs as people share meals together;
- livelihoods achieved by workers in the food and agriculture sectors, which includes everyone from poor subsistence farmers to rich agribusiness executives;
- environmental impacts of growing, transporting, and cooking food, and of uneaten food waste;
- the opportunities for people to do other things given that they have enough to eat.
The social inputs can be considered other inputs in the system diagram shown above. The enjoyment and socialization can be considered other end uses in the diagram. Livelihoods and environmental impacts are other consequences of every component in the diagram. Finally, the opportunities to do other things are consequences of the end uses, in particular, nutrition: without proper nutrition, we would not have the energy to do anything else with our lives. Thus, the system diagram can be redrawn as follows:
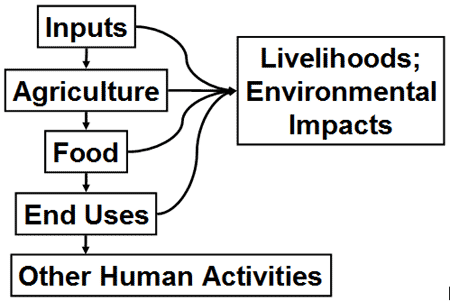
This diagram is not comprehensive. For example, it doesn’t mention the transportation of food from where it’s grown to where it’s prepared to where it’s eaten. So we should not assume that the diagram tells us everything we need to know about the food-agriculture system. But the diagram does give us a reasonable understanding of this system from a particular perspective. Let’s use this understanding to analyze a discussion of food and agriculture.
Reading Assignment: The Global Food System
Please read the article In Corrupt Global Food System, Farmland is the New Gold.
The article was written by environmental journalist Stephen Leahy for the Inter Press Service News Agency (IPS). Leahy and IPS are useful resources for learning more about sustainability and global affairs.
As you read the article, think about how it relates to the systems diagrams shown above. Also, think about how the article relates to key course concepts such as globalization and ethics, and to the Module 5 discussion about what development is. Finally, identify the core issues being discussed in the article. How would you handle these issues?
This systems perspective is valuable for helping us understand various aspects of food and agriculture. In the remainder of this module, we’ll look at major aspects of the food-agriculture system and, in particular, their connections to global society and the natural environment.
Industrial Agriculture
Industrial Agriculture
In Module 5, we learned about the importance of early agriculture to world development. In short, early agriculture permitted more humans to live, to live with better health, and to engage in activities other than basic survival. These other activities have brought us no less than civilization itself. While there can be some civilization without agriculture, there couldn’t be nearly as much as we have today.
Now, we’re going to learn about modern industrial agriculture, whose impacts have been every bit as consequential for humanity. Industrial agriculture has substantially increased global agricultural productivity, leading to much more food for a growing human population. Industrial agriculture has also impacted human society in a variety of other ways and has had major impacts on the environment, many of which are harmful. Industrial agriculture is thus an important but complex topic worth considering in some detail.
The Haber-Bosch Process for Nitrogen Fertilizer
Let’s begin by examining one of the core industrial processes used in modern agriculture: the Haber-Bosch process for synthesizing ammonia (NH3). Ammonia is used as fertilizer to put nitrogen into soils for plants. Soil nitrogen is needed by most of our major staple crops, in particular, wheat and corn. The Haber-Bosch process, developed in the early 1900s, is thus crucial to all industrial agriculture, whether in wealthy countries or poor ones.
Reading Assignment: Detonator of the Population Explosion
Please read the article Detonator of the Population Explosion by Vaclav Smil. Smil is an interdisciplinary researcher at the University of Manitoba. He received his Ph.D. from the Penn State Department of Geography.
As you read the article, think about the significance of the Haber-Bosch process to global human civilization. Where would we be without it?
The Haber-Bosch process affects more than just food supplies. It also affects the environment. Indeed, humanity grows so much wheat, corn, and other nitrogen-needing crops that our use of nitrogen fertilizer is significantly altering the planet’s nitrogen cycle. This has major environmental consequences. Here are two:
Energy Consumption
The chemistry of the Haber-Bosch process requires high pressure and temperature, which in turn requires a lot of energy. Given this and the large scale of global nitrogen fertilizer production, the process uses about 1% of total world energy consumption. Most of this energy is from fossil fuels. Fossil fuel supplies are limited, and any system dependent on them is unsustainable. If humanity's agriculture remains dependent on the Haber-Bosch process and on fossil fuels, then, eventually, we may struggle to feed ourselves.
Algal Blooms
An algal bloom is a high concentration of algae found in both inland and oceanic waters worldwide. How are algae blooms connected to nitrogen fertilizer? First, the nitrogen has to get from the farm to the water. When the fertilizer is applied, a lot of the nitrogen is not taken up by the plants. Much of this fertilizer washes off, finding its way into ponds, lakes, or rivers, which feed into oceans and seas. The nitrogen then accumulates in these waters. Second, nitrogen has to cause algae growth. This happens because nitrogen is often a limiting factor in algae growth. In other words, algae often face a nitrogen shortage such that if only they had more nitrogen, then all the other necessary factors for algae growth would be available, and more algae would grow. When this is the case, and when new nitrogen is introduced from the runoff from farms, then more algae will grow. We see this happening quite often worldwide. The following image of algae in Lake Erie is but one example.
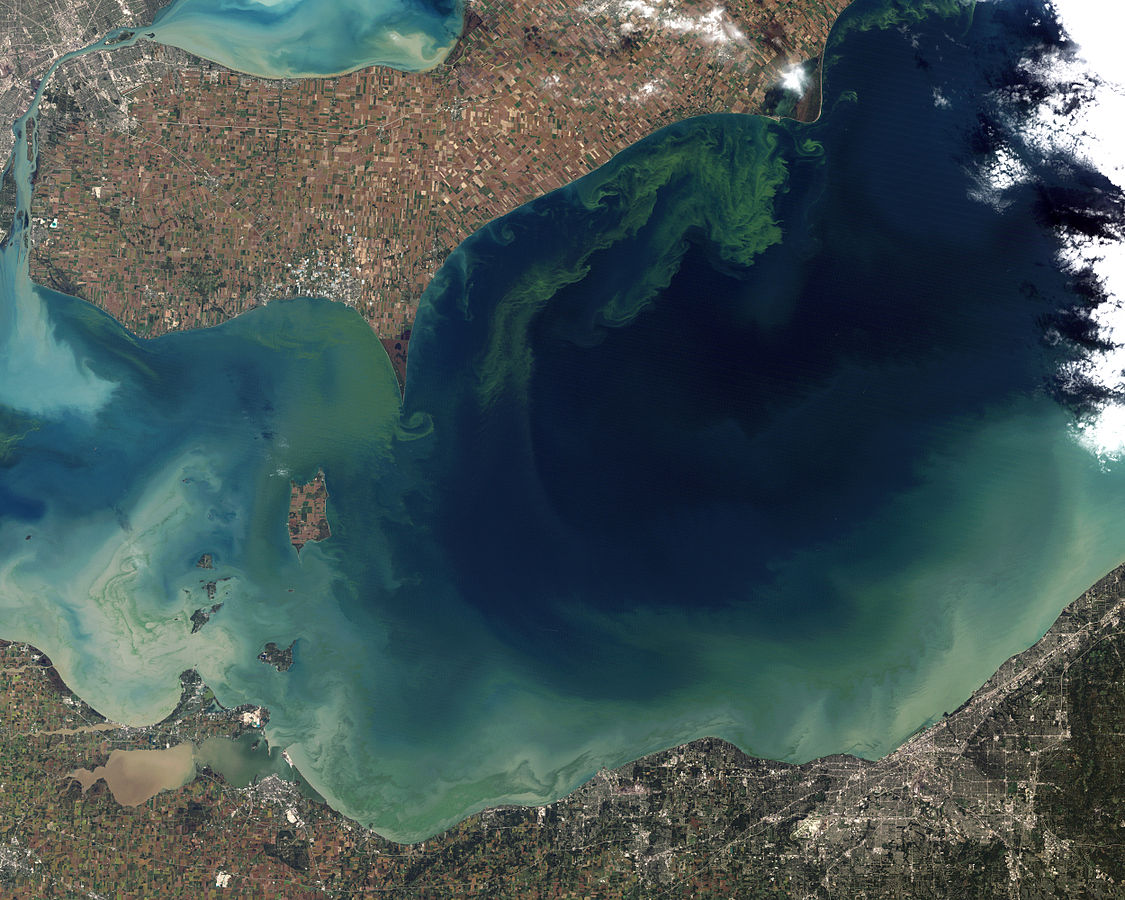
Other Industrial Processes
The Haber-Bosch process is just one of several industrial processes used in industrial agriculture. Other important processes involve pesticide production, heavy farming machinery such as tractors, and irrigated water distribution systems. Without these processes, our agriculture could not yield as much food as it does. However, just as with the Haber-Bosch process, these other processes have downsides.
One important downside is the sustainability of agricultural water inputs. A lot of industrial agriculture draws on fossil water, which is water that has accumulated gradually over a long time, just as fossil fuels are fuels that have accumulated gradually over a lot of time. Fossil water is often in underground aquifers such as the Ogallala Aquifer beneath the United States Great Plains. The Ogallala has helped the Great Plains produce a lot of food, but the water is depleting, forcing farmers to farm differently.
Reading Assignment: USGS Fact Sheet
The United States Geological Survey (USGS) is a scientific agency within the Department of the Interior. The USGS is very active on many aspects of human-environment systems including natural resources and natural hazards. The USGS employs many people with backgrounds in geography and related fields.
Like other government agencies, the USGS produces a lot of fact sheets. A fact sheet is a short (usually one or two page) document that gives a concise presentation of key facts on a specific topic. Fact sheets are used to brief government officials on these topics so that they have the background they need to make decisions. If you work in government (or in certain other sectors), then you'll likely be reading and writing fact sheets.
Please read the USGS fact sheet Changes in Water Levels and Storage in the High Plains Aquifer, Predevelopment to 2011 and 2009–11.
As you read the fact sheet, think about two things. First, what changes have occurred in the High Plains (Ogallala) Aquifer, and how does this affect the sustainability of agriculture? Second, how is a fact sheet formatted, and how does this format support its use for briefing government officials? Think about every part of the document, including the main text, the graphics, the references, etc.
Finally, the advent of industrialized agriculture also involved changes in both which plants were grown and how they were grown. New varieties of staple crops like wheat, maize (corn), and rice were developed to respond well to fertilizers and other industrial inputs. New varieties played a particularly strong role in the spread of industrialized agriculture to lower-income regions of the world in what is known as the Green Revolution. Indeed, Norman Borlaug, the man often considered to be the “father of the Green Revolution,” was a researcher who developed new varieties of wheat and other crops.
The Green Revolution
Thus far, we’ve been focused on the biological and ecological sides of industrialized agriculture. Now let’s look at the social side by considering one major portion of it: the Green Revolution. The Green Revolution took place mainly in the 20th Century, but to some extent continues to this day.
The essence of the Green Revolution has been to bring high-yield industrial agriculture to the Third World in the 1940s through the 1970s. Now, recall that in Module 5 we said that “Third World” is often an outdated and inappropriate term because it refers to countries outside the capitalist and communist blocs of the Cold War. Here, however, Third World is the appropriate term to use because the Green Revolution was part of the Cold War. Indeed, the term Green Revolution was coined in contrast to the term Red Revolution, which refers to revolution towards communism. Capitalist countries, led by the United States, used the Green Revolution as a means of making Third World countries more supportive of capitalism and less supportive of communism. (As we’ll see later in the module, the Soviet Union made similar efforts.) To be sure, there was also a genuine desire to help the Third World feed themselves. But we should recognize that the Green Revolution had selfish political motivations as well as altruistic motivations. This combination of selfishness and altruism is found repeatedly throughout global development efforts, an observation that follows from a holistic, systems perspective of development that considers all the consequences of development efforts.
The Green Revolution resulted in the adoption of new agricultural practices and technologies in a variety of places around the globe. The most important of those new processes and technologies were newly developed high-yield crop varieties, chemical fertilizers, and mechanization.
The Green Revolution was highly successful in many regards. Yields in countries like India and Mexico increased dramatically, significantly reducing food security issues in these countries. Furthermore, many of the countries ended up not joining the Communist bloc, which was another core goal of the Green Revolution. But there were also downsides, as would be expected from a program this complex. The overall merits of the Green Revolution remain fiercely debated to this day.
Of all the regions in the world, the one that currently has the least industrialized agriculture system is Africa. For a variety of natural and social reasons, the Green Revolution did not take hold in Africa as strongly as it did elsewhere. For this reason, and because much of Africa continues to struggle with food security, there are ongoing efforts to bring industrialized agriculture to Africa.
Consider This: Alliance for a Green Revolution in Africa
Please read about the Alliance for a Green Revolution in Africa (AGRA).
Please briefly skim this page (you do not need to follow any of the links unless they are of additional interest to you). As you read this web page, think about what AGRA’s approach to development is. Is AGRA using a systems perspective? What is it doing well, and what could it be doing better?
Monoculture
One concern often voiced about industrial agriculture, whether in reference to the Green Revolution or otherwise, is that industrial agriculture generally involves monoculture. Monoculture is agriculture in which only one type of crop is grown. It thus has very low biological diversity. Monoculture is well-suited to industrial agriculture because it’s much easier to use heavy farm machinery when the machinery can be customized for one crop. The monoculture-machinery system can be seen in this image of an industrial agriculture landscape:
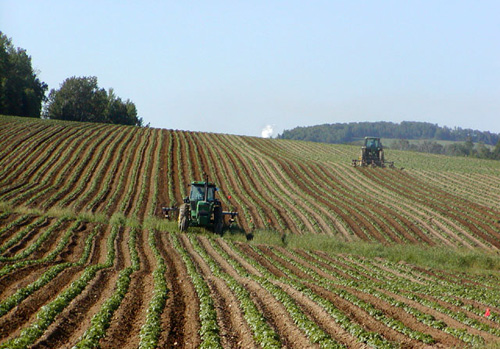
But monoculture also has disadvantages. For example, when one crop is grown repeatedly in an area, it will deplete one set of nutrients from the soil. It was mentioned above that grain crops like maize and wheat deplete nitrogen from the soil, and that this depletion drives the usage of industrial nitrogen fertilizer as produced by the Haber-Bosch process. But some plants, such as legumes, fix nitrogen from the air and put it into the soil. Legumes include beans, peas, soy, and peanuts. When these plants are grown around grain plants, less nitrogen fertilizer is needed. This is beneficial because fertilizer can be expensive and can harm ecosystems. However, when different types of plants are grown together, it is more difficult to use heavy machinery.
Another disadvantage of monoculture is its yield stability. Yield stability refers to how stable the yield of an agricultural system is over time from one year to another. An agricultural system with high-yield stability will output about the same amount of food each year. An agricultural system with low yield stability will likely output very different amounts of food each year. In brief, the adoption of monoculture farming can cause an agriculture system to be less tolerant of disturbances or perturbations (e.g., pest outbreaks) and less sustainable with higher instability in crop production.
Biologically diverse agricultural systems tend to have more yield stability than does monoculture. This is because when some event happens that could reduce yields, the event typically only affects some of the species within the system. For example, if rainfall is unusually low one year, but some of the crops planted are well-suited to low rainfall, then those plants will have high yields. If rainfall is high the next year, then those plants will have low yields, but other plants will have high yields, making up for it. So, no matter how much rain falls each year, there will be some crops with high yields, and thus a fairly stable total yield. In contrast, if the system has less diversity, and all of the crops are well-suited for one specific amount of rainfall, then the yield will be either very high (if that specific amount of rain falls) or very low (if some other amount of rain falls). Thus, less diverse systems have less stability.
A striking historical example of the importance of biodiversity to yield stability is the Irish potato famine. In this example, low biodiversity led to a catastrophically low yield.
Consider This: The Irish Potato Famine
In the mid-1800s, many people in Ireland were trying to support themselves and their families on very small pieces of land – often just a few acres. For them, the only crop that could provide enough calories was the potato. And so, they planted lots of potatoes and not much else. This was a very difficult livelihood, but it was largely feasible.
Then, in 1845, potato blight made its way to Ireland from the United States. The blight was devastating to the potato crop, destroying as much as a third or half of it. The consequences for the Irish people were catastrophic. The people hit the hardest were those whose agriculture was focused mainly on growing potatoes – the people whose agriculture had very little biodiversity. To make matters worse, these people already faced very difficult living conditions. With the devastation of their potato crops, they had little else available to survive.
The potato blight caused a great famine, affecting a large portion of the Irish people. By the end of it, the island’s population fell from 8 million to around 6 million. About one million people died, and another million people emigrated to other places. Cities on the east coast of the United States, such as Boston, New York, Philadelphia, and Baltimore, all gained large Irish populations which they retain to this day.
It is important to understand that the causes and consequences of the famine were both ecological and social. The famine would not have occurred if the blight did not affect potatoes so severely, or if Irish agriculture had more biodiversity. The lack of biodiversity there was largely due to the social factors that caused people to have such small plots of land to farm. Meanwhile, the blight was introduced to Ireland through a social process: shipping across the Atlantic Ocean. Originally, the potato itself was introduced via trans-Atlantic shipping as well (the potato is native to South America). Finally, the consequences of the famine would have been different if there was different support for the people affected by the blight. There was some support, which saved lives; this support could have been greater or lesser. Thus, the case of the Irish potato famine illustrates both the importance of biodiversity to yield stability and the idea that agriculture is a coupled human-environment system.
Livestock's Long Shadow
Thus far in the module, we have focused mainly on plant crops, but livestock is a hugely important component of the food-agriculture system. It is important for several reasons, including its inputs, its environmental impacts, its nutritional significance, and for the unique ethical issues it raises. Many of the social and environmental impacts of livestock are metaphorically dark, which is why livestock is referred to as having a large shadow. The phrase Livestock's Long Shadow comes from a report of the United Nations Food and Agriculture Organization, which we'll get a glimpse of below.
Inputs to Livestock
Many livestock animals graze on natural plant life, such as in the commons discussed in Module 4, but in today’s agriculture system, the majority of livestock animals are fed plants that are grown by humans. There are so many livestock animals around the world that, between grazing and plant feed, livestock takes up a very large amount of the planet’s land. The need to feed plants to livestock animals is another main reason why livestock is such an important issue. In short, we could either eat our plant crops ourselves, or we could feed the plants to livestock animals and then eat meat, eggs, and dairy from the animals:
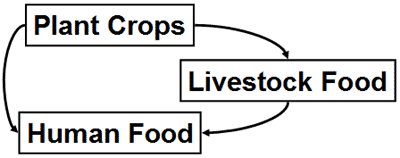
In other words, livestock animals are higher up the food chain than plant crops are. This means that livestock needs two sets of inputs: the inputs for the animals and the inputs for the plants that they eat. In the case of carnivorous livestock animals, there would be a third or fourth set of inputs. Furthermore, animals are much less than 100% efficient at converting plant food into animal food. This means that we’ll need more than one unit of plant food as input for every unit of livestock food that we get out from it. So, a diet based on livestock will actually require more plant crops than a diet based on plants. This, in turn, means that all of the ecological and other impacts of growing plants will be amplified when we base our diets on livestock animals instead.
Consider This: Livestock’s Land Usage
The United Nations Food and Agriculture Organization (FAO) is a UN agency dedicated to addressing global hunger issues. In 2006, it released a major report, Livestock’s Long Shadow, documenting the environmental and other impacts of livestock. Here is an excerpt (from page xxi of the Executive Summary) describing livestock’s land usage:
The livestock sector is by far the single largest anthropogenic user of land. The total area occupied by grazing is equivalent to 26 percent of the ice-free terrestrial surface of the planet. In addition, the total area dedicated to feedcrop production amounts to 33 percent of the total arable land. In all, livestock production accounts for 70 percent of all agricultural land and 30 percent of the land surface of the planet.
Livestock’s large land usage is a significant and complex issue. For example, the land usage is a main driver of deforestation and biodiversity loss around the world.
Environmental and Health Impacts of Livestock
Some of the key environmental impacts of livestock come from the large inputs of plant food that they require. The impacts of plant crops include land usage, changes to the nitrogen and phosphorus cycles from fertilizer, and consumption of energy and water resources. There are also environmental impacts of livestock that come from the animals themselves. This includes the wastes produced by the animals, in particular manure and urine.
Factory Farms
Factory farms are also known as Concentrated Animal Feeding Operations (CAFOs). A factory farm is a livestock farm designed to maximize the output of livestock products per unit cost. It is industrial agriculture for livestock.
Video Assignment: The Meatrix
The Meatrix (now a series) is a popular video about factory farming that has been translated into more than 30 languages and watched by more than 15 million people worldwide. The video does not fully acknowledge some of the complexities and nuances in today's modern agricultural system, but the important thing to note is that there is a big difference between large agribusiness and factory farms on the one hand and small family farms on the other hand.
The Meatrix series is available at the website themeatrix.com. Please go to this website and view the video that appears in the middle of the homepage (i.e., The MEATRIX® Relaunched). The website has other videos, but these are optional for Geography 030.
Reading Assignment: Impacts of Factory Farming: "Public Health"
GRACE Communications Foundation is an environmental advocacy non-profit organization headquartered in New York City that works to increase public awareness of environmental and health issues from food, water and energy systems, and to promote a more sustainable future.
Please read the "Public Health" article from its food program, Sustainable Table®. As you read this, identify the environmental and health impacts from factory farms. In addition, you might recall from the Module 2 discussion of biogas generators that the generators use animal manure as inputs. So, can we reduce pollution from livestock farms - whether they're factory farms or not - by converting the waste into biogas?
Livestock Animal Treatment
As indicated in The Meatrix video, a major issue raised by livestock is in the treatment of livestock animals. These animals are often treated very poorly. If we care about the animals for their own sake, then we will care about how they are treated in factory farms and elsewhere. This relates to the ethics concepts of speciesism and anthropocentrism as discussed in Module 3. On speciesism, philosopher Jeremy Bentham wrote, The question is not, Can they reason? nor Can they talk? but, Can they suffer?
For better or worse, there is quite a lot of suffering experienced by livestock animals, especially those in factory farms. Because of this, there are people who advocate against consuming the products of factory farms. If we boycott these products, then the animals’ conditions will change. This, combined with the environmental and public health impacts of livestock, are two primary reasons that some people choose vegan or vegetarian diets, or reduce their consumption of animal products within an omnivorous diet. We’ll discuss food choice later in this module, but for now, please consider the issues raised by your own choices of which foods to eat.
Nutrition
Nutrition
Thus far, this module has focused mainly on agriculture, i.e., on the production of food. Now we’re going to look at a main end use of food: nutrition. Nutrition here refers broadly to all of our bodies’ physiological needs that we must get through food, including water, energy, proteins, vitamins, and minerals. Without proper nutrition, we will be frail, sick, or even dead. Nutrition is thus a crucial end use of food, though it is not the only end use. Nutrition also has important environmental and social components.
Basic Nutritional Needs
While different people can have somewhat different nutritional needs, there are broad similarities across all humans.
Reading Assignment: The Healthy Eating Pyramid
In the United States, most of us are familiar with the food pyramid published by the United States Department of Agriculture (USDA). In 2011, the USDA released MyPlate as a substitute for the outdated MyPyramid, but these food icons have been criticized for not using state-of-the-art nutritional information and for being biased by lobbying from agriculture businesses.
Nutritionists at the Harvard University School of Public Health have published the Healthy Eating Plate and Healthy Eating Pyramid as alternative ways of conceptualizing basic nutrition. Please read the brief overview of the Healthy Eating Pyramid.
As you read this, be sure to take a close look at the details of the pyramid, in particular which foods are recommended to be eaten frequently or infrequently.
One important point to see from the Healthy Eating Pyramid is that animal-based foods (meat, dairy, eggs) should, in general, be eaten less frequently than plant-based foods. This is an important insight, especially when considering the other issues associated with animal-based diets. At stake here is the following: Is eating fewer animal foods a collective action problem? As the previous page in the module showed, there are societal problems associated with animal foods. If animal foods are good for us individually, then there could be collective action problem. On the other hand, if animal foods are bad for us individually, then there would be no collective action problem, and eating fewer animal foods would be a win-win situation for individuals and for society. Nutritionally, eating fewer animal foods can be good for us individually. But remember, nutrition is not the only end use of food. We should not forget that many individuals enjoy the taste of animal foods, or have other reasons for consuming them.
Famine
A famine is an event in which many people lack adequate food and in turn adequate nutrition, often resulting in significantly higher death rates. Famines – and, more generally, hunger – continue to this day. This can be seen, for example, in the Fighting Famine section of World Food Programme website. The World Food Programme is a division of the United Nations dedicated to providing humanitarian food aid around the world.
Note that a famine specifically involves lack of access to food; it does not necessarily involve lack of food. Indeed, in many cases, famines have occurred despite there being no overall food shortages. The food may be located in the wrong place, or it may simply be too expensive to be purchased by those in need. Such cases were described in the article In Corrupt Global Food System, Farmland is the New Gold earlier in the module. Please revisit this article to identify cases of famine and hunger. If famine can be caused by lack of funds to purchase food, then poverty can cause famine, or at least it can be a major factor in a famine system.
Famines can also be caused intentionally by human activities. For example, during World War II, the German army waged what is known as the Siege of Leningrad. Leningrad, now known as Saint Petersburg, is a large Russian city located on the Baltic Sea between Finland and Estonia. The siege lasted almost 900 days from 1941 to 1944. During this time, the city was cut off from supplies and a famine ensued. About 1.5 million people died, making the siege one of the larger famines in human history, although certainly not the largest.
Finally, famines can be caused by environmental factors. One environmental factor has already been discussed in this module: plant diseases, such as the potato blight that caused the Irish potato famine. Livestock animal diseases can also decrease food supplies, but typically not as much as plant diseases because it’s easier to obtain nutrition without animals than it is without plants. Two other major environmental contributors to famines are droughts and floods. Indeed, droughts and floods are commonly implicated in famines around the world. There have even been famines caused by large volcanic eruptions, because the ash enters the sky, blocking sunlight. 1816 is known as the “year without summer” across the northern hemisphere because of the eruption of the Mount Tambora volcano in Indonesia. We’ll further discuss environmental causes of famines in Module 8 on natural hazards.
Obesity
Nutrition problems can also occur when there is too much food, as seen in the incidence of obesity. Obesity rates in many parts of the world have become so high that there is talk of an obesity epidemic. It might seem odd or inappropriate for the world to simultaneously have widespread hunger and widespread obesity, but that is the case in today’s world. Out of a total population of about 8 billion today, there are about 1 billion undernourished (hungry) people and about 500 million obese people, though note that there is no single precise way to determine who is or isn’t undernourished or obese.
The causes of obesity are complex and relate to more than just food and nutrition. For example, exercise is also an important factor, as might be the quality of the calories consumed. Genetics may also play a factor, as may the chemicals used to treat and package our food known as endocrine disruptors. More research is needed before we have a definitive idea of all the different factors that contribute to obesity, but needless to say, it appears that the causes are multiple.
Relevant to this module, obesity has been connected with industrialized agriculture. Our industrial agriculture system produces large quantities of grains, in particular, maize. These high-calorie crops lead to high-calorie foods, including sugary foods made with high fructose corn syrup. This agriculture system also produces large quantities of animal foods, which can be higher in certain fats, as indicated by the Healthy Eating Pyramid.
Food Choice and Policy
Food Choice and Policy
Given all that we have learned about food and agriculture, what should we do about it? Which foods should we as individuals choose? Which policies should societies implement? These questions represent individual and collective action on food and agriculture.
Food Choice
Many factors are relevant to which foods we should choose for ourselves. We may want proper nutrition, tasty meals, convenience, and low cost. We might want the cultural meaning associated with certain foods, such as foods from certain parts of the world or certain religious traditions. We might also care about the impacts our foods have on other people, on the environment, and on livestock animals. There may be other relevant factors as well.
One way or another, which foods we should choose is an ethical question. The more altruistic we are, the more likely we are to care about the impacts of our foods on others, and vice versa if we are selfish. If we are speciesist, then we are unlikely to care about impacts on livestock animals. If we are anthropocentric, then we are unlikely to care about impacts on the environment, except to the extent that the environmental impacts affect people. If we care about distributive justice, then we may choose foods that leave more food available for others.
Sustainable Food Consumption
Like the term sustainability, sustainable food consumption has been defined in various ways. In general, we define sustainable food consumption as choosing food which is good for health and the environment. For food consumption to be sustainable, it has to do “more and better with less”: we obtain more nutrition from food while minimizing the use of natural resources and environmental impacts. Sustainable food consumption is often exemplified by a locavore who eats locally grown or produced food. But a word of caution: food grown or produced locally, or bought from farmer’s markets, is just as likely to be grown using unsustainable and environmentally harmful inputs like chemical pesticides and fertilizers as food at the grocery store. And while local food may travel fewer food miles (i.e., the distance food takes on its way to consumers from producers), its production may generate just as much greenhouse gas as food produced further away. BUT, there is one sustainability advantage that eating locally grown produce from a farmer's market does offer: you can meet the farmer and ask them how they run their farm. This allows you to be an informed and (more) sustainable consumer. Who would you ask at the grocery store?
Recall the concept of commodity chains from Module 1. Now, think about where you can place yourself on the food supply chain and why concerns about where food comes from and how it gets to your plate matter. To fully embrace the idea of sustainable food consumption, changing what we eat is just as important as changing where it is from. In the Livestock's Long Shadow section of this module, we looked into the environmental impacts of consuming meat and dairy products and explained why a plant-based diet leads to a more sustainable environment.
The following video highlights the hidden environmental and social costs of hamburgers. Here are some questions to consider as you watch the video (7:52):
- Are contemporary food production and consumption sustainable?
- Does geography matter to food availability and food choice?
- Are there other steps or efforts toward sustainable food consumption?
- Can sustainable food consumption be promoted through creating social norms?
SARAH TERRY-COBO, NARRATOR: It's time to confront a major threat to our global environment. Cows. Yep. Turns out that worldwide, livestock are a major contributor to greenhouse gas pollution, right up there with cars, planes, and trains. And at the rate we're producing beef worldwide, emissions from cows, along with other harmful practices in beef production, threaten to mess up our climate, land, and water big time.
On average, Americans eat three times more meat than people in other countries. From the end of World War II to the mid-1970s, beef consumption per person doubled. The US is now the largest beef producer in the world. Our beef industry is a powerhouse worth $74 billion a year and providing millions of jobs.
Today, more and more Americans are choosing chicken and pork, even tofu. But much of the meat we eat is still beef. Let's look at an All-American food, the hamburger. On average, we eat about three burgers per week. So let's see if all 313 million Americans eat three burgers per week, that's 156 burgers per person per year. Altogether, that's more than 48 billion burgers every year.
A quarter pounder at a fast food joint costs about $3 or $4. That's pretty cheap. But what we don't pay for at the counter we end up paying for in other ways. What are the hidden costs?
First of all, cows take up a lot of space. Worldwide, livestock use 30% of the entire land area. That's counting pastures and land use to grow grain for feed. We use about eight times as much land for feeding animals as for feeding humans. And in places like Brazil, acres of forest are still being cleared for livestock, which creates pollution and also removes a perfect sponge for absorbing carbon dioxide. And did someone mention water? It takes about 1800 gallons of water to make a single pound of grain-fed beef. That's about four times the amount for chicken and more than 10 times the amount for a pound of wheat.
Why does it take so much land and water to feed cows? Well, for one thing, cows eat a lot. During the first six months, a calf eats and eats and eats. When it's about 700 pounds, it's sold at auction, usually to a feedlot, which is like a very crowded cow city. At the feedlot, the cow continues to eat and eat and eat. At most feedlots, cows eat a mixture of soy and corn.
This whole feed system's pretty new. Before the 1970s, cows ate mostly grass. Then Congress passed a farm bill that changed everything. The government started paying farmers to grow feed crops like corn and soy and also helped pay for more fertilizer. So voila. Now corn is in everything from sodas to cereal. And most of the country's 90 million cows now get corn for breakfast, lunch, and dinner. Unfortunately, cows are built to digest grass. Corn can make them bloat with gas, and cows make a lot of gas.
This is no joke. See, cows are ruminants, meaning they create methane gas when they digest food. Chickens and pigs don't. Methane has 21 times more climate changing power than CO2. In America, cows produce more greenhouse gas than 22 million cars per year.
America's cows create about 500 million tons of manure in a year. That's three times as much as we humans do. Cow manure also creates nitrous oxide, which has 300 times the global warming effect of CO2. Cow manure is responsible for 2/3 of all the nitric oxide pollution in the world.
There's another source of nitrous oxide in a cow's lifecycle-- fertilizer. We Americans use about 17 billion pounds of nitrogen fertilizer to grow feed for our cows. When runoff from fertilizer and manure flow into rivers and then to the ocean, they create huge algae blooms, which suck the oxygen out of the water and leave dead zones where no life can survive. Anyway, back to the feedlot.
Once the cows are fattened up, they head to the slaughterhouse. Slaughterhouses create about 30 million pounds of contaminants a year, mainly nitrates and ammonia used to disinfect meat. From the slaughterhouse, the beef is shipped to big processing centers where California beef is mixed with Texas beef and Colorado beef. One burger patty can contain the DNA of more than 1,000 cows. That means a single case of E. Coli could easily spread to thousands of burgers. Trucking all that beef around creates pollution too.
This isn't an exact science. And the numbers vary depending on how the cows were raised. But a single quarter pounder clocks in at about 6 and 1/2 pounds of greenhouse gases. That might not sound like much, but with Americans eating three burgers per week, that's more than 158 million tons of greenhouse gases per year, about the same amount as 34 coal-fired power plants.
It's not the cow's fault. It's a system we've created to mass produce beef that's the problem. Too many burgers take a toll on the environment. They can take a toll on your body, too.
This is the recommended daily diet. And this is how most Americans actually eat. We eat too much meat, grains, fat, and sugar, and not enough fruits and vegetables. Many studies show that eating too much red meat can lead to heart disease, high blood pressure, and even diabetes.
The hidden costs add up. One research group figured the cost just in greenhouse gases, water for growing cow feed, and health care at about $1.51 for every burger. Multiply that by the 48 billion burgers Americans eat every year, and that's more than $72 billion. We don't pay for it at the store or fast food joint, but we pay for it in other ways.
So what can we do? Well, we don't have to give up meat to change our impact. Cutting out just one burger per week would remove as much greenhouse gas pollution as taking your car off the road for 350 miles. If all Americans ate no meat or cheese one day a week, it would have the same climate change prevention effect as taking 7.6 million cars off the road for one year.
And while it's more expensive, grass-fed beef does less damage to the environment. Even the smallest choices make a big difference to the environment, to our neighbors, to our health. In the US, people are starting to eat less, but the rest of the world is eating more. Just imagine what if all 1.3 billion people in China eat three burgers a week like we do? Could our planet keep up?
Food choice, climate change, and sustainability are closely related. Fundamental changes in food consumption and diet are essential for achieving sustainabilty. Just as you must develop your own intuition about ethics, you must decide for yourself which foods you think you should choose. This module aims to help inform your choices, not to make them for you.
Food Policy
Which food (and agriculture) policies society should choose also is an ethical question, one that members of society must come together to decide. Here are some major issues in food policy.
Agriculture Subsidies
Many countries, in particular the wealthier ones, heavily subsidize agriculture. In the United States, agricultural subsidies are about $15 billion per year, or roughly 0.5% of the total federal budget. Corn receives the largest subsidy, about $4 billion. These subsidies help keep agriculture yields high and food prices low. The subsidies significantly decrease the risk of famine and keep countries more self-sufficient in food, which can be important if any geopolitical instabilities occur. On the other hand, the subsidies can cause excessive amounts of food production, leading to increased environmental damage and obesity. The low prices can also hurt farmers in countries that don’t have subsidies. Poor, small-scale farmers in poor countries are put at a great competitive disadvantage by the subsidies of rich countries, despite the fact that labor costs are much lower for the poor. Finally, the money used for subsidies could go to other public or private purposes if the subsidies weren’t there. While lobbyists from the agriculture industry fight hard to keep subsidies, there is much controversy and debate about whether the subsidies should be maintained.
Genetically Modified Organisms (GMOs)
If you live in the United States, you have probably eaten GMOs on a fairly regular basis. Humans have been modifying the genetic makeup of organisms since the early days of agriculture, simply by selectively breeding plants and animals with desirable traits. Over time, this shifts the genetic makeup of the plants and animals. However, in recent years humans have learned how to manipulate genetics more aggressively, including by inserting genes from one organism into that of another. For example, plants have been genetically designed to be resistant to certain pesticides. The design work is often performed by the same company that sells the pesticides. GMOs are controversial for several reasons and recent years have seen a growing debate over labeling for genetically modified products. Their long-term health and ecological effects are poorly known with no adequate testing, though short-term health effects are generally negligible. Once the new genes are released into fields, they can spread widely and are almost impossible to contain. Finally, the genes are often patented by the companies that design them, giving the companies extensive legal power over certain types of life. World regions are divided on the merits of GMOs. In particular, Europe has been much more hostile to them than the United States, leading to major international trade disputes.
Food vs. Fuel
As concerns mount about the sustainability of energy resources, there are more and more efforts to produce fuels from farmed plants, known as biofuels. Brazil has been particularly active in producing biofuels, in part because its land is well-suited to growing sugarcane. Brazil and the United States produce about 90% of the world’s biofuels. But biofuels are controversial because they result in reductions in the amounts of food available. This controversy is especially large because, in general, it is the rich who can afford the fuel and the poor who need the food. The thought of some people going hungry so that other people can have biofuels for their cars is a difficult ethical debate for many people involved in the issue.
Sustainability
The overall sustainability of human society is a major policy issue, and the sustainability of agriculture is too. Some key aspects of sustainable agriculture have already been discussed. The use of fossil fuels and fossil water cannot be sustained as these resources are depleted. Agriculture systems with low yield stability are vulnerable to disturbances in which yields are not sustained. Other important aspects of sustainable agriculture include agriculture's connections to climate change and biodiversity, which will be discussed later in the course. A lot is at stake with sustainable agriculture: if our agriculture system cannot be sustained in some form, then we will end up without food to eat, and we will face catastrophic declines in the human population and civilization.
Summary
Summary
In this module, we covered some of the key concepts and debates related to food and agriculture systems. We have reviewed how industrial agricultural has fed large portions of the human population while having other major environmental and social impacts. We have considered some unique issues posed by the use of livestock animals. We have explored connections between food, agriculture, and nutrition, including challenges such as famine and the obesity epidemic. We have examined some individual and collective action issues associated with food, agriculture, and sustainability.
You may have begun this course taking much of what you find on your grocery store shelves for granted. After working through this module, it is hoped that you now better understand what processes and issues are behind keeping these shelves stocked and how important these issues are today and for the future. Finally, it is hoped that this will serve as a foundation from which you will be able to decide for yourself what role you could play in sustainable practices related to the food you eat.
Module 7 - Urban Planning
Introduction
About Module 7
Module 7 begins with the concept of urban landscapes and then looks at different aspects of urban development with an emphasis on transportation and urban design. These two topics are important to study together because of how closely interconnected they are. The designs of the urban areas we live in influence our choices of transportation. Likewise, our tastes for transportation influence the designs of our urban areas. And both transportation and urban design have large impacts on the environment. Next, the module briefly reviews the environmental impacts of urban form focusing on a few major contributors. Following the discussion of urban environmental problems, the module ends with an examination of what cities can do to become more sustainable and resilient with real-world examples.
What will we learn in Module 7?
By the end of Module 7, you should be able to:
- define the concept of an urban landscape, and discuss the role that landscape plays in major world cities;
- explain the connection between urban design and transportation, in particular for pedestrian-oriented neighborhoods, streetcar suburbs, and automobile suburbs;
- discuss the environmental impacts of urban form;
- know the representative examples of sustainable urban development;
- explain the challenge of transitioning to new states, in particular sustainable states, including the transition of physical infrastructure and the transition of our minds.
As you read through this module, look for ways that these key concepts are integrated in the topics we will cover here as well as previous modules.
What is due for Module 7?
There is a Written Assignment associated with Module 7. For assignment due date, check Canvas.
| Requirement | Location | Submitting Your Work |
|---|---|---|
| Reading Assignment: Liberating Cities from Cars | Urban Design and Transportation | No submission |
| Written Assignment: Sustainable Cities | Written Assignments | Submit in Canvas |
Questions?
If you have any questions, please post them to our Course Q & A discussion forum in Canvas. I will check that discussion forum often to respond. While you are there, feel free to post your own responses if you, too, are able to help out a classmate. If you have a more specific concern, please send me a message through Inbox in Canvas.
Urban Landscapes
Urban Landscapes
In Module 2, we learned that in geography landscapes are defined as the combination of environmental and human phenomena that coexist together in a particular place on Earth's surface. Urban areas are some of the most striking examples of human-environment landscapes. They involve the highest levels of human activity and are often heavily shaped by environmental factors.
Let’s start by examining New York City, the largest city in the United States and one of the largest cities in the world. (Tokyo is usually considered to be the world’s largest city.)

The landmass at the center of Figure 7.1 is the island of Manhattan. The Hudson River is towards the top and the East River is towards the bottom. The left edge shows the Hudson and East Rivers converging at New York Harbor. Across the Hudson from Manhattan is New Jersey. Across the East River is Brooklyn, which is on the tip of Long Island.
New York Harbor is one of the best natural ports in the world. Ships of all sizes can enter a space largely free from oceanic turbulence and dock along a remarkably long total length of coast. New York City emerged as an important port town in colonial times and remains a shipping center to this day, as can be seen from the rectangular shipping facilities protruding out into the rivers in various places. As the island located in the center of the navigable space, Manhattan emerged as the center of development within what is now the New York City metropolitan area.
There are other great harbors along the eastern coast of the United States, such as Boston Harbor and Baltimore Harbor:
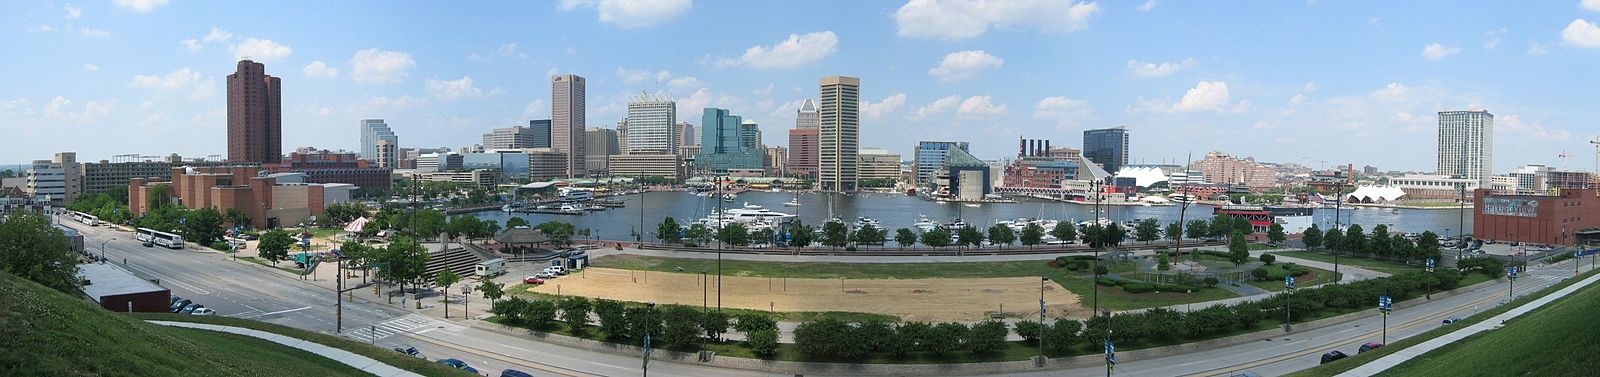
It is no coincidence that all three of these excellent natural harbors became major US cities. Their environmental advantages over other locations initiated development that persists to this day. There is an environmental explanation for why New York ended up becoming the largest city in the United States instead of Boston or Baltimore. To see it, we need to observe the environment at a broader scale. Take a close look at the eastern part of this topographic map (Figure 7.4), and be sure to "Click to Enlarge East Coast":

Note the Appalachian Mountains running continuously from Georgia through Maine (and beyond into Canada) with one major exception: the route from New York City north along the Hudson to Albany and then west between the Catskills in southeastern New York and the Adirondacks in northern New York. The Hudson is a very wide river and remains navigable through Albany. In the 1800s, the Erie Canal was built in the corridor between the Catskills and Adirondacks. This connected the east coast with the Great Lakes and, in turn, the interior of the country. New York City thus became the center of trade between the US interior and the rest of the world. As the interior grew in importance, so did New York.
Many other important world cities emerged because their excellent natural harbors were used for ports. Here are some examples.
Vancouver, BC Canada
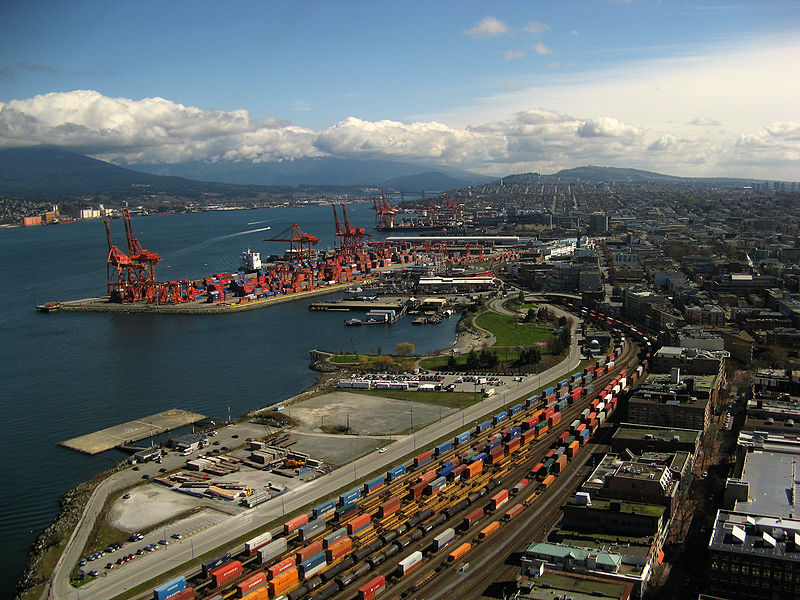
Shanghai, China
Hamburg, Germany
Rio de Janeiro, Brazil
Rio de Janeiro has one of the most spectacular urban landscapes in the world. Figure 7.8 shows a beachfront lined with tall buildings at the mouth of the Guanabara Bay. The Atlantic Ocean is just to the right of the image. The large, steep mountain in the middle is Sugarloaf Mountain (Portuguese: Pão de Açúcar). Rio de Janeiro was founded by the Portuguese and became an important port for trade with Brazil’s interior. Figure 7.9 offers another view of the city:
This image looks towards the Atlantic coast. It shows several mountains and some tall buildings along the coast. In the foreground is a dense collection of smaller buildings draping a hillside. This hillside area is Rocinha, the largest favela (slum) in Rio de Janeiro and one of the largest in the world. Slums are often located on hillsides where building conditions are weaker and access to the center city is worse. If you look carefully at Figure 7.9, you’ll see many buildings in Rocinha in which the upper floors are architecturally different than the lower floors. These upper floors are simply tacked on top of the lower floors in an ad hoc fashion. All this renders Rocinha and other hillside favelas vulnerable to mudslides. The favela mudslides in Rio de Janeiro raise environmental justice issues similar to those discussed in the Module 5 section on development's downsides.
Venice, Italy
Another urban landscape heavily defined by water is Venice, Italy. Venice is noteworthy for being entirely car-free. All travel is via either walking or boats.
Urban landscapes may appear to be dominated by human activity. As the images in this page show, the environment is often a major factor in urban form. For example, the locations of natural harbors affect where major port cities end up. But human factors still play major roles. The human role is especially vivid in cities that were built from scratch in order to serve as a political capital, including Washington in the United States, Brasilia in Brazil, Abuja in Nigeria, Canberra in Australia, and Islamabad in Pakistan. These cities emerged as they did largely for social reasons instead of environmental reasons. For example, the location for Washington was chosen to be between the political north and south. When examining an urban landscape, it is important to consider both environmental and social factors and to recognize that cities are parts of human-environment systems.
For the remainder of this module, we’ll focus on a few aspects of cities that are of great importance to sustainability.
Urban Design and Transportation
Urban Design and Transportation
Why are there cities? Why do large numbers of people cluster near each other? Sometimes the reasons are predominantly environmental, such as the people who cluster at natural harbors to work at ports. Other times, the reasons are predominantly social, such as the people who cluster at political capitals to work in government. But whatever the reason, cities invariably exist so that people can interact with each other in person. Interacting with each other in person requires transportation. We travel from home to work, shopping, entertainment, and civic spaces.
Transportation is, thus, fundamental to the proper functioning of a city. A city is more likely to succeed when people can get around town easily, quickly, inexpensively, and safely. Transportation is important to cities, but cities are also important to transportation. Indeed, our transportation choices are heavily influenced by urban design. To see this, we’re going to look at three types of neighborhoods: pedestrian-oriented neighborhoods, streetcar suburbs, and automobile suburbs.
Reading Assignment: Liberating Cities from Cars
Please read the article "Liberating Cities from Cars" on the Planetizen website.
As you read this, think about your answers to the questions below:
- What are some potential benefits of fewer cars on city streets?
- What are some typical components of reducing cars on streets?
- What are some challenges to the implementation of such car-reducing strategies?
Pedestrian-Oriented Neighborhoods
Let’s start by looking at Acorn Street on Beacon Hill in Boston:
Beacon Hill is just north of Boston Common, which we studied in Module 4. It is, thus, immediately adjacent to downtown Boston, where there are many places to work, shop, and seek entertainment, among other things. One can easily walk to all of these places. But look at the photo. This urban area is also designed in a way that makes walking easy and desirable. Beacon Hill was developed mostly in the 1800s when walking was the transportation mode of choice. Today, Beacon Hill is a very wealthy neighborhood. Many people there can afford cars, but they often choose not to use them because walking is a more attractive option.
Streetcar Suburbs
Now take a look at another part of Boston: Jamaica Plain.
This image shows Centre Street in Jamaica Plain, about four miles southwest of Beacon Hill and downtown Boston. Notice the rail line going through the middle of the street. This is for a streetcar – the “E” on Boston’s Green Line. This type of neighborhood is called a streetcar suburb because it was designed for residents to commute into the city via streetcar. Similar streetcar suburb neighborhoods exist in many cities across the United States. These neighborhoods were built mainly in the early 1900s. They are more sparse than neighborhoods built mainly for pedestrian travel, but they are dense enough to keep houses within walking distance of streetcar stops. Likewise, they’ll almost always have sidewalks. There are often small “main street” style stores near the streetcar stops. People might shop at these stores on their way to or from work.
As an interesting side note, the E no longer goes through this part of Jamaica Plain. In 1985, it was “temporarily” replaced by a bus line. Whether to bring the E back here is a controversial issue in the neighborhood. Elsewhere in the country, many streetcar systems have been dismantled. In at least some cases, the automobile and bus industry appears to have played a role in the change. Today, bus lines often run where streetcar lines once did, though many people in streetcar suburbs frequently use automobiles. The choice between cars and public transit is a collective action problem.
Automobile Suburbs
Now let’s switch over to another city, Rochester, NY. As with Boston, Rochester has a variety of neighborhoods that feature a variety of appearances. Here is one neighborhood towards the outer edge of the city:
This image shows an example of an automobile suburb. Automobile suburbs are neighborhoods designed for residents to commute into the city via automobile. As can be seen from the photograph, these neighborhoods are sparser than neighborhoods designed for walking or for streetcar transit. These neighborhoods often have no sidewalks because they are built with the assumption that people will not walk along the streets. Furthermore, offices, shopping and other destinations will often be in separate areas that are difficult to access without a car. For these reasons, almost all trips in automobile suburbs are made via car.
As the above discussion suggests, where we live has a large impact on what type of transportation we use. If we live in a pedestrian-oriented neighborhood like Beacon Hill, we’re a lot more likely to walk to get to places nearby and to take transit to go further away. If we live in a streetcar suburb, we’re likely to use a mixture of transit, walking, and cars. If we live in an automobile suburb, we’ll probably take cars almost everywhere we go. Two main factors in the impact of urban design on transportation choice are urban density and use mixture.
Urban Density and Use Mixture
Urban density is, in rough terms, the amount of urban development per unit area. Higher density can be achieved via taller buildings and narrower streets. It can also be achieved by putting more development in a given square foot of floor space, sidewalk space, etc. For example, when a single-family house is converted into two apartments for two families, urban density is increased with only minor tweaks to the building. Pedestrian-oriented neighborhoods tend to be higher density, and automobile suburbs tend to be lower density. Higher densities generally have lower environmental impacts, though there are some exceptions. For example, shorter buildings don’t require elevators.
Use mixture refers to the mix of types of end uses found within an urban area. A mixed-use area will have many different uses. Residences, office areas, shopping, entertainment, and the government will all be close together. This reduces the distances required for transportation and makes it easier to walk or bike from place to place. It can also help certain types of businesses. For example, many downtown business districts are very single-use areas and restaurants there are only open for lunch. In some cases, apartment buildings are opening up in the area, which helps more people walk to work and also brings customers to the restaurants at different hours. Pedestrian-oriented neighborhoods tend to be more mixed-use, and automobile suburbs tend to be more single-use. In general, mixed-use areas will have lower environmental impacts than single-use areas.
Resident Health
The health of people living in cities is affected by many factors. One important factor is the amount of exercise that they get. This, in turn, can be heavily influenced by urban design. When we drive everywhere, we don’t get any exercise unless we go out of our way for it. When we walk and bike everywhere, we get a lot of exercise just by getting around town. This is much healthier for our bodies. Even taking transit gives us some exercise because we have to walk to and from the transit stops. It is thus no surprise that people who live in pedestrian-oriented neighborhoods and streetcar suburbs are on average healthier than people who live in automobile suburbs. Of course, the urban environment does not completely determine what exercise we get. It’s entirely possible to be very healthy in an automobile suburb or very unhealthy in a pedestrian-oriented neighborhood. But promoting resident health is another reason to favor high-density, mixed-use, pedestrian-oriented development.
The Ugly Side of Urban Design
“Urban segregation is not a frozen status quo, but rather a ceaseless social war in which the state intervenes regularly in the name of “progress,” “beautification” and even “social justice for the poor” to redraw spatial boundaries to the advantage of landowners, foreign investors, elite homeowners, and middle-class commuters” (Mike Davis, 2006, Planet of the Slums, p. 98)
Many of the ways that cities have been planned contribute to inequities such as educational quality and occupational opportunity. Well-known federal policies such as redlining and Jim Crow laws may no longer be legal, but the effects of these segregationist practices endure in cities today, impacting various dimensions of life including access to quality education, economic prospects, and good health. And while these overtly racist policies no longer exist, other less-obvious practices still contribute to differential access to resources, the built environment, and social opportunities within cities and their suburbs. As you read the following material, consider the cities you know and think about the different opportunities that residents might have based on where they live within those cities. Social inequalities in metropolitan areas stem from past as well as continuing practices that determine where and what types of roadways and transit opportunities are implemented or improved, assign specific uses (e.g. industrial, commercial, or single family or multi-family residential) to certain neighborhoods, and influence where parks and greenways get built or streetscapes maintained.
Jim Crow Laws & Residential Covenants
From the time of reconstruction after the U.S. Civil War until 1968, Jim Crow Laws in the Southern United States enforced racial segregation in places such as parks, public transit, and schools, among many other places. While Jim Crow laws were enacted in Southern states, residential covenants in other states kept people of color from moving into certain neighborhoods. For example, in Minneapolis one of the city’s first segregated residential areas stated that residences “shall not at any time be conveyed, mortgaged, or leased to any person or persons of Chinese, Japanese, Moorish, Turkish, Negro, Mongolian, or African blood or descent.”
Red Lining
Beginning in the 1930s, the U.S. government, through the Home Owners Loan Corp (HOLC), the Federal Housing Administration (FHA), and the Veterans Administration (VA), created color-coded maps for every metropolitan area in the United States. These maps divided cities into areas based on the risk of making loans and assigned colors for risk, with red being “hazardous.” Areas where African-Americans lived were systematically marked red and deemed too risky to insure for mortgages. Additionally, the FHA openly argued in their Underwriting Manual that racial groups should not be integrated, even stating that highways would serve as a good barrier for keeping white and Black communities separated.
Legacies of exclusion still persist from Jim Crow Laws, racially-based covenants, and redlining. These practices of the past continue to impact opportunities for people of color of today. Please watch this short, seven-minute video on housing segregation and some of the impacts past policies have on access to resources today.
Required video: Housing Segregation and Redlining in America: A Short History, NPR Code Switch (6:36 minutes)
Chris Rock, Comedian/Actor: You know what's so sad, man? You know what's wild? Martin Luther King stood for nonviolence. Now what's Martin Luther King? A street. And I don't give a f*** where you at in America, If you on Martin Luther King Boulevard there's some violence going down.
Gene, Narrator: That, of course, is Chris Rock’s famous joke about streets named for Martin Luther King Jr., which tend to be in -- let's say distressed areas. And he’s not wrong, because if you look at the way housing segregation works in America you can see how things ended up this way. Once you see it, you won't be able to unsee it. OK, let’s look at MLK Boulevard in Baltimore. I want to show you how to see housing segregation in schools, in health, in family wealth, in policing. But first, an explanatory comma.
It’s the 1930s in the wake of the Great Depression. FDR is president. He wants to bring economic relief to millions of Americans through a collection of federal programs and projects called The New Deal.
One part of that "new deal" was The National Housing Act of 1934, which introduced ideas like the 30-year mortgage and low, fixed interest rates. So now you have all these lower-income people who can afford homes, but how do you make sure they don't default on their new mortgages? Enter the Home Owners Loan Corp. The HOLC created residential security maps. And these maps? They're where the term redlining comes from. Green meant “best area, best people,” aka businessmen; blue meant “good people,” like white-collar families; yellow meant a “declining area,” with working class families; and red meant “detrimental influences, hazardous," like “foreign-born” people, “low-class whites," and -- most significantly -- “Negroes.” Again and again on these HOLC maps, one of the most consistent criteria for redlined neighborhoods is the presence of black and brown people.
Let’s be clear. Studies show that people who lived in redlined areas were not necessarily more likely to default on their mortgages. But redlining made it difficult — if not impossible — to buy or refinance. So landlords abandon their properties. City services become unreliable. In most places, crime increases. And property values drop. All of these conditions fester for 30 years as white people flee to the brand new suburbs popping up all over the country. Many of those suburbs institute rules, called covenants, that explicitly forbid selling homes to black people. And all of this was perfectly legal.
Now it’s 1968. And MLK is assassinated. News Report: Good evening. The Rev. Dr. Martin Luther King, 39 years old, The apostle of nonviolence in the civil rights movement has been shot to death in Memphis, Tenn. Martin Luther King was shot and was killed tonight in Memphis, Tenn. In the aftermath, Congress passes the Fair Housing Act of 1968. It's a policy meant to encourage equal housing opportunities regardless of race, or religion or national origin. And it offers protections for future homeowners and renters, but does little to fix the damage already done.
Over the next 50 years, the Fair Housing Act is rarely enforced. So you can still see housing segregation and its effects, in Baltimore and often along any MLK Boulevard in any U.S. city. Like its effects on wealth. So homeownership is the major way Americans create wealth, right? Well, discrimination in housing is the major reason that black families up and down the income scale have a tiny fraction of the family wealth that white families do -- even white families with less education and lower incomes. For almost 30 years, 98 percent of FHA loans were handed out to white borrowers. Not only were black neighborhoods redlined, and not only was the Fair Housing Act selectively enforced, if at all, but it is still today much harder for a black person to get a mortgage or home loan than it is for a white person.
John P. Comer, Architects for Justice Advocate: Families are fearful of speaking up about a basic human right that should be afforded to everyone in the world but definitely in the richest country in the world. And housing segregation in schools. The primary way that Americans pay for public schools is by paying property taxes. People who live in more valuable homes have better-funded local schools, better-paid teachers, better school facilities and more resources.
Here’s a feedback loop: The better the schools in a neighborhood, the more those homes in that neighborhood are worth. And the higher the property values of those homes, the more money there is for schools. And so on and so on. And housing segregation in health. Because of urban planning that benefited those richer, whiter neighborhoods, people of color are more likely to live near industrial plants that spew toxic fumes; they're more likely to live far away from grocery stores with fresh food, and in places where the water isn’t drinkable. They're more likely to live in neighborhoods with crumbling infrastructure, and in homes with toxic paint.
Karen Holliday, Baltimore Resident: When you're living with rats, roaches, and things like that -- that's deplorable. You cannot have that kind of stuff with children running around in the building. A building that may be full of lead. And, not coincidentally, people of color have higher incidences of certain cancers, asthma and heart disease.
And housing segregation in policing.Housing segregation means we are having vastly different experiences with crime and vastly different experiences with policing. Because our neighborhoods are so segregated, sometimes racial profiling can be camouflaged as spatial profiling — where living in certain areas can make you more likely to be stopped by the police. And it means people have a lot of unnecessary contact with the criminal justice system just because of where they live.
Reggie Green, Baltimore Resident: The problem in our city? The police and the citizens are fighting. They keep targeting my brothers and sisters who don't really have nothing. And that heavy, aggressive kind of policing that you see in black neighborhoods in particular makes people feel like they can’t trust the police. And when people don’t trust the police, crimes go unsolved and people have to find other ways to keep themselves safe.
But, of course, it’s not just Baltimore. Because housing segregation and discrimination fundamentally shape the lives of people in nearly every major American city. It really is in everything. To hear more about how race shapes American life, visit npr.org/codeswitch. I'm Gene Demby. Be easy.
Urban Design, Development, & Exclusion
Redlining, racially-based covenants, and Jim Crow laws may no longer be legal means of segregation, however, less obvious strategies of exclusion persist in urban and suburban environments today. The design of cities and the built environment determines how residents can use and benefit from the city. Some factors that contribute to who lives where include the presence of sidewalks, access to public transportation, or even residential restrictions allowing only single-family homes to be built in certain areas. These less obvious forms of segregation impact who can access certain places based on car ownership or economic factors. Highways are also a tool used as a physical barrier separating neighborhoods by race or class. Using urban design and the built environment as tools to regulate public behavior and activities are not limited to the United States.
Haussmann’s Paris
In the 1850s, Emperor Napoleon III hired Georges-Eugène Haussmann to build grand boulevards through Paris’ most densely populated neighborhoods. In an effort to eradicate squalor and improve the health and appearance of Paris, Haussmann widened many of Paris’ streets and created a uniform design for the exterior of buildings. Today we think of these large, grand streets and the unique architecture of the center of Paris as emblematic of the city, but Haussmann also argued that his strategies prevented civil unrest and armed uprisings in Paris’ dark, crowded center-city. The wide streets would enable the military to easily navigate through the city, preventing Paris’ tightly built quarters from easily erecting barricades and serving as fortifications in uprisings. There may have been a military argument to these design changes, but the main effects of Paris’ widened streets decreased population density, increased rents, and forced low-income residents to relocate to outer suburbs.
Moses’ New York
Just as Haussmann shaped contemporary Paris, Robert Moses is credited with shaping New York City’s built environment. One of Moses’ greatest critics, the historian Lewis Mumford, wrote, “In the twentieth century, the influence of Robert Moses on the cities of America was greater than that of any other person.” Moses pushed through the building of almost 500 miles of urban highways, including the Triborough Bridge. He also built parks and playgrounds and developed beaches such as Jones Beach State Park for public use. His vision for an automobile-oriented city influenced cities across the country, ushering in a mode of urban planning focused on automobile use. Similar to Haussmann, Moses’ vision of a city had little sympathy for poorer residents and people of color. He used strategies such as building bridges too low to allow for public transit buses, thus limiting the access of poorer residents to places such as the newly developed public beaches. Often poorer residents were forced to relocate for the building of urban highways.
For an extensive history of Robert Moses’s impact on New York, and politics in general, read Robert Caro’s biography The Power Broker, which is available through the Penn State Libraries.
Environmental Impact
Systemic racism and classism also have implications for biodiversity and the ecological health of cities. Read this passage from the University of Washington discussing a review paper written by scientists from three universities:
“For example, several studies the authors included found fewer trees in low-income and racially minoritized neighborhoods in major cities across the U.S. Less tree cover means hotter temperatures and fewer plant and animal species. Additionally, these areas tend to be closer to industrial waste or dumping sites than wealthier, predominantly white areas — a reality that was put in place intentionally through policies like redlining, the authors explain.
Fewer trees, over decades, has led to pockets of neighborhoods that are hotter, more polluted, and have more disease-carrying pests such as rodents and mosquitoes that can survive in harsh environments. These ecological differences inevitably affect human health and well-being, the authors said.”
You can read the full review paper here: https://science.sciencemag.org/content/369/6510/eaay4497
Environmental Impacts of Urban Form
Environmental Impacts of Urban Form
Cities have many different impacts on the environment. Furthermore, different types of cities will have different environmental impacts. Here we consider some major contributors. As you read about these contributors, think about how they might be interconnected with one another.
Transportation Mode
A transportation mode is a way of getting around, such as walking, driving, bicycling, bus, or subway. Non-motorized transportation – walking, bicycling, etc. – is almost always quite a lot more efficient than motorized transportation. Bicycling is actually more efficient than walking because there is less friction with the ground. Walking can achieve the equivalent of about 350 miles per gallon of gasoline; cycling can achieve the equivalent of about 700 miles per gallon of gasoline. However, the difference between the two is smaller once the energy required to produce and recycle/dispose of the bicycle is factored in. And of course, the energy here comes not from gasoline but from whatever food is being eaten by the person walking. The overall environmental impact, then, depends on what types of foods are being eaten.
The efficiency of a car, bus, or train depends heavily on how many people are in it. A bus at average and maximum passenger loads gets about 40 and 330 miles per gallon per passenger, respectively. Note that this does not factor in the energy consumed by the passengers’ bodies as they sit or stand in the bus. Trains can be even more efficient than buses because their metal wheels and rails have less friction than buses’ rubber tires on pavement. Furthermore, trains can move larger volumes of passengers. A bus or train with one passenger will consume a lot more energy than a car with one person in it. This means that cars are not necessarily the least efficient option.
Consider This: Transit and Traffic: A Collective Action Problem
Have you ever been stuck in traffic? Did you enjoy it? Most people don’t. We would rather get to our destination sooner.
If you live in an area where both cars and transit are options, then you may face a collective action problem. In this scenario, regardless of what everyone else does, you’ll reach your destination faster if you drive. However, if everyone takes transit, then everyone will reach their destinations faster than if everyone drives. This is because transit can move more people along a street per unit of time. It’s like using a big fire hydrant hose to move water instead of a little gardening hose. Transit can do this because, in a bus or train, people can sit or stand right next to each other, whereas in cars there’s a lot more space between each individual person. Furthermore, when streets get crowded, there can be more people taking transit, meaning that the transit system can run vehicles more frequently and people have to wait less time for them.
Given what you know about collective action, how would you solve this problem?
Buildings
Buildings are perhaps the single biggest contributor to the environmental impacts of cities. There are major impacts throughout the lifecycle of a building. When buildings are constructed, they tend to require a lot of natural resources for the building materials and energy for the construction process. Then, once they’ve been built, they use a lot of energy for heating, air conditioning, lighting, and appliances. Finally, when the building is no longer desired, something must be done with the building materials.
One way to reduce the environmental impact of buildings is to use less building per person. When people live in smaller residences and work in smaller offices, their buildings will have lower environmental impacts. Apartment buildings can save a lot of energy in heating and air conditioning because apartments share walls with each other and thus don’t lose as much heat to the outside. Smaller residences also discourage people from buying lots of stuff because there is less space to put the stuff. This avoids the environmental impacts of manufacturing the stuff.
Green Buildings
The U.S. Green Building Council (USGBC) has implemented the LEED® program since 1998 to encourage sustainable building design, construction, operation, and maintenance. LEED stands for Leadership in Energy and Environmental Design and serves as a "yardstick" to measure the sustainability of structures by the design and construction industry. A LEED-certified building is often referred to as a green or sustainable building. If a building meets sustainability criteria, it receives LEED certification on one of four levels (LEED Certified, Silver, Gold or Platinum, from the lowest to the highest level). The rating is based on the points a building can earn for sustainable building site selection, maximized water use efficiency, minimized energy use and effect on the atmosphere, and advancements in indoor environmental quality (e.g., material, mechanical, and lighting performance).
Consider This: LEED buildings at Penn State
For example, Penn State's (UP campus) Stuckeman Family Building, home of the School of Architecture and Landscape Architecture, is a LEED Gold complex thanks to its sustainable features such as an exterior construction of recycled copper and durable brick, rainwater harvesting and recycling for landscape irrigation, intelligent lighting control system, and energy-efficient motorized windows that take advantage of natural ventilation (Probing Question: What is a LEED building?).
Air Quality
Cars, buses, power plants, factories, and fireplaces all put pollution into the air, affecting the health of everyone who breathes the air in. All else equal, cities with more of these activities will have more air pollution. But all is not always equal. Some urban areas have more air pollution even when they have the same amount of polluting activities. Here, the environment can be a big factor.
One way that a city can have worse air quality is if it is in an area with a temperature inversion. Usually, air along the surface is warmer because it receives warmth from the ground. Colder air is more dense, which is why we use hot air balloons to go up into the sky. When warmer air is along the surface, that air rises and mixes with the colder air above. This pulls pollution from the ground into the air above where it won’t be breathed in by people, thereby cleaning the surface air that we breathe. A temperature inversion is a scenario in which colder air sits along the surface and warmer air lies above. When colder air is along the surface, it doesn’t rise up into the sky and mix with the air above. Thus cities with temperature inversions tend to have worse air quality.
Temperature inversions are usually found in cities with a source of colder air and mountains that trap the cold air in. One example is Los Angeles, which receives cool air in from the ocean. Another is Salt Lake City, whose surrounding mountains also make for famous ski resorts. Here is a photograph from the ski slopes of the Alta resort. Mountains in the background can be seen poking up above low-lying clouds and smog, the result of a temperature inversion.

Here’s a view from a different site, showing the city in the valley below:
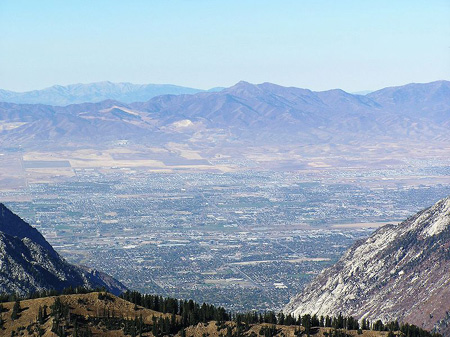
Sustainable Urban Development and Urban Farming
Sustainable Urban Development and Urban Farming
Here, we’ll look at some examples of how sustainable urban development has been achieved.
Urban Transit
Copenhagen Calms Its Traffic
Recall the "Cycling as a social norm in Copenhagen" video in Module 4. We have seen that getting people to choose transit can be a collective action problem, and the choice of transport mode can be supported or constrained by urban design. Here's another video (7:22 minutes) showing the efforts that have been made in Copenhagen to ensure that cars do not interfere with people. This approach known as traffic calming has been highly popular in Copenhagen despite it being located in cold, snowy Denmark.
[TEXT ON SCREEN]: Copenhagen's public spaces, car-free areas, & slow speed zones. First a bit of Copenhagen history...
JAN GEHL, GEHL ARCHITECTS: In Copenhagen, we had a great influx of cars starting in the middle of the '50s. We called it "The Car Invasion." And by the early '60s, it started to be really bad.
And in 1962, it was decided to take the cars out of the main street of Copenhagen. It's a one-kilometer-long street. There was great debate and discussion, it will never work.
All these businesses of will go broke, and the weather is not good enough for being outdoors in Denmark. But it was closed anyway. That was the start of a long trek where, in small installments, improvements have been made to the pedestrian landscape to the public spaces.
IDA AUKEN, MEMBER OF PARLIMENT, DENMARK: We actually have 18 squares now that used to be parking lots. And when they started shutting them down, and when they made the main pedestrian street here, people were saying, no, this is not Italy. People do not use the public space.
What are you thinking? They don't go walking like, just to take a stroll. And look what happened.
[POP MUSIC]
GIL PENALOSA, EXECUTIVE DIRECTOR, 8-80 CITIES, TORONTO: I think one of the wonderful things of pedestrian places is that they always surprise you. You don't know what's going to happen. Can we even imagine, for a second, what these pedestrian streets would be like if there were cars on it?
For example, these kids here with the hats, that's the symbol of graduation. They just finished their high school. They are graduating today.
They are going crazy. They are going into the fountains. And we see people also sitting on the floor. I mean, it's so nice and so well taken care of, that people can sit on the floors.
IDA AUKEN: People want to be with people. And that means we go where people are, where there are space for walking, for expressing yourself. For instance, yesterday I went down by the water. And in front of the Royal Theatre, there's this boardwalk. And there was outdoor tango all night.
NICOLE JENSEN, TRANSPORTATION PLANNER, CALGARY, ONTARIO: I mean, they're meeting each other. They're having a coffee. They're just chatting.
They're riding their bikes. They're walking. They're walking their dogs.
They're hanging out with their kids. Like, it's just amazing. They're just living. It's the perfect example of public space and how to do it right.
JAN GEHL: So we've seen this gradual transition of the city of Copenhagen, from a traffic-infested city to really, a people-oriented city, which is quite lovely.
[MUSIC PLAYING]
[TEXT ON SCREEN]: The importance of lowering speeds.
NIELS TORSLOV, DIRECTOR, CITY OF COPENHAGEN TRAFFIC DEPARTMENT: The philosophy of this is that if you can keep speed down, say, 30 k or 40 k, you will not have so many accidents. And if you have accidents, they will not be very severe. So that's the basic idea, that if we want to transfer our urban environment into something for human beings, you have to reduce the speed as one of the first things. I have very few examples with the 15 k, actually.
JAN GEHL: We have a number of streets, which we call pedestrian priority streets, where pedestrians have the right of way. But you can have bicycles. You can have cars.
GIL PENALOSA: One of the reasons why it's such a wonderful, walkable place, Copenhagen, is because they have lowered the speed in all of the neighborhoods. I think that in North America, we need to create fantastic pedestrian facilities and cycling facilities along the interiors. But in the neighborhoods, we have to lower the speed below 20 miles an hour. And not only just by putting up signs, but putting up physical barriers.
NIELS TORSLOV: One of the best ways of keeping speed down is actually to use our humps. Because by the humps, you are very, very sure that the speed stays down. Because if you don't have this, you will have guys-- usually guys-- going much too fast in a low-speed area because they can.
[MUSIC PLAYING]
[TEXT ON SCREEN]: A recent street transformation.
JAN GEHL: We are standing in front of the old meat market in Copenhagen. And some years ago, there was a lot of heavy traffic coming in, in the morning, especially. So when they closed down the meat market we were thinking, well, got to better change this street. And this is a very central part of Copenhagen. So there's a lot of people living here, and a lot of enthusiasm about also using space for everything else than traffic.
GIL PENALOSA: This is a wonderful street. And can you imagine the difference of quality of life for all of these thousands of condos? And in the middle, they'd built this fantastic park.
NIELS TORSLOV: What's left is actually only a very narrow-- we called it shared-space solutions, where cars, at a very slow speed, and also bicycles and pedestrians can move around each other without really any kind of regulation, as long as the speed is low.
GIL PENALOSA: There are some places where they've got nice benches and restaurants on the side. You go to the next block, and there is a small basketball court. And you go to the next corner, a skateboard park. And then in some of the sides, you have fruits and vegetables that are being sold on the street. And then in another block, you have flowers.
MIKAEL COLVILLE-ANDERSEN: In the Meatpacking District here, we have a lot of new bars opening up. And all the bikes that we're standing around here, it sort of looks like this outside every bar. It's an amazing social network. You ride past cafes and you see bikes parked next to the cafe. It makes the whole city accessible and very, very human.
NIELS TORSLOV: You know, these environments are very attractive for urban living. And it really attracts people to be on the street. And it also raises the price for all those apartments up here. Because this is attraction. I mean, this is urban, trendy lifestyle that we are offering here, by redesigning our street for human beings.
[MUSIC PLAYING]
[TEXT ON SCREEN]: The economics of pedestrian areas.
JAN GEHL: We have 7,500 outdoor cafe seats, which are out for 10 months a year. As all over Europe, in a capitalistic society, if things are not good for business, they will be changed. And what we see in Denmark and all the other European countries, and we even now also see it in New York, in the Broadway area, that when these people-friendly schemes go in, the businesses actually thrive.
GIL PENALOSA: From 6:30, seven o'clock in the morning till midnight, you see people constantly, people coming by. And it's also great for the business. When they were going to create these pedestrian places, initially the retail were very much opposed to it. But afterwards, they found that the best commercial places in the city are their pedestrian streets.
MIKAEL COLVILLE-ANDERSEN: It's anthropology. It's part of the social fabric of the city, that there are pedestrians and cyclists all around you at all time. It's human. This adds an amazing level of social community to a city. And I really think that this is one of the main reasons that Copenhagen is, time after time, selected as one of the world's most livable cities.
IDA AUKEN: I can't even imagine what would happen if somebody said hey, let's turn this square into a parking lot. That would be drama in Copenhagen. So as soon as you win it back, the public space, win it back for human beings and pedestrians, then it's ours and you can't take it away again.
By now, Copenhagen’s traffic calming program has been so successful for so long that people often take it for granted that Copenhagen just is this way. Walking and, in particular, cycling have become very deeply embedded in Copenhagen’s culture. This can be seen in the popular blog Cycle Chic, which looks at the fashions of Copenhagen cyclists. The idea of bicycle chic has spread to other parts of the world, including the United States. All this helps establish walking and cycling as a social norm in Copenhagen, such that people there would find it unusual to drive places.
Curitiba Blossoms With Buses
You may have never heard of it before, but Curitiba, Brazil has the best bus system in the world. The city today has about 2 million people, about the same size as Phoenix, Arizona. Indeed, Curitiba and Phoenix have had about the same population for the last 200 years. But while Phoenix was designed predominantly for the automobile, Curitiba was designed for the bus. Curitiba chose the bus because it could not easily afford to build a subway system. By designing the city around the bus, it found it could get subway-quality performance for a fraction of the cost.
At the heart of Curitiba’s bus system is a series of bus rapid transit routes on dedicated streets going into the city center. These bus lines have stations where passengers pay before getting on the bus, expediting the process considerably. During peak hours, buses run about one minute apart from each other, so riders don’t have to wait a long time. Curitiba zoned the bus lines for high-density development to increase the number of people who could easily ride these buses, thereby making them more effective. Check out the 8:03 minute video below for further details about Curitiba's public transit system.
Curitiba’s BRT. The system that inspired Bus Rapid Transit Around the World.
ENRIQUE PENALOSA (Former Mayer of Bogota): We learned a lot from Curitiba. We copied the bus system from Curitiba.
ISMAEL BAGATIN FRANCA (Engineer, URBS): Our goal is to prioritize the flow of people. The city is not made up of machines, it is made of people, so we have to give people the priority.
JAIME LERNER (Former Mayor of Curitiba): When we started, the whole idea that every city which is close to one million people should have a subway. And at that time, Curitiba had 700,000 people. The subway should have speed, reliability, comfort, and good frequency. We started to imagine, could we have on surface all these conditions?
PRESENTER: Today in the city of Curitiba we have 1.750 million inhabitants. And including the greater metropolitan area of Curitiba we have 3.250 million people.
CLEVER UBIRATAN TEIXEIRA DE ALMEIDA: We have different kinds of services within our transport system, including the BRT, which is, our line with the greatest capacity.
JAIME LERNER: We started with one line, with 25,000 passengers a day. But this system is being improved and now is transporting two million, 300,000 passengers a day, which is the same number of the subway of San Paulo.
KENNTH KRUCKEMEYER: 75% of the people in Curitiba get to work on a bus every morning. A city like Phoenix has exactly the same population as Curitiba over the past 250 years. And yet, in Phoenix, 1% of the people go to work on a bus.
CLEVER UBIRATAN TEIXEIRA DE ALMEIDA: We have a system on a dedicated lane with a higher average speed with the same-level boarding which moves passengers in and out the vehicles faster. Advanced fare collection also contributes for a faster boarding.
ISMAEL BAGATIN FRANCA: Today we have 5 axis, corridors, where we have exclusive lanes.
JAIME LERNER: A normal bus in a normal street transports X passenger per day. If you have a double-articulated bus, a double accordion in a dedicated lane, paying before entering the bus and boarding at the same level, you can have four times more passengers per day in the same space. OK, one bus, 300 passengers, every 30 seconds is 36,000 passengers, per hour, one direction, which is the number of a subway.
CLEVER UBIRATAN TEIXEIRA DE ALMEIDA: The integrated system has various types of lines, such as the “alimentadoras” that operate in residential neighborhoods far from downtown, bringing people to the bus terminals, where they can exchange buses without paying another fare and use the express lines. With the direct lines that also use the tube stations, and have less stops. We have the “interbairros”, which cover a perimeter. We have 6 “interbairros” that connect all transportation axis.
PRESENTER: I’m waiting for the South Circular bus. It’s good because it covers the whole region.
PRESENTER: We do the route six times which takes exactly six hours. I don’t have any complaints. This is one of the best we have. It’s possible to cross the city from here. The traffic is not as bad as people say.
LUIS PATRICIO: Unfortunately, during the last decade, the average speed of the buses has been declining. This is not exactly the problem of the public transportation system, but because of the increasing number of cars in the city.
Dr. FABIO DUARTE: Every time, when people say, for instance, well, the subway system would be better for the city, because then we could put the bus out of the city, the traffic would be better, because all the mass transportation would be under the ground. It's a better way of seeing the problem, because the problem is not the people who use the buses, but the people who use cars. So I think to incentivize the BRT system and put more buses on the streets, it's good for us.
CLEVER UBIRATAN TEIXEIRA DE ALMEIDA: Since its creation, we have been improving these corridors. We have a project to allow bypassing in the dedicated bus lane, that intends to extend the capacity of the bi-articulated buses in the dedicated lanes.
ISMAEL BAGATIN FRANCA: The Boquerião axis will have smart traffic lights, that will identify the bus and let it pass.
PRESENTER: The system could be way more efficient if it had integration and had been planned for the bicycles.
CLEVER UBIRATAN TEIXEIRA DE ALMEIDA: Cyclists use of dedicated bus lanes is dangerous. It may seem comfortable for the cyclist at first, because it’s a wide lane and there’s not a lot of vehicles using this lane, but it’s dangerous for the cyclists and for the users of public transportation as this lane is used by large vehicles, the bi-articulated, which carry up to 270 people.
CAROLINE SAMPONARO: So the major lesson that New York City should take from Curitiba with regard to bicycle planning is that when bus rapid transit is brought into a city, bicycles need to be factored into the designs. So all of the old bus rapid transit lines in the city don't incorporate bicycles at all. But the city in Curitiba is now realizing that bicycles want to ride on the streets that have been redesigned and made so much calmer.
Dr. FABIO DUARTE: The new line, the green line, we have the two bus lanes, the bypass lanes, and we have the bike lane.
PRESENTER: I live right here in Curitiba. I’m working in the Green Line.
PRESENTER: The green line was a federal highway. It was transferred to the city, and we were able to make it a transportation axis.
CLEVER UBIRATAN TEIXEIRA DE ALMEIDA: We are building a linear park. The bike path will follow the sidewalk. All 18km of the Green Line will have a bike path.
ISMAEL BAGATIN FRANCA: You need to take care of land use and transportation together, to induce city growth.
Dr. FABIO DUARTE: We can go from the bus stop to the stores, or the house, et cetera, almost each 100 meters, we have a kind of crossing street. This gives to the city a permeability, so people can walk around and used the stores, et cetera.
CLEVER UBIRATAN TEIXEIRA DE ALMEIDA: It’s not just a transportation corridor. There is a whole urban planning setting that is also important. Sometimes people think that simply building a dedicated bus lane will solve the transportation problem.
JAIME LERNER: There is no end for creativity. If you want creativity, cut one zero from your budget. If you want sustainability, cut two zeroes. If you want to make it happen, do it fast.
Bogota Gets Its Exercise
In the American imagination, the South American nation of Colombia is commonly associated with the drug trade. But Colombian drug cartels are fading. Meanwhile, Colombia has been very active in sustainable development. In one example of this, its capital city, Bogota, has emerged as the world leader in weekly car-free events known as Ciclovias.
The Bogota Ciclovia happens every Sunday and holiday. Cars are forbidden or significantly restricted on 120 km (75 miles) of streets. In general, the presence of automobiles on our streets is a threat not only to the environment but also to children and anyone else wishing to use the streets. The streets can then be used safely and comfortably for cycling, walking, and skating. The streets also feature dances, aerobics, and other outdoors activities. The Ciclovia is a way for people from all walks of life to get some exercise and fresh air. Today, similar events can be found across the world, but none are as large as Bogota’s. Watch the following 9:41 minute video about the Bogota Civlovia.
PARTICIPANT: [SPEAKING SPANISH]
PARTICIPANT: [SPEAKING SPANISH]
CICLOVIA WORKER: [SPEAKING SPANISH]
KARLA QUINTERO: So it's 2 o'clock today and the Ciclovia is almost over. We've had a really long day. We got up at 5:00 in the morning and we got to see how it all started, everything from packing up the vendor stations in the trucks to barricading the streets and closing it to cars. It was pretty light traffic at the beginning because the weather wasn't so great, but at about 8 o'clock it started getting packed. It's a really beautiful way to see the city. There's just tons of people, all different kinds, all different ages. There's even a segment called the Recreovia, and this is absolutely great because they have about 20 stages with aerobics instructors and rhumba instructors, and they're giving free classes to any citizen that wants to participate. It's really something beautiful to see.
CICLOVIA WORKER: [SPEAKING SPANISH]
GUILLERMO PENALOSA: When we were starting the Ciclovia, when I was commissioner of parks, sports, and recreation, we were going to increase from 13k, which is about 8 miles, to over 90k. And we needed a lot of people to work on it. So we put an ad in the paper saying we need supervisors of the Ciclovia and these are the requirements. We got 20 resumes and we were expecting over 200.
So at the time the number one program on Colombian's TV was Baywatch, so we put an ad in the paper saying we need Bikewatch. Tall, handsome, athletic, blah, blah, blah, and we got 1500 resumes, which shows that social marketing works. And so now these people are called Bikewatch, and they're like the managers of the Ciclovia.
CICLOVIA WORKER: [SPEAKING SPANISH]
CICLOVIA WORKER: It's the biggest program around the world. And doing sport 120 kilometers in a city is so different, it's strange. And always we are as university students. And it's a good job because we have enough time for that kind of labor.
CICLOVIA WORKER: This is beautiful, man, because we work for the city. Everybody smiles at you. This is very beautiful work.
KARLA QUINTERO: [SPEAKING SPANISH]
CICLOVIA WORKER: [SPEAKING SPANISH]
[MUSIC PLAYING]
CICLOVIA WORKER: [SPEAKING SPANISH]
KARLA QUINTERO: [SPEAKING SPANISH]
PARTICIPANT: [SPEAKING SPANISH]
CICLOVIA WORKER: [SPEAKING SPANISH]
CICLOVIA WORKER: [SPEAKING SPANISH]
CICLOVIA WORKER: [SPEAKING SPANISH]
GUILLERMO PENALOSA: The obesity rate in the US have skyrocketed. Almost every state has obesity. Not overweight. Obesity. And how else can you get thousands and thousands of people doing physical activity? So then the infrastructure is there. It's free. The roads are already there. All you've got to do is close it. You need operational costs to set it up, and then you can get this fantastic idea, which is like a party that everybody attends. The rich and the poor, and the young and the old, and everybody.
PARTICIPANT: [SPEAKING SPANISH]
CICLOVIA WORKER: [SPEAKING SPANISH]
CICLOVIA WORKER: [SPEAKING SPANISH]
CICLOVIA WORKER: [SPEAKING SPANISH]
PARTICIPANT: [SPEAKING SPANISH]
[DANCE MUSIC PLAYING]
KARLA QUINTERO: [SPEAKING SPANISH]
PARTICIPANT: [SPEAKING SPANISH]
CICLOVIA WORKER: [SPEAKING SPANISH]
CICLOVIA WORKER: In the Recreovia we have different activities from 8 o'clock to 1:00 o'clock. The first station that we have is a basic aerobics class. The second class is stretching. The next class is class for children. In the classes for children we practice with the parents and the children, activities with music.
KARLA QUINTERO: How excited do people get?
CICLOVIA WORKER: A lot. They are very happy. That prefer come here instead of being in the house.
CICLOVIA WORKER: [SPEAKING SPANISH]
KARLA QUINTERO: [SPEAKING SPANISH]
CICLOVIA WORKER: I give classes.
KARLA QUINTERO: You give?
CICLOVIA WORKER: I'm the teacher.
KARLA QUINTERO: Of which one?
CICLOVIA WORKER: All the classes. This is the uniform. [LAUGHS]
[MUSIC PLAYING]
CICLOVIA WORKER: [SPEAKING SPANISH]
GUILLERMO PENALOSA: A lot of cities are thinking of doing activities like Ciclovia. Guadalajara started only two years ago with eight miles, and now they are at 16 miles. Santiago, Chile started. In Paris, France they close down roads. In Ottawa in Canada there is, like, 35 miles of Ciclovia on Sundays from May to September. So I think that there are some cities in the US that are thinking about it, such as Baltimore, Cleveland, Chicago, Portland, New York. And this is something that any city could do, cities of 50,000 people or cities of 10 million people.
Urban Farming
Urban farming can take a variety of forms but, conceptually speaking, it refers to crop and livestock production within cities and surroundings. Urban farming (also known as urban agriculture) takes advantage of every inch of private or public space and can involve anything from rooftop farming to balcony gardening, from farming in parking lots to farming along roadsides. Urban farming plays a large part in contributing to sustainable urban development. As more and more people are living in cities, urban agriculture is emerging as an attractive means of supplying urbanites with food. At the same time, urban farming is an important strategy for reduction of hunger and poverty, improvement in resident health, and climate change mitigation and adaptation.
Detroit (and the state of Michigan generally) makes a good case study for urban agriculture. Watch minutes 16:29-22:05 of the PBS video below to see how urban farming helps communities in food deserts (places with no grocery stores offering fresh produce) access more affordable and healthier food and allows people to make a living by selling their food in local markets.
Narrator: Modern food production promised to feed the world on the cheap. But are the costs proving to be more than we can bear? Fruits and vegetables are trucked around the country and around the world, and most people have no idea who grew them or how they got here. Isn't there a better way? From the rooftops of New York City to the vacant lots of Detroit, there's a growing movement to change the way we eat. Join us as Food Forward explores the explosion of urban agriculture across America. And meet the food rebels who are growing food right where we live.
[rock guitar music]
Dr. Dickson Despommier, Author, “The Vertical Farm”, Columbia University, NY: Here we are in New York City. Five boroughs, 8 million people, most densely populated area in the world. There are 28,000 restaurants in New York City. If New York City were to decide tomorrow to stop importing food, we'd have a big problem right now. Most of us live in cities now and over 50% and maybe 80% in 20 years from now. We love each other. We like to be with each other. We like to sit down to a good meal together. And we all want to know what's in our food, so why not grow it where we live?
John Mooney, Chef, Bell Book & Candle, New York City, NY: My name is John Mooney. I've basically been in the restaurant business my whole life. I've never made money doing anything other than being part of a restaurant crew from start to finish. Since about 12,13 years old. I have done some conventional farming projects to supply restaurants that I've done in the past. It's very difficult to manage, very difficult to maintain. So, I looked into alternative forms of farming. In an urban setting, I felt with the dead space of the rooftop, the technology was smart. It just makes sense. We're in the West Village of Manhattan. We're standing here in the middle of my hydroponic rooftop farm. In the beginning, there was a lot of curiosity as to what was going on up here, because it looks kind of space aged from a distance. And I'd explained it by phone or in person. And now I'm at the point where I tell everyone, you have to see it. The seed sits inside this net where the roots grow inside the tower. This big cylinder has a pump that trickles water down the sides and that feeds the roots and that recycles the nutrients through the bottom is a big base filled with around four gallons of the nutrients, which is fed naturally by gravity.
What I do is I pull the cup out of the tower. So, you see how nice and lightly colored the roots are. And look how long they get, right? I mean, that's strong. Let's look at this arugula right here, okay. We just pulled that a few hours ago. I broke it down. Roots attached. You see what I'm doing. And I believe it totally makes a difference. The flavor is absolutely amazing. When you enter the garden from the stairwell and you open that door. It's kind of like a sanctuary of sorts.
Andrew Coté, Urband Beekeeper, New York City, NY: It's down here. But I have… am I going to get lucky? It's going to be a hydrant. One of the biggest problems with urban beekeeping is parking a truck. It really is. Some honey for you ladies? Okay. You're doing the right thing. You're welcome. Some honey for you, soldier? Miel batido. Whipped honey. No, you're sweet enough? Honey for you, miss. That's the plain whipped. We also have whipped with cinnamon.
Shopper: The local honey is really good for allergies.
Andrew Coté: Local honey is very good for allergies. Where do you live?
Shopper: In East Village.
Andrew Coté: In the East Village. This honey is from 14th and Second.
Shopper: Okay.
Andrew Coté: So, it's very close to where you live. I think this is from Brooklyn. The Manhattan honey has higher rent and the Brooklyn honey has more attitude.
Inside the hive, there's the queen bee, the worker bees who are females, and the drones who are males. Once the queen has been mated, she makes babies. She lays up to 2000 eggs a day. One beehive will produce something around 80 to 120 pounds of honey per year. And I know they help pollinate the community gardens, the window sills, the rooftop farms that saturate the city. This is my office, the rooftops of what is to me the greatest city in the world.
Karen Washington, Urban Farmer, Garden of Happiness: It's showtime! Hello. Good morning. How are you? Ola. como estas? It's all in a presentation. We're in the Tremont section of the Bronx. It's an area that has, as you can look around, a lot of fast food restaurants, not a lot of access to fresh food. And so, as urban growers and community gardeners, since we grow it, we know it. We decided to bring fresh produce to this neighborhood. My garden is Garden of Happiness. It started 23 years ago. It was a vacant lot. Most of the boroughs in New York City in the late seventy’s and eighty’s had so many vacant lots. So, with two things to do, either to let the dirt and garbage accumulate, or take that vacant lot back and start growing food. The biggest joy I have is when a customer comes and they'll say, where are those collard greens? And I say, I got them for you. No matter what, I will grow collard greens. Hopefully we can instill that into young people to really know where their food comes from. Not that everyone could be a farmer, even though I would love that. I would love that. But at least everyone can be an educated consumer.
Ben Flanner, Head Farmer, Brooklyn Grange: It made sense to try to do something in the city for a number of different reasons. Growing food as close as possible to the consumers that eat it. Utilizing all this open space that we have, all these roofs that just kind of have the sun beating down on them all day. The soil is about 25% lighter than a typical topsoil would be if you just stuck a shovel in the ground. So, that makes it more suitable to roofs,
obviously, just because it is lighter. The stones kind of rise to the top and they're all porous. They all have holes in them. And if you feel it, you can just tell it's light.
I'm going to pick that kakutza too. Look at that. It's awesome, isn't it? People like the fact that it's locally grown, and they almost expect it sometimes. For a market like this, it should be the case. This market's been great for the neighborhood. People are pretty excited about it and thanking us for being here.
Gwen Schentz, Farm Manager, Roberta’s: This is Roberta's. It's a restaurant located in Bushwick, Brooklyn. It's almost three years old now, and we make pizza. Right now, we're making a pizza with tomatoes from Brooklyn Grange. They're really nice heirloom tomatoes pizza kitchen will slice up, and sometimes they'll actually make a sauce out of them. It's really nice for me because I work both at the Grange and here at Roberta's. So, I'll be coming back from the farm, and I'll load up my truck with tomatoes and bring them here. And these guys will make pizza and everything kind of comes together. I always thought that to be a farmer, I'd probably have to leave New York and move outside the city. But it turns out that I can get the best of both worlds right here.
Dr. Dickson Despommier: Where does our food come from? If we could produce it inside the study, you could save on transportation and spoilage and packaging and unpackaging, and you could market it right at the bottom of the building. So, you could have a farm with lots of layers in it, maybe 10 or 15 stories tall, fully integrated with hydroponics and aeroponics. You could even have aquaponics in the basements raising tilapia or striped bass or mollusks. And we know how to do all that already. Frustrating part of it is, why don't we do it?
Will Allen, CEO & Farmer, Growing Power: I bought the last remaining registered farm in the city of Milwaukee in 1993, and I made a pledge to the city that I would hire young people from the community to work at the farm. It struck a chord with a lot of folks in Milwaukee, and I started getting calls and requests for me to work with the different nonprofits and schools. We started adding, like, the aquaponics, the worm system, started putting up hoop houses, the animals, all these different pieces. We have a very innovative renewable energy system that heats the water so we can grow tilapia. And also, that heated water helps keep our greenhouses warm during the winter. Food is the most powerful thing in our lives. It's the most powerful thing in community development. People are just realizing that if they want to be healthy, they're going to have to take control of their food in their communities. We need to really scale this thing up.
Hendry Hebert, Facility Manager, Sweet Water Organics:Aquaponics is the conjoined systems from fish production and plant production, bringing them together in a symbiotic relationship. These three systems here, E, F and G are designed for lettuce right now. We started with an upscale model of Will Allen's. Changed a few things on it, tried to make it a little more efficient and a little faster. We have a place for the fish to live, a place for the plants to live, a place for the bacteria to live, and a pump to push the water all through it. The pump provides all the propulsion, just like in the river or the stream. And we've just captured that into a little bitty box. And there's a variety of sizes in here.
Theresa Kopak, Chief Executive Director, Sweet Water Organics: What I love the most about my job is knowing every day when I go in there, I'm working on something that will directly impact the well-being of others. No matter how tired any of us are, we get up in the morning and we want to make this happen and be available to people worldwide. That this is something that can be replicated in any city, in any abandoned factory building warehouse.
Theresa Kopak: Hello. Hi, Peter. I have fish for you.
Peter Sandroni, Owner & chef, La Merenda: Excellent. Cool. That's great. I love the fact you guys are just down the street. I think that a lot of people have a misconception of what tilapia is like. We take Swiss chard, fingerling potatoes and shallots, all grown locally, sauté it all together. And we sauté the tilapia that we have seasoned and dusted in flour. We brown some butter in another sauté pan, and we just bring it all together at the end, put the fish on top of the vegetables, and then top the fish with the brown butter and minus the salt, pepper and flour. Everything is local. We call it the All-Wisconsin Dish, and it's a really, really simple dish, and everyone seems to like it a lot. We figure with 34 systems in this building, at that 7500 fish every five to seven day mark, it will employ like, 40 people. Here we'll provide food for the three to five mile radius around us. It can be done anywhere.
Will Allen:I believe we're creating a new industry that could create thousands of jobs. The thing that we do best is inspire people to want to go out and get something started, to do something. To really inspire them.
Abeni Ramsey, Farm Manager, Dig Deep Farms: My name is Aveni Ramsey, and I'm an urban farmer. Through my experience as a mother living in West Oakland, there was a time when I was having a hard time feeding my kids and we were eating Top Ramen. And because of my upbringing, I knew that that wasn't right. But that's what I could afford because I could buy it in a pack like this for like, $5, and they sold it at the corner store. So, I was riding my bicycle through West Oakland and I saw a sign posted by City Slicker Farms for fresh produce. And there was the farm stand. It was beautiful produce. And so, I started going there, and then I found out that they will build planter boxes in your backyard. So, I applied, and I had them come, and they built the planter boxes. I grew everything we needed in the backyard. I didn't have to buy any produce. Then I got a flock of chickens and we then had our protein source, eggs. My transition has been unbelievable. I am the farm manager of Dig Deep Farms and the owner of City Girl Farms. We are right now harvesting for our CSA, or Community Supported Agriculture Produce Box, which is delivered to our subscribers on a weekly basis.
You guys need clippers. The whole idea of urban agriculture. What gets me is that people act like it's some new and revolutionary idea, but people have been farming in the city since the time there were cities. We've partnered with Flora Restaurant and this great chef, Rico Rivera, who will be purchasing produce from us directly.
Rico Rivera, Chef, Flora Restaurant: Yeah, this guy's incredible. Today from Albany, we received some nettles. Wild nettles. I'm thinking off the top of my head, the nettles. We're going to throw them in one of our chickpea ragus. In the pan, we saute some onions, throw in the chickpeas, some roasted delicata squash, some roasted onions. Then we saute up with a little bit of brown sugar. The nettles complement that real nicely with their earthiness. Toss toss on the plate. Real juicy with a grilled flatbread on the top. It's amazing. You can't get closer to source than what we're doing here. I mean, again, they're probably 6 miles away. We order, she picks it's here in the morning.
Abeni Ramsey: Hi, it’s Dig Deep!
Dig Deep Customer: With my fresh vegetable! I appreciate this so much!
Abeni Ramsey: Of course. All right.
It's a modern idea that you get your food from a store and that's the only way that you get your food. Because you're completely dependent on the grocery store to provide for you what you need. You can live in a community where they don't put grocery stores, where there are no jobs, and where there is limited transportation. And it's like living in the Third World.
[music]
Song Lyrics: In the city. Your dreams flying tigers and wings violence seem to be the only thing depicted on the screen, but it's more to the Motor City. Coming strolling with me got a sidestep to ignorance and stepping the black businesses.
Malik Yakini, D-Town Farms, Detroit, MI: Really, for the last 50 years, Detroit has experienced a decline in population. And so, with the decline in population came a decline in the city's tax base. So, that's impacted the ability of the city to maintain the same infrastructure that it maintained prior to 1950. In 1950, the population of the city was about 2 million, and now it's somewhere about 750,000 or so. There's many neighborhoods in the city of Detroit now where there's no place within walking distance to get fresh produce. And unfortunately, many Detroit residents are eating out of gas stations or out of convenience stores. That, of course, is causing a health cris.
Cornelius Williams, 4-H Farm Advisor, Detroit, MI: And people wonder why they're sick. Number so-and-so yellow, number so-and-so blue is not food. Check the children's cereal and read the label on what's in there, folks! It's killing you! But it does it slowly.
Travis Roberts, Chicken Farmer, Corktown, Detroit: There were a lot of homes in this neighborhood when I was younger, when I was coming up. But as I got older, I watched them decrease by the month. Homes were burned down, tore down. People moved away, and the homes became vacant. People stripped them and then people set them on fire.
Edith Floyd, Growing Joy, Detroit, MI: They stopped burning down all the garages, and people stopped moving out. I had a two-car garage with an apartment upstairs to burn that down too. It felt real bad at first, and then I said, okay, I might as well make it better by adopting a lot and putting a garden on it.
Malik Yakini:Many people have begun looking at urban agriculture as a way to supplement their food sources and to kind of fill the voids that's been created by the departure of supermarkets that were once in Detroit.
Greg Willerer, Brother Nature Produce, Corktown, Detroit: I guess my stomach led me to all this. A lot of us here in Detroit have a hard time finding good local food, healthy food, and somewhat inexpensive food. There's a really strong demand for local and chemical free produce.
Travis Roberts:The idea of having chickens in the city came to me. I was talking to the head chef at Slow's Barbecue, and he was telling me that he would buy eggs from me every week. Then I asked, how many dozen does the restaurant go through? He's like, two cases a week. That's 60 dozen per week that we would buy from you. And so, I figured we would need about 124 chickens, give or take one or two, because some of them don't lay every day. Some chickens won't take to egg laying immediately.
Cornelius Williams: I want you to get a good shot of this okra right here. And you take and harvest it, and you can't beat real okra, and it is delicious. The city is the only place that farmland is increasing. Every time they tear down a house or tear down this, that's potential farmland.
Edith Floyd: I grow all types of greens, tomatoes, okra, corn, beans, eggplants, watermelon, cantaloupe, cucumbers, squash, onion, leech, and lot more stuff.
Malik Yakini: We have soaring rates of obesity, both for children and adults. We have soaring rates of hypertension, of high blood pressure, heart disease. But all of those things are to some extent controllable by diet.
Travis Roberts: I was always a heavyset guy until maybe about a year ago when I slimmed up and lost about 125 pounds.
Cornelius Williams: You get exercise, you get good, fresh food. I think living on the farm and eating a better grade of food makes a difference in life. I come out in the garden and work the garden, and as I'm working, I eat some of everything that I, you know, that's in the garden, this is what your body needs fresh. You don't need a salad that's been cut up and been in a bag and went halfway across the country.
Travis Roberts: Everybody's been pretty excited about it. People wanting to come by and see the chickens and people wanting to donate, and people asking, is there any list that I can get on to where I'll be first in line? Is there any line for deliveries? And stuff like that. So, local restaurants have supported even local catering companies have supported us, so we're getting nothing but love.
Edith Floyd: I put it for 14 lot, and they didn't let me have 14 lots. And that's only a quarter of the block.
Andrew Coté: I want the whole block. In spite of the fact that Detroit just has all the ODS stacked against it, Detroiters have this rare opportunity to actually rebuild their city, and we're doing it.
Edith Floyd: I'm willing to do my part. I would take one block at a time, and if nobody want it, I would take the next block. If it's vacant, I'll take it.
[music]
Song Lyrics: From abandoned lots to garden flies the city on the rise from working in the plant back to controlling our lives nine to five only pay the rent dictating how the day is spent and dinner at the drive through just ain't making sense. Got me convinced the only way to make amends is to plant seeds. Where the weeds grow behind the fence. It's a movement in the streets, now. Ask Malik from Detown. We farming out at Rules Park. The whole city can eat now.
Travis Roberts: My vision for Detroit is seeing people working together. Whether we like it or not, living in Detroit, we are a family and we have to support each other.
[music]
Dr. Dickson Despommier: Everywhere you go in the world now, people are trying to figure out how can they bring their food supply closer to where they live?
Will Allen: I'm not saying that industrial agriculture is going to go away, because it's not.
Malik Yakini: We're not suggesting that gardens can replace supermarkets, but we think that this can be an alternative.
Abeni Ramsey: Look at what the needs are right in your community. Look at what the needs are in your household. I think it's a revolutionary act to plant a tomato plant in your backyard.
John Mooney: Rooftop gardening, to me, is off the hook. It's evolutionary. This is the future. You're looking at it.
Travis Roberts: I'm hoping that people say, look at Trav. He grew up from the same neighborhood that I did. He went through the same stuff that I did, trouble and whatnot. Maybe I can do that's.
Hendry Hebert: If I could be any vegetable, I would probably like to be a tomato.
Ben Flanner: I would probably be an eggplant. I think they're a cool vegetable. They're like super unique.
Dr. Dickson Despommier: Garlic. Definitely garlic. I'm a garlic person. I'm a flavor molecule that wants to get into everybody's cuisine and spice it up.
John Mooney: Right now, I'd be Arugula because I'm Spicy. I'm all hot and bothered. I'm all mixed up with some other sexy ingredients.
Abeni Ramsey: I'd be a Brussels sprout. Brussels sprouts are surprising. They come up, and they look like they might be broccoli. And then it changes and you’re not sure. And they're not easy to grow. But then you get these little nuggets of deliciousness. So, I suppose that's me. I'm always changing. It took me a long time to grow up, but I think I'm now a nugget of deliciousness.
Urban farming can take place basically anywhere. Check out the 3:24 minute video below to find out how people are growing food in recycled car tires in Haiti. On one side, urban farming is a response to food and livelihood insecurity. On the other side, urban farming grows a greener future because food grown locally requires less transportation (or fewer food miles) and therefore reduces ecological footprint.
SPEAKER 1: From United Nations Television, this is UN in Action.
SPEAKER 2: [INAUDIBLE] is a district of Carrefour Feuilles in Haiti and is undergoing some major changes. It's becoming greener.
For some months now, recycled car tires have become ever-present fixtures on the roofs and gardens of homes, from which all kinds of vegetables and spices are growing.
They are part of a project called Urban Agriculture. The goal is to fight against food insecurity.
[? Arnesia ?] Boss, a single mother, is one of the beneficiaries.
SPEAKER 3: Sometimes I wake up in the morning, I have bread, and I could make a soup for the children. But I had to buy vegetables. Now, I can just take them from the garden. This helps a lot and improves the living conditions of the children and the whole family.
SPEAKER 2: With support from local partners, Oxfam, a nonprofit organization assisting the UN stabilization mission, MINUSTAH, with several projects, began setting up a nursery here a year ago.
Peleg Charles, media and communication officer from Oxfam.
SPEAKER 4: We see success in other countries that used urban agriculture to combat food insecurity. On one hand, we help to improve food security in the households. And on the other hand, we help the population to participate in the protection of the environment.
SPEAKER 2: About 100 people, including [? Arnesia, ?] receive seeds, seedlings, agricultural tools, as well as training to grow plants in car tires. Over the past year, Oxfam has purchased nearly 6,000 car tires and over 60,000 seedlings, part of a cooperative effort with several UN agencies to improve food supplies in the country.
Herbs and 10 different kinds of vegetables, such as tomatoes, beets, carrots, and eggplants, are growing in urban gardens. Many are relying on them as an alternative means for enhancing food security and improving livelihood.
SPEAKER 3: From what is growing in my garden, I could also make a living. At the moment, I'm only consuming, but I also want to sell them. Soon I would like to see my garden grow, providing not just food, but also income for the family.
SPEAKER 2: For [? Arnesia, ?] who lives with five children and without a big income, urban agriculture is a blessing. While she will get the seeds and car tires for free from the project for two years, she is already preparing herself for the next step-- creating a garden in her own backyard and learning how to manage it.
This report was produced by Sandra Miller for the United Nations.
Consider This: Urban Agriculture In Cuba
Earlier in this course, we learned that the Green Revolution was, in part, an effort by capitalist countries in the Cold War to get Third World countries to side with them. The Soviet Union was also active in providing agriculture aid to Third World countries such as Cuba.
The world’s largest urban agriculture program comes from Cuba. When the Soviet Union collapsed in 1991, Cuba lost its source of aid and thus faced food shortages. As a way to cope, Cuba turned to urban agriculture as a way to feed itself. This agriculture is performed almost entirely without artificial fertilizers and pesticides, simply because Cuba lacks access to these inputs. In some ways, this makes Cuba’s national agriculture system more sustainable and less vulnerable to disruptions in the supplies of these inputs. On the other hand, this system involves more labor and lower yields than is often found elsewhere. Still, as with Cuba’s overall development, much can be learned from its agriculture system.
Check out this Youtube video by Kitchen Gardeners International (6:05 minutes).
ROGER DOIRON: Hi, this is Roger Doiron of Kitchen Gardeners International. I recently had a chance to travel to Havana, Cuba to study its urban farms and gardens as part of a research tour organized by the Kellogg Fellows Leadership Alliance. That's me there, trying to look like an international researcher. You might be asking, why go to Havana for such an experience.
Most people associate Cuba with another type of revolution, the Communist Revolution led by Fidel Castro in the late 50's. And when they do think of a Cuban agricultural product they can put in their mouths, they're much more likely to think of a cigar than a carrot. But Cuba offers a unique case study for local foods advocates in that it is not only an island nation in terms of its geography but also its economy and politics as a result of being cut off from the world by two important historical events. The first was the embargo imposed upon Cuba by the United States in the early 60's, and which remains in place to this day, making it difficult for Cubans to obtain many products that we take for granted. The second event was the fall of the Soviet Union in 1991 which absolutely decimated Cuba's economy.
The Soviet Union had been Cuba's largest source of both trade and aid, and when the Berlin Wall fell, Cuba's exports and imports fell with it, plummeting by 80%. The Cuban government euphemistically referred to the years after 1991 as the so-called Special Period, but the hungry period would have been a more accurate term. Essential items, such as food, medicine, and gasoline, were in critically short supply. There was an old joke in Cuba that soon after Castro seized power in 1959 the signs at the Havana Zoo changed from "Please don't feed the animals" to "Please don't eat the animal's food." And when the special period began in '91, the old joke changed again, taking on an even more unappetizing flavor. But for those who lived through the special period, it was anything but a laughing matter.
Cuban's daily caloric intake dropped by nearly one third, leading to an average weight loss of 20 pounds per person. Although history has played its share of cruel jokes on Cuba, there are some who think that a city like Havana might end up having the last laugh. The experience of living through the special period has forced Havanans to become more resilient, self-reliant, and innovative in their food production. Organic farms and community gardens, known as organoponicos, can now be found throughout the city. Nearly all the seasonal fruit and vegetables consumed by Havana's two million residents are being sourced from gardens and farms located within 30 miles of Havana.
Fossil fuel powered farm machinery is being replaced by people power and animal power, which are more appropriate technologies for the small scale of agriculture typically found in and around cities. Synthetic fertilizers are being replaced by organic compost and animal manure. Monocultures and the synthetic pesticides they require are being replaced with better and more diverse agricultural systems and practices. And perhaps most important of all, small-scale organic farmers and gardeners are being seen as critical to Cuba's Homeland Security and are being valued accordingly. For example, growers of healthy organic fruits and vegetables, like this one I met, are paid three times more than doctors in Cuba, offering a fresh foreign perspective on one way of achieving health care reform.
I came away from the trip feeling inspired, but my enthusiasm was also tempered by the knowledge that I'd seen but a part of a larger and more complex story. Despite its advances in urban agriculture, Cuba still remains heavily dependent on imports of rice, wheat, and dairy products, and the antiquated Soviet Era food rationing regime, put in place in the early 60's, continues today. In fact, when you visit Havana and you see its crumbling colonial buildings and vintage cars, you can't help feel a bit like a time traveler. But when it comes to sustainable urban agriculture, however, a trip to Havana may well be a trip to the future.
Like a cab ride down Havana's timeworn cobblestone streets in a '57 Chevy with no shocks, the journey to sustainable food security is going to be a bumpy ride. If we do look to Havana's urban farms and gardens as one vision for the future, the real question becomes, what's the best road to take to get there. The one question we can't afford to debate is whether or not to get started down this road. , With over a billion hungry people in the world and more people on the way, the globe's special period has already begun, and the time to start that journey is now.
From previous pages, we learned that urban design involves collective action if a city is to be developed in some coordinated fashion. Likewise, the urban sustainable development process involves a mix of government regulations, private market forces, and community self-organization.
Transitioning to Sustainability
On this page, we conclude our unit on sustainable development by discussing the process of transitioning from less sustainable to more sustainable development.
In the sustainable development modules, we (the course designers) have attempted to show that sustainable development can also be enjoyable development. To see this, recall the end uses of sustainable development. Foods that have lower environmental impacts are often also healthier and tastier. High-density, mixed-use urban developments often have vibrant culture and aesthetic beauty. Non-motorized transport (walking, biking, etc.) also gets us exercise, making us healthier and happier. We see this time and time again: sustainable development is pleasant development. It would seem to be a win-win situation: people today get to live nice lives, and the environment and future generations benefit in the process. This observation is in stark contrast with the idea that protecting the environment requires arduous sacrifices. Perhaps sustainable development is not that much of a collective action problem after all.
If sustainable development is such a good idea, then why don’t we see more of it? There are many reasons for this, but one idea is at the center: the challenge of transition. Regardless of how nice sustainable development might be when we get there, the process of transitioning there from where we are now is difficult. Because the transition is so difficult, we don’t do it as much as we could or perhaps should. The difficulty of the transition can be expressed in terms of the idea of system resilience from Module 2.
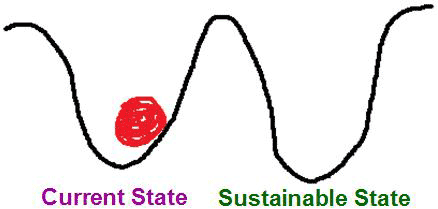
The difficulty of the transition has two main parts. One involves physical infrastructure. Our farms, buildings, and roads are largely set up for an unsustainable type of development. Transitioning to sustainable development would require rebuilding a lot of this. That’s a lot of work! Even if more sustainable infrastructure ends up being eventually more pleasant or less expensive to operate, it is often more expensive over the short-term. Indeed, discussions of sustainable development often highlight the concept of the break-even point, which is the point in time in the future in which an investment in more sustainable physical infrastructure breaks even. Before the break-even point, the investment loses money (or whatever else is being counted). After the break-even point, the investment makes money/etc. For example, we might spend more money constructing a more energy-efficient building, but over the course of the building’s lifetime, we save money on energy costs.
The other part of the difficulty of the transition is cognitive. Simply put, our minds require some transition, too. Part of the cognitive transition involves learning some new things. If we’re going to eat foods with lower environmental impacts, then we need to learn to use some new recipes or restaurants. If we’re going to use different transportation modes, then we need to learn how to use those. But part of the cognitive transition goes beyond learning. This involves habits and social norms. We might know full well how to cook a meal or get around town in a more sustainable manner, but we still find ourselves in the habit of doing the same things we always have been doing. Changing habits can be a very difficult thing to do. Or, we might be able to change our habits, but find ourselves in social circumstances in which the new habits are not considered normal. Maybe your friends are all going out for hamburgers or buffalo wings and would tease you if you ordered a vegetarian option. Maybe your family doesn’t want to move to an area where you and they could walk everywhere. In scenarios like this, it’s entirely possible that the other people in your social group would be more positive and accommodating after they went through a cognitive transition of their own. Either way, it remains the case that social norms can make transitions to sustainability – or to anything else, for that matter – more difficult. The same can be said for the other aspects of cognitive transition: learning and habits.
The challenge of transition makes achieving sustainable development quite a lot more difficult. But the challenge also opens up opportunities. Today, many people are employed in various aspects of sustainable development largely to facilitate the transition. Whether you’re in engineering or advertising, farming or law, or virtually any other profession, there are opportunities to help with the transition to sustainable development. Succeeding with this involves understanding the interconnections between your profession and sustainability.
And with that, our sustainable development unit comes to an end.
Our third and final unit, global environmental change, explains why the transition to sustainability is so important. In short, the fate of the global human-environment system is at stake, including our very survival. So, while sustainable development can be pleasant, and the transition can be difficult, the transition is also quite important. Arguably, nothing at all is more important.
Summary
Summary
Cities and transportation are central to contemporary development because they enable large numbers of people to come together for specific purposes. Food is important because everyone eats it, and agriculture is important because it's how we get most of our food. This module was designed to present urban transportation and farming in a systemic, geographic perspective with emphasis on their sustainability. Urban landscapes are heavily dominated by human activity but are nonetheless influenced by environmental features such as the presence of ports. Urban design in turn influences which modes of transportation we use, as seen in urban areas designed for pedestrian, public transit, and automobile transportation. Cities and transportation impact the environment in several ways, including energy use and air quality. By minimizing food transport and carbon footprint, urban farming makes cities less fossil-fuel dependent and more environmentally-friendly. Finally, there are efforts in cities around the world to transition towards sustainable development.
The transition to sustainability can be difficult. The transition is often more difficult than the end result of being in a more sustainable state. Transitions to sustainability can involve transitions in both physical infrastructure and in our own minds. The challenge of the transition is an important aspect of sustainable development, one which can present opportunities for those interested in pursuing sustainable development in their lives.
Module 8 - Natural Hazards
Introduction
About Module 8
In Unit 1 (Modules 1 to 4), we learned key concepts used throughout the course. In Unit 2 (Modules 5 to 7), we learned about what development is and how it can be sustainable. We now turn to our Unit 3 on global environmental change. Simply put, due mainly to human development, the global environment is currently undergoing major changes – changes that are, in turn, causing major disruption to human systems and environmental systems alike.
Module 8 focuses on natural hazards. Natural hazards are threats of natural events that cause harm to humans or to other things that we care about. Many natural hazards are not initially caused by humans, but the damage inevitably has a strong human component. We start the final sets of modules this way because studying hazards helps us understand environmental impacts on more local scales, giving us valuable perspective on global environmental change.
What will we learn in Module 8?
By the end of Module 8, you should be able to:
- explain the relationship between natural hazards, extreme events, and disasters;
- present and compare several major examples of natural disasters;
- describe factors that make some people and places more vulnerable to specific types of natural hazards;
- explain steps that can be taken to reduce vulnerability to natural hazards and reduce harm from specific extreme events;
- discuss connections between natural hazards and global environmental change.
What is due for Module 8?
There is just one required reading for this module. Next week's Written Assignment will draw on material from Modules 8 and 9.
| Requirement | Location | Submitting Your Work |
|---|---|---|
| Reading Assignment: Knowledge Without Modern Education | Vulnerability to Natural Hazards | No submission |
Questions?
If you have any questions, please post them to our Course Q & A discussion forum in Canvas. I will check that discussion forum often to respond. While you are there, feel free to post your own responses if you, too, are able to help out a classmate. If you have a more specific concern, please send me a message through Inbox in Canvas.
Examples of Natural Disasters
Examples of Natural Disasters
Before we begin, let’s look at some examples of natural disasters. This will help set the tone for the rest of the module and give an understanding of some of the sorts of scenarios we’ll be studying. The four examples presented here are four of the biggest natural disasters of the last decade. A fifth, the 2010 Haiti earthquake, will be discussed in depth later in the module.
2012 Hurricane Sandy, US East Coast (Video- 7:41 seconds)
Hurricane Sandy (also known as Superstorm Sandy) was the most destructive hurricane of the 2012 Atlantic hurricane season. Sandy made landfall in southern New Jersey and became incredible in its size and power. It was a large storm with violent gusts and storm surges that caused major flooding and left millions of people along the East Coast without power. More than 100 people died and tens of thousands of people were injured and relocated. According to NOAA, estimated damage from Sandy is $71 billion, making Sandy the fourth-costliest hurricane in United States history, after Hurricanes Katrina, Harvey, and Maria.
Credit: Video from WSJ
ERIC HOLTHAUS, AMERICAN METEOROLOGIST AND JOURNALIST: This is actually the storm that's going to be merging with Hurricane Sandy to form the Frankenstorm.
PRESENTER 1: Hurricane Sandy hammered the Bahamas early Friday after leaving 21 dead across the Caribbean. Some are calling it a super storm. What is that all about?
ERIC HOLTHAUS: As this storm moves farther north it will expand. It's just really moving into the question of where.
CHRIS CHRISTIE, GOVERNOR OF NEW JERSEY: This morning I formally declared a state of emergency in anticipation of Hurricane Sandy. We should not underestimate the impact of the storm that we should not assume the predictions will be wrong.
MICHAEL BLOOMBERG, MAYOR OF NEW YORK CITY: The MTA has announced that they will start shutting down service subways starting at 7:00 tonight, buses at 9:00 tonight.
ADAM MARCUS, LONG ISLAND RESIDENT: This guy at the beach is saying that this is all for nothing. The guy says in 40 years I've lived here, nothing has happened, and this could be the one time.
BARACK OBAMA, PREVIOSU PRESIDENT OF THE UNITED STATES: This is a serious and big storm.
CHRIS CHRISTIE: If something looks like it's stupid to do, it is stupid. Stay on the barrier islands for 36 hours of hurricane force winds of 75 miles an hour or more sustained, not gusting, is stupid.
PRESENTER 3: Tens of thousands of people were ordered to evacuate coastal areas on Sunday from Maryland through Connecticut as Hurricane Sandy prepared to make landfall Monday or early Tuesday.
PRESENTER 1: Here's a shot of Atlantic City, New Jersey this morning as Hurricane Sandy is on her way. Stock and options markets are closed today. Thousands of flights have been canceled. Earnings reports are being delayed, and like I said Sandy isn't even here yet.
PRESENTER 3: The east coast grinding to a halt as Hurricane Sandy prepares to make landfall. What are the major steps you should be doing to protect your home and the belongings from damage from flooding?
JULIE ROCHMAN, INSURANCE INSTRUCTOR FOR BUS AND HOME SAFETY: Well everybody should have a go kit. And everybody should have a plan as to where they're going to evacuate to, and let relatives or friends know where it is that you're going.
ALISON JIMENEZ, ASPCA SENIOR MEDIA MANAGER: Just like people were doing we wanted them to make their preparations early. Start thinking about putting aside some of their pets' food, some clean water where their pets were drinking, their pets' medication, their pets' medical records.
SIMON CONSTABLE, NEWS REPORTER: Two crew members are missing from the HMS bounty. It was a tall ship, it has sunk. That is a live shot of a crane here in New York City, it has flopped over.
MICHAEL BLOOMBERG: This is a massive storm.
BARACK OBAMA: The most important message that I have for the public right now is please listen to what your state and local officials are saying. When they tell you to evacuate you need to evacuate.
PRESENTER 3: The east coast reeling this morning as it absorbs the aftermath of super storm Sandy. Where economic damages could be in the range of $10 to $20 billion. At least 30 people have been killed in seven states. More than 8 million homes are without power. And in New York City the wounds are particularly severe. In the borough of Queens between 80 to 100 homes caught fire last night and were destroyed. Public transportation meantime continues to be closed after extensive flooding. There is no timeline on when that will change.
- The level of devastation at the Jersey Shore is unthinkable.
LIZ HERON, WALL STREET JOURNAL SOCIAL MEDIA DIRECTOR: People did have access to information was is still going on. A lot of people were getting tweets there's ways you can get tweets without actually having internet or being on Twitter because everyone has a smartphone. They're having a lot of photos.
PRESENTER 3: Everybody's a reporter now.
LIZ HERON: Exactly, and there was incredible images being shared.
SIMON CONSTABLE: What are the problems we're trying to assess damage at this stage?
JOSH MITCHELL, DOW JONES NEWSWIRE REPORTER: Well there's two types of damage we're talking about here. One is property damage. So how much damage is there to people's homes, to office buildings, to roads, to the subway system that gets people to work.
PRESENTER 3: Millions are still without power as the East coast struggles to recover from super storm Sandy. At least 55 lives have been claimed so far in the US. Here in New York, Manhattan is beginning a difficult recovery process with paralyzed transportation services and power outages. You can just see massive paralysis coming to this city.
PRESENTER 5: Yeah, certainly I mean the city is just not set up to have everybody who needs to work here drive in.
PRESENTER 4: You have to have three people in the car. Bottom line is the streets can only handle so much.
SIMON CONSTABLE: President Obama and New Jersey Governor Chris Christie surveyed storm damage across the Garden State.
CHRIS CHRISTIE: When all of you look around you see all this destruction that's fine, but you know what all that stuff can be replaced. You look to your right and to your left, to your husband or wife, your son or your daughter those are things that can't be replaced.
PRESENTER 3: Day three of super storm Sandy recovery and the death toll has risen to at least 72. Nearly half of those in New York City where fire still smolder in Queens, and there are reports of looting in Brooklyn and Long Island. Meantime Tens of thousands of people in the Northeast are battling traffic, gas lines, limited public transit to return to work this morning.
SIMON CONSTABLE: Super storm Sandy likely delivered insurance companies a $20 billion bill.
PRESENTER 4: Recovery is under way, and New York is starting to build again. The inspections of the crane on West 57th Street are complete. We plan to reopen public schools for classes on Monday. The MTA really did a phenomenal job of getting subway service partially restored in just a few days.
PRESENTER 3: The Governor was just speaking. It looks like some relief is going to be on the way for New Yorkers and people in New Jersey.
ANDREW CUOMO, NEW YORK GOVERNOR: Look it's been a long week, and it's been a long week for everyone. It's not over. There are still inconveniences, but it could have been a lot, lot worse. And let's not minimize what we went through. Sometimes we can have a short memory. After the storm we went through on Monday everything shouldn't be back to normal by Friday, it's going to take time.
2011 Earthquake and Tsunami, Japan
On March 11, 2011, a magnitude-9.0 earthquake hit northeastern Japan and caused a savage tsunami that engulfed everything in its pathway. About 20,000 people were killed. The quake lifted the seafloor by 30 feet and the tsunami debris was found on US shorelines two years later. The twin disaster caused a meltdown at the Fukushima Daiichi nuclear plant which developed into the world's worst nuclear crisis. Throughout GEOG 030N, we have emphasized human impacts on the environment. It is important to recognize that humans do not cause earthquakes. We certainly do play a large role in determining what the impacts of an earthquake end up being. But the earthquake itself is caused by plate tectonics.
(Credit: Video from National Geographic)
PRESENTER: All across northern Japan, they felt it. A violent, magnitude 9.0 earthquake on March 11, 2011. It was centered about 80 miles offshore, and tsunami warnings went up immediately. In coastal cities, people knew what to do next-- run to higher ground.
It's from these vantage points on hills and in tall buildings that incredible footage was captured. In Kesennuma, people retreated to a high-rise rooftop and could only watch in horror as tsunami waves inundated their city, knocking buildings into rubble and mixing into a kind of tsunami soup filled with vehicles, building parts, and contents.
Seawater cascaded over seawalls and into cities. This video shows the water rushing over an 18-foot seawall in the Kamaishi city. The seawall here was the world's deepest and largest, but not enough for the magnitude of the March 11 disaster. It was the largest quake ever known in Japan and one of the five largest recorded in the world. More than 28,000 people are confirmed dead or missing.
When two tectonic plates pushed together under the sea, the resulting earthquake sends an enormous burst of energy up through the ocean, displacing enormous quantities of water. With the upward motion, a series of waves expands in all directions. In deep water, these waves travel fast, up to 500 miles an hour, but only reach a height of a few feet. A passing ship might not even notice. But as the waves enter shallow waters, friction with the ocean floor lowers the waves' speed, but raises their height.
This video is from a Japan Coast Park ship confronting a tsunami wave in shallow water on March 11. And a rare view from the air. Video of a tsunami wave approaching the shoreline. In Japan, some tsunami waves reach as far as three miles inland.
Japan may be the most seismological studied country in the world. And with more than 1,200 high-precision GPS stations, a geophysicist at the University of Alaska used the data to create a visualization of the March 11 quake. The waves of displacement that you see were moving as fast as five miles per second. In this photo, the ripples of tsunami waves are seen moving upstream in the Naka river at Hitachinaka city. New technology left an enormous amount of visual evidence for study in years to come and can perhaps help us better understand the power of earthquakes and tsunamis and prevent loss of life in the future.
2008 Cyclone Nargis, Myanmar
Myanmar (also known as Burma) is a coastal country in Southeast Asia. On May 2, 2008, Myanmar was hit by a category 4 cyclone named Nargis. The damage caused by Nargis was extreme, both because the cyclone was so powerful and because Myanmar was not well prepared to handle it. Myanmar was not well prepared because it was quite poor and also because its military government was not well-organized for the relief effort. One tragic complication was that the government had bad relations with other countries. After Nargis hit, the international community offered to assist Myanmar with its recovery, but because of its government, this assistance was not easily received.
PRESENTER: The damage from Cyclone Nargis was quickly apparent. Some 140,000 people were dead or missing. Hundreds of thousands were homeless. And thousands of homes, schools, businesses, and farms were destroyed. But the biggest challenge in helping survivors was not flooding or displacement, it was the military government. For weeks, it refused most international aid. The US aircraft carrier Essex, carrying helicopters and tons of water and food, waited off Burma's coast for more than three weeks. It waited for approval to start ferrying its cargo inland to the Irrawaddy Delta. Approval never came. World Food Programme spokesman Paul Risley.
PAUL RISLEY: And that's truly unfortunate, because these helicopters represented immediate heavy lift capacity in the area of the delta.
PRESENTER: Burma's government also sat on visa applications from the United Nations and humanitarian agencies. It took pressure from the UN and the Association of Southeast Asian Nations to persuade Burma to allow foreign aid workers to enter the country. Tian Padir heads the Institute of Security and International Studies at Chulalongkorn University in Thailand.
TIAN PADIR: The UN has had limited impact, limited effect. Not so much effort. The effort is there. They have a lot of-- they have made strident efforts. But the outcome, the effects have been limited.
PRESENTER: Two months after the disaster, people in the hard hit the Irrawaddy Delta still wait by the road for help. They are storing the meager donations they have received. They know it will take months to recover their lost crops and incomes. Although the evidence proves otherwise, Burma's generals say the need for relief is now over. On a recent visit to China, US Secretary of State Condoleezza Rice praised country for reaching out for help in response to the May earthquake. Rice said an approach to Burma must be found. China and India could provide one. Both have extensive diplomatic and economic ties to the government in Rangoon.
CONDOLEEZZA RICE: It has been said that the Burmese authorities have, instead of making possible the international community's response to their people, that they put up barriers to that response. And we will continue to talk to China and others who have influence.
PRESENTER: Relief groups are still urging the country's generals to open up. Richard Horsey is with the UN.
RICHARD HORSEY: The authorities of the country need to open up to an international relief effort. There aren't enough boats, trucks, helicopters, in the country to run the relief effort at the scale we need.
PRESENTER: However for years, Western governments have asked Beijing and New Delhi to help push Burma's military to allow political reforms, tolerate dissent, and free jailed critics. So far, they have made little headway. For producer [? Praus Lapid?], Jim Bertel, VOA News.
Officially, Cyclone Nargis caused about 138,000 deaths and $10 billion in damages. Unofficially, it is believed that the death toll is even higher and that the Myanmar government intentionally undercounted the dead to minimize the harm to its image and reputation. While we do not know for sure what happened, it is certainly the case that human factors can play a large role in the magnitude of disasters.
2005 Hurricane Katrina, US Gulf Coast
The 2005 Atlantic hurricane season was one for the record books. Katrina wasn’t even the most powerful storm that season. Both Hurricane Rita and Hurricane Wilma were more powerful; Wilma was the most powerful ever in the Atlantic. But Katrina is the one we remember most because it caused, by far, the most damage. Whereas Rita and Wilma passed through less populated areas, Katrina passed directly through one of the most populous and most vulnerable sections of the Gulf Coast, in particular, the city of New Orleans. About 1,800 people died. According to NOAA, damages totaled about $160 billion, making Katrina the most expensive natural disaster in United States history (Hurricane Harvey is second at around $130 billion). As the following video shows, however, the damages were due to human factors as well as natural factors.
(Credit: Video from National Geographic)
PRESENTER: When Hurricane Katrina struck New Orleans, entire neighborhoods vanished under 20 feet of water. The devastation ranks as one of America's worst natural disasters, but also one of the worst man-made disasters. That's because since it's early days, New Orleans has been sinking. The soil in and near New Orleans is a tenuous combination of silt, sand, and clay.
Over time, the soil compacts and sinks. Before the Mississippi River Delta was developed, the river flooded regularly. Fresh silt from the floodwaters replaced the sinking ground and kept the land above sea level. But New Orleans is built to keep the river out. High walls, called levees, have been erected around the city to keep rising river levels at bay.
They have also kept out the silt and sediments. Without the renewing sediments, New Orleans continues, ever so slightly, to sink. Its present rate is three feet every 100 years. Parts of New Orleans today are eight feet below sea level. If another storm surge like Katrina's breaches the levees, New Orleans will again be under water.
The odds of another flood have increased because the ground under New Orleans is not all that's shrinking. So are the surrounding wetlands. Every hour, another two acres of wetlands disappears under the sea. Like the sinking of New Orleans, the reasons are largely man-made. Canals dug through the wetlands increase erosion and destroy habitat, and levees help funnel the silt out into the Gulf before it can be absorbed by the coastal wetlands.
Ironically, it is the wetlands, not the levees, that truly protect New Orleans from the sea. Every three miles of wetland absorbs a foot of a storm surge, acting as Mother Nature's insurance policy against hurricanes. Since 1930, Louisiana has lost over 1,900 square miles of wetlands. By 2050, many barrier islands will disappear altogether. New Orleans is still sinking. Unless something is done, the Big Easy will slip beneath the sea, with or without another hurricane.
Compared to Cyclone Nargis, Hurricane Katrina caused fewer deaths and cost much more in damages. This is largely because the United States is a wealthy country and Myanmar is a poor country. In general, disasters cause more deaths in poor countries and more dollars in damage in rich countries. The role of wealth in natural hazards will be discussed in more detail in the module. Finally, note that hurricanes and cyclones are different names for the same type of event. The word hurricane is used for the Atlantic. Typhoon is used for the Pacific, especially towards the Asian coast. Cyclone is used worldwide.
As the videos of Cyclone Nargis and Hurricane Katrina show, the exposure of populations to natural hazards, the existence of protective infrastructure, and the effectiveness of emergency response and reconstruction are largely human factors that influence the severity of disasters. In addition, uneven distribution of wealth, education, and services within an affected area makes some people more vulnerable than others. Furthermore, some meteorological and hydrological hazards are becoming more severe due to anthropogenic climate change. For these and other reasons, many geographers such as Neil Smith find the phrase “natural disaster” misleading, as if the disaster were only natural and therefore inevitable. In this course, we will use the phrase “natural disaster” simply as a widely accepted convention, with the understanding that human and political factors, in addition to natural conditions, all come into play in determining the severity and distribution of damage following a natural hazard. In the following sections of this module you will learn more about natural hazards and the human factors that influence their impacts.
What is a Natural Hazard?
What is a Natural Hazard?
"Hazard always arises from the interplay of social and biological and physical systems; disasters are generated as much or more by human actions as by physical events." (Geographer Gilbert F. White, the “father of floodplain management”)
A hazard is distinguished from an extreme event and a disaster. A natural hazard is an extreme event that occurs naturally and causes harm to humans – or to other things that we care about, though usually the focus is on humans (which, we might note, is anthropocentric). An extreme event is simply an unusual event; it does not necessarily cause harm. Note that many hazards have both natural and artificial components. Because hazards are threats of harm mainly to human systems, human activities play a large role in how severe a hazard is. For example, when large numbers of people crowd into floodplains and low-lying areas, they are putting themselves in harm’s way, increasing the severity of potential floods. Similarly, as we saw in the urban landscapes page of Module 7, many major cities are built in coastal areas. These cities face the threat of rising sea levels, a hazard being caused by global climate change, as discussed in Module 9. In short, the severity of the impacts from a natural hazard depends on both the physical nature of the extreme event and on the details of human development decisions.
What makes an event a disaster? This is in many ways an ethical question. A natural hazard escalates into a natural disaster when an extreme event caused harm in significant amounts and overwhelms the capability of people to cope and respond. Then what do we mean by "harm"? This is essentially asking what it is that we ultimately care about. The question of how we define "disaster" is similar to the question of how we define "development," as discussed in Module 5. As with "development," there are definitions of "disaster" that emphasize monetary measures and definitions that emphasize health measures. The severity of a disaster is commonly measured in terms of the dollars of damage it causes or in the number of deaths it causes. All else equal, a disaster that causes more dollars of damage will usually also cause more deaths.
However, this is not always the case. Disasters in poorer regions tend to cause more deaths; disasters in richer regions tend to cause more dollars in damages. This is because poorer regions tend to be less capable of protecting their populations and because richer regions tend to have higher-cost development exposed to the extreme event. We saw this on the previous page in comparing Hurricane Katrina (2005) to Cyclone Nargis (2008). Both were tropical cyclones of high intensity (Katrina's winds were 175 miles per hour; Nargis's were 105 mph) that hit heavily populated coastal regions, including major industrial cities (New Orleans, population 1.5 million; Yangon, population 4.4 million). But whereas Katrina caused about 2,000 deaths and $80 billion in damages, Nargis caused about 140,000 deaths and $10 billion in damages. This rich/poor difference between monetary and human life impacts is typical for disasters. The difference makes it important for us to pay attention to how "disaster" is defined.
Self-check
Now that you have read a bit about what natural hazards are, here are a few multiple-choice questions that will test your understanding of the differences between extreme events, hazards, and disasters. These should be very simple questions and the purpose here is to give you some confidence in understanding this material so far.
Think About It!
Come up with an answer to these questions by yourself and then click on “Click for answer…” to reveal the answer.
1. Hurricane Katrina along the U.S. Gulf Coast was a(n):
- Extreme Event
- Hazard
- Disaster
ANSWER - The best answer here is disaster. Katrina was certainly also an extreme event, but along the Gulf Coast, its defining feature is the major damage it caused, making it a big disaster.
2. Polar lows are cyclones that occur near the North and South Poles. These are types of:
- Extreme Event
- Hazard
- Disaster
ANSWER - The best answer here is extreme event. Because these events occur near the poles, they tend to not damage things that we care about. People do not live in the region, and what ecosystems exist there are not substantially disturbed. But polar lows do have unusually high winds, making them extreme events.
Common Types of Natural Hazards
Natural hazards can be classified into several broad categories: geological hazards, hydrological hazards, meteorological hazards, and biological hazards.
Geological hazards are hazards driven by geological (i.e., Earth) processes, in particular, plate tectonics. This includes earthquakes and volcanic eruptions. In general, geological extreme events are beyond human influence, though humans have a large influence on the impacts of the events.
Meteorological hazards are hazards driven by meteorological (i.e., weather) processes, in particular those related to temperature and wind. This includes heat waves, cold waves, cyclones, hurricanes, and freezing rain. Cyclones are commonly called hurricanes in the Atlantic and typhoons in the Pacific Ocean.
Hydrological hazards are hazards driven by hydrological (i.e., water) processes. This includes floods, droughts, mudslides, and tsunamis. Floods and droughts can cause extensive damage to agriculture and are among the main contributors to famine. The deadliest natural disaster in world history (not counting pandemics) was the 1931 Central China floods, killing three or four million people.
Biological hazards are hazards driven by biological processes. This includes various types of disease, including infectious diseases that spread from person to person, threatening to infect large portions of the human population. Many discussions of natural hazards exclude biological hazards, placing them instead within the realm of medicine and public health. If biological hazards are counted, then they include the deadliest disasters in world history, including the Black Death outbreak of bubonic plague in the 1300s, killing 75-100 million people, and the 1918 "Spanish" flu pandemic, a global affair (the name "Spanish" is due to historical coincidence) killing 50-100 million people. A more recent example is the COVID-19 pandemic. An understanding of geographic concepts has been integral for answering questions like where the virus is more prevalent, where it is more deadly, how fast it moves, and how do we prevent its spreading? It is also helps us to see that natural disasters are not always purely natural. Human actions have been important for both the spread and containment of the virus. While biological hazards are undoubtedly important, they are not discussed in detail in this module.
It is possible for an extreme event to fit within more than one of these categories. For example, volcano eruptions (a geological event) block incoming sunlight, potentially enough to cause cold waves (a meteorological event). This happened in dramatic fashion in 1816 when the Mount Tambora eruption caused the 'year without summer' in the Northern hemisphere. Volcano eruptions can also cause tsunamis (a hydrological event); some of the largest tsunamis ever occurred when volcanoes along coasts caused large landslides into the water. Earthquakes (a geological event) that occur under water can also trigger tsunamis (a hydrological event), such as the 2011 Japan Earthquake and Tsunami.
Systems of Hazards
One extreme event can often be hazardous in several ways. For instance, an earthquake may destroy buildings, cause landslides, and rupture sewer and water lines. The ruptured lines may, in turn, contaminate water, causing water-borne diseases such as cholera. Indeed, a cholera outbreak happened after the 2010 Haiti earthquake because of disruptions to clean water supplies.
Likewise, a single natural hazard can have many impacts. For instance, hurricanes involve high winds, torrential rain, flooding, and storm surges. The winds may remove roofs and topple power lines. The floods may inundate roads, homes and schools. Ecosystems can be damaged, threatening wildlife. Some impacts can even be beneficial. A hurricane churns up ocean water, cooling surface water and thus reducing the risk of another hurricane in the same area. Keeping track of these systems of hazards and impacts is an important part of the study of hazards.
Who Studies Natural Hazards?
Contemporary research on natural hazard is interdisciplinary. Natural scientists study the nature of the extreme events involved in hazards. Social scientists study the human dimensions of the impacts and responses. Policy researchers, engineers, and ethicists study what can and should be done to prepare for hazards and to respond to them when they occur. Some specific fields active in natural hazards research include geography, medicine and public health, psychology, economics, engineering, and sociology. Cartography and geographic information science are increasingly important because these fields help analyze important spatial information about hazards. Later in the module, we will see some examples of how cutting-edge information technology is being used to revolutionize disaster response.
Career Options
For better or worse, natural disasters occur frequently and cause much damage, creating the need for dedicated natural hazards professionals. Hazards professionals are employed in government, in private for-profit and non-profit organizations, and in universities and research institutes. People work in characterizing hazards, preparing communities for hazards, providing emergency services after disasters strike, helping communities rebuild, documenting disasters, and raising awareness. People work as project managers, database analysts, operations analysts, environmental experts, and psychiatric consultants. The largest U.S. government employer for disaster management is the Federal Emergency Management Agency (FEMA). Major international organizations involved in natural hazards include the United Nations World Food Programme and the United Nations Educational, Scientific and Cultural Organization (UNESCO). Major non-profit/non-governmental organizations include the Red Cross/Red Crescent organizations, Catholic Relief Services, Oxfam, and Mercy-Corps. Many people in these and other organizations focus exclusively on natural hazards projects. Others combine work on natural hazards with work on other issues, which is appropriate given how tightly connected natural hazards are to so many other issues.
Vulnerability to Natural Hazards
Vulnerability to Natural Hazards
The concept of vulnerability encompasses a variety of definitions. In general, vulnerability means the potential to be harmed. Vulnerability to natural hazards is thus the potential to be harmed by natural hazards. Some people and places are more vulnerable to certain hazards than other people and places. While any one extreme event may be unusual, there are broad trends in natural hazards. These trends are due to characteristics of both natural systems and human systems. By characterizing these trends, we can understand who and what is vulnerable and in what ways they are vulnerable. This, in turn, helps us reduce vulnerability and, when extreme events occur, reduce the damage. This work saves lives, and much more.
Disaster Trends Across Space & Over Time
The risk of specific natural hazards varies widely from region to region. For example, floods tend to occur in low-lying areas near water. The Sahel region (the southern edge of the Sahara desert in Africa) is periodically plagued by droughts. Forest fires tend to occur (as you might guess) in forests. Earthquakes and volcanoes tend to occur near boundaries of tectonic plates. Many of the world’s earthquakes and volcanoes occur along the edge of the Pacific Ocean, along the boundaries of the Pacific Plate. This region is known as the Ring of Fire for its intense volcanic activity.
Within the United States, some regions are more vulnerable to natural hazards than others. For example, Pennsylvania has a relatively low vulnerability, whereas Florida has a relatively high vulnerability. Pennsylvania gets a lot of hot weather in the summer, cold weather in the winter, and rainfall throughout, but while this all can be inconvenient or unpleasant, it is usually not dangerous. Florida, on the other hand, doesn't have to bundle up so much in the winter, but it does face frequent hurricanes.
Generally speaking, disasters are becoming less deadly but more costly. Fewer people are dying in disasters, but damages are costing more in dollars. Improved science and technology is a main reason that fewer lives are lost. We are now better at forecasting disasters, and our buildings and other structures can better withstand the physical impacts. This increases our resilience to hazards. Growth in population and the economy is a main reason that more money is lost. Simply put, society now has more of value that is exposed to hazards. Even though much of this is also more resistant to damage, the total dollar amount of damage has been increasing.
These trends can be seen in graphs available online from EM-DAT, the International Disaster Database. Using the EM-DAT query/ Mapping tool (note: you will need to register in order to access this tool), you can view the number of disasters, the number of people affected, and the dollars of damages from 1900 to 2021. Please adjust the settings to examine several graphs. You can see that deaths are declining while the number of people affected is increasing over time, mainly due to population growth. There is also an increase in the number of disasters reported, which can be caused by population growth, economic growth, or changes in reporting standards. It seems that natural disasters are getting more costly perhaps because people are building more expensive infrastructure in hazard-prone areas.
Human Factors
The severity of a disaster depends on both the physical nature of the extreme event and the social nature of the human populations affected by the event. Here are some important human factors that tend to influence disaster severity. A core point here is that different people, even within the same region, have different vulnerability to natural hazards.
Wealth. Wealth is one of the most important human factors in vulnerability. Wealth affects vulnerability in several ways. The poor are less able to afford housing and other infrastructure that can withstand extreme events. They are less able to purchase resources needed for disaster response and are less likely to have insurance policies that can contribute. They are also less likely to have access to medical care. Because of these and other factors, when disaster strikes, the poor are far more likely than the rich to be injured or killed. But there are exceptions. For example, some coastal areas contain expensive beachside real estate populated mainly by the rich, leaving the rich more vulnerable to tsunamis, storm surges, and other coastal hazards. Also, the rich tend to lose more money from disasters, simply because they have more valuable property at stake. We've already seen one example of the role of wealth, in the comparison of Hurricane Katrina (wealthier area, fewer deaths, higher monetary damage) to Cyclone Nargis (poorer area, more deaths, less monetary damage).
Education. Education is another important factor in hazard impacts. With education, we can learn how to avoid or reduce many impacts. When populations are literate, then written messages can be used to spread word about hazards in general or about specific disasters. Even without literacy, it is possible to educate a population about hazards in order to help it reduce its vulnerability. When populations include professionals trained in hazards, then these people can help the populations with their hazards preparations and responses. We'll see one example of the role of education on the next page: research by scholars in the Penn State Geography Department being used to help coastal communities in the face of hurricane storm surges. Here is another example that will help clarify exactly what sort of education is important for natural disasters.
Reading Assignment: Knowledge Without Modern Education
Modern education, such as that found in university geography departments, can be very helpful in reducing the harm from natural disasters. But other knowledge can help, too.
Tsunami folklore 'saved islanders' by Subir Bhaumik for BBC News discusses how ancient, isolated tribes on Indian Ocean islands drew on their oral traditions to survive the 2004 Indian Ocean Tsunami.
One key insight here is that we should not assume that our approach to education is necessarily the best, or that other approaches cannot work, too. Another insight is that the knowledge we gain from our experience observing and living in the world, and sharing this experience with others, can be every bit as useful as that which we gain from classroom or textbook instruction. Indeed, for this reason, many researchers in geography and other disciplines spend a lot of time engaged in fieldwork, i.e., research in relevant locations around the world instead of in libraries and universities.
Governance. The nature of both formal governments and informal governance in a population is another important factor. Governments can advance policies that reduce vulnerability. They can establish agencies tasked with reducing vulnerability, such as FEMA in the United States. They can support education and awareness efforts, as well as economic development to reduce poverty. Finally, they can foster social networks and empower individuals and communities to help themselves to prepare for and respond to hazards. Likewise, even without governments, communities can informally engage in many of these governance activities. Often the most vulnerable people are those who are politically marginalized because these people have less access to key resources and opportunities. One example of the role of government that we've seen already is the Myanmar government during Cyclone Nargis. This government is isolated from the international community and, thus, was not welcoming to international assistance in the aftermath of the cyclone. Compare that to Haiti after its 2010 earthquake. Haiti, like Myanmar, is a poor country, but it has positive and close relationships with the international community and thus readily welcomed international assistance in the aftermath of the earthquake. This assistance saved many lives and is helping Haiti rebuild.
Technology. The capabilities of the available technology can also play a large role in disasters. Technology can improve our ability to forecast extreme events, withstand the impacts of the events, and recover afterward. Technology is closely tied to wealth, education, and governance. Wealthier, more educated societies are more likely to have more advanced technology. A society's governance systems play a large role in how - and how effectively - the available technology is used in a disaster situation. One striking example of the role of technology is in the international response to the 2010 Haiti earthquake. On the next page, we'll learn about new Internet mapping technology such as Ushahidi that was used to help rescuers locate people in need. A lot of other technology was used in the response. For example, the U.S. Navy sent the USNS Comfort, a hospital ship, to treat the injured, and several helicopters to transport the injured to the ship. Helicopters were also used to distribute water. The helicopters were crucial because Port-au-Prince's port was damaged, as were many roads.
Age. Children and the elderly tend to be more vulnerable. They have less physical strength to survive disasters and are often more susceptible to certain diseases. The elderly often also have declining vision and hearing. Children, especially young children, have less education. Finally, both children and the elderly have fewer financial resources and are frequently dependent on others for survival. In order for them to survive a disaster, it is necessary for both them and their caretakers to stay alive and stay together. An example of the role of age is the 2003 European heat wave. About 40,000 people died in one of the hottest summers ever in Europe. Many of the deaths were elderly people who were still capable of taking care of themselves. These people were not able to adapt to the extreme heat and had no one helping them out.
Disabilities. People with disabilities are particularly vulnerable to natural hazards. Some emergency response technologies do not meet the needs of people with disabilities. For example, radio communication is not effective for warning deaf people about an incoming wildfire or hurricane. People who cannot walk may not evacuate on time if they don’t have a car or if public transportation is not properly equipped with a ramp or lift. Moreover, during a disaster it is difficult for caretakers or family members to reach people with disabilities who need special assistance.
Vulnerabilities associated with social norms and discrimination. Social norms and discrimination based on sex, sexual orientation and race may place certain groups in a more vulnerable position than others. In places where men are raised to be breadwinners, families prioritize boys’ education over girls’, thereby making women more likely to be poor and less educated than men. Women often face additional burdens as caretakers of families. When disaster strikes, women are often the ones tasked with protecting children and the elderly. This leaves them less mobile and more likely to experience harm themselves. LGBTI people may face difficulties in shelters after a natural hazard strikes. Since the government usually sets up same-sex shelters, trans individuals are not easily assigned to the appropriate shelter because government officials expect their gender identity to match their sex as stated in their IDs. In addition, because many LGBTI individuals conceal their sexual identities in public to avoid harassment, loss of privacy due to the destruction of homes may result in additional stress. This happened in the aftermath of the Haiti earthquake. Histories of racial segregation and institutionalized discrimination in many countries have resulted in greater poverty rates and lower quality housing and services among people of color. However, these material disparities alone do not explain the greater losses experienced by people of color. Several studies show a racial bias in emergency response. For instance, after the Loma Prieta earthquake in 1989, the media covered damage in whiter areas earlier than in ethnic minority neighborhoods, leading to a quicker emergency response in the former. In addition, whiter neighborhoods received more volunteers than equally affected neighborhoods with more people of color.
Intersectional approaches to vulnerability. People’s personal experiences during disasters are uniquely conditioned by not one, but several intersecting identities. For example, a young white, low-income man with a disability and a low-income elderly woman of color living in the same neighborhood may both be very vulnerable to a hurricane, but their experiences of vulnerability will certainly be quite distinct. Importantly, these intersecting human factors of vulnerability cannot be simply “added”—they are compounded in complex ways that are difficult to predict, but are revealed during the disaster.
Are there other human factors that influence disaster severity? Can these factors be integrated into disaster preparedness so that people can be better prepared and have faster and more efficient response to disasters?
Reducing Vulnerability to Natural Hazards
Reducing Vulnerability to Natural Hazards
There are many steps we can take to prepare for natural hazards and to respond when extreme events occur. These steps can be divided into several categories, though it is important to note that there is no clear distinction between these categories.
Pre-event Preparedness
When an extreme event is projected to occur, steps can be taken to make the event less of a disaster, i.e., to reduce the amount of harm that occurs. A key part of preparedness is in the projection itself. The more we know ahead of time about the event, and the further ahead of time we know it, the more effectively we can prepare for it. With prior warning, we can develop and implement plans to reduce harm. Note that it is not enough to have information about the upcoming event: the information must be communicated effectively so that the information is put to use. Given the information, there are several steps that can be taken. Some people can leave the affected area to avoid harm. Those who remain can make other preparations. Finally, those involved in disaster recovery efforts can make plans for their response.
Pre-event preparedness can be seen in preparations made in advance of Hurricane Katrina in 2005. Meteorologists forecasted the hurricane several days in advance. The director of the National Hurricane Center contacted the Mayor of New Orleans, the President of the United States, and others, expressing grave concern. This prompted a series of preparations. Evacuations were ordered; hundreds of thousands of people left the New Orleans area alone prior to the storm. Highways were set so that all lanes moved in the same direction: away. Those who remained made other preparations, such as those who gathered in the Louisiana Superdome for shelter. The Superdome was chosen in part because it was so large (about 26,000 people took shelter there) and in part because it was one of the few places in town situated above sea level, as can be seen from this photo:
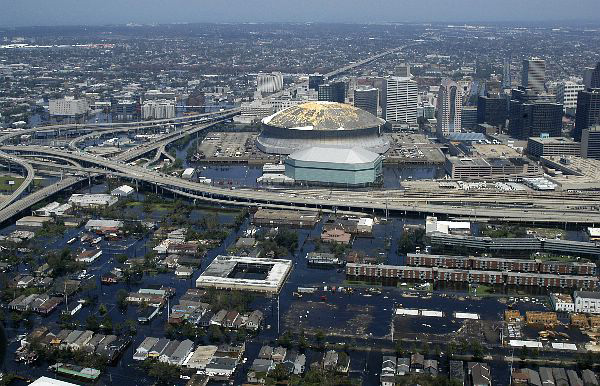
In addition to people evacuating and taking shelter, various public and private organizations planned for the subsequent emergency response. It should be noted that many people have criticized the pre-Katrina preparations as inadequate. But some preparations were made. Without these preparations, the damages would have been much more severe.
Emergency Response
Immediately after an extreme event occurs, emergency response seeks to reduce harm. A core goal of emergency response is to help affected people survive: pulling people out from under the rubble, attending to major injuries, distributing food and water, and building shelter. Here, people draw on whatever resources they can to keep people alive and in comfort. In major disasters, the international community will draw on its resources to deliver aid however possible. But emergency response also involves getting critical infrastructure back up and running as fast as possible. This infrastructure includes fuel and electricity, transportation routes, telecommunication systems, and clean water supplies. Indeed, an important part of the emergency response is quickly evaluating the scope and severity of the event and, in turn, what the key needs are.
Emergency response raises profound ethical questions. Imagine yourself standing in a disaster zone. Death and destruction are all around. What do you do? Who or what do you help? How would you decide what to do? For medical professionals, the situation is called triage: far more medical emergencies than can be addressed. One might neglect someone with “just a broken arm” in order to attend to someone who would otherwise die. Triage is a major use of ends ethics: the goal is to achieve the ends of the most lives saved.
Consider This: Ushahidi Community Mapping
‘Ushahidi’ is the Swahili word for ‘witness’ or ‘testimony.’ Ushahidi is also a community mapping website launched in 2008. Community mapping is a process for making a map in which community members feed information into the map. It is also called participatory mapping and is a form of crowdsourcing, in which tasks (in this case feeding information to the map) are outsourced to crowds. Ushahidi was developed by former residents of Kenya to help monitor protests and violence following the 2007 Kenya election, which many believed to have been manipulated. Since then, Ushahidi has also been used for emergency response to natural disasters, including the 2010 Haiti earthquake and the 2011 New Zealand earthquake. Prior to the Haiti earthquake, a technology like Ushahidi had never been used for an emergency situation of such a massive scale. Ushahidi is not the only group using cutting-edge mapping technology to assist with emergency response and other endeavors. Other groups include Crisis Mappers Net, OpenStreetMap, and CrisisCommons. While these projects are a novel innovation in emergency response, they share one important trait with all emergency response: using whatever resources are available to save lives and help out.
Post-event Recovery and Reconstruction (Video- 4:20 minutes)
As the immediate emergency situation settles, focus shifts to the longer-term project of trying to get conditions back to normal, or at least as close to normal as can be achieved. As the most dire medical emergencies have been attended to (including cases in which patients die), treatment emphasizes bringing people back to full health. Buildings, roads, and other infrastructure are rebuilt and repaired. Basic needs are covered less and less from emergency stockpiles and outside aid and more and more from normal economic activity. The challenge of reconstruction can be seen vividly in the case of the 2010 Haiti earthquake. The earthquake killed over 300,000 people and destroyed many buildings. Five years later, conditions still had not returned to normal. Details of the situation can be seen in the following video produced by United Nations.
NARRATOR: At 4:53 in the afternoon on the 12th of January 2010 Haiti was hit by one of the most disastrous earthquakes in history. More than 200,000 people lost their lives and 1.5 million were displaced. The capital suffered catastrophic damage, crippling government buildings, and destroying millions of homes.
MARIE-JOSETTE DARIUS MEMBER OF MORNE HERCULE COMMUNITY PLATFORM: Lots of houses were destroyed. Others cracked, the houses shook, they were practically turned upside down. My family and I were housed in a camp. We spent more than 15 months there. You couldn't really live your life there.
NARRATOR: Three years later, Haitians are continuing to rebuild their lives. The residents of [?inaudible?] are recycling debris left from the earthquake to rehabilitate their neighborhood. Marie-Josette is a 35-year-old mother of two. She has recently been trained as a brick maker and represents the women of her community at the local Neighborhood Council.
MARIE-JOSETTE DARIUS: We did that to bring everyone together to identify the priority needs in the area. We had lots of problems after the earthquake, but some are more urgent than others. For example, we identified the Charlemagne Peralte road as urgent. Streetlights - because the girls and the young women were being attacked in the area. It's like a parliament. We discuss, talk and reach agreement.
NARRATOR: With the help of the United Nations development program, UNDP, neighborhood councils like these empower residents to prioritize issues and get access to resources.
MARC-ANDRE FRANCHE, UNDP HAITI: People are the biggest wealth to rebuild their lives. They know what to do they know what needs to be done and they're the ones who can put the most energy into it.
NARRATOR: Since 2010, 1.2 million people have returned to their homes and 10 million cubic meters of rubble have been removed enabling Haiti to transition from disaster to long-term development.
MARC-ANDRE FRANCHE: You can see a lot of improvement. Not only has the debris been managed, rehabilitation of neighborhoods has started, and quite a bit of investments are now visible in those neighborhoods.
NARRATOR: In the neighborhood of [INAUDIBLE] very high in the hills of Bojo Pass, UNDP supported a project to reconstruct and improve roads, alleyways, drainage systems, public spaces, and build disaster resistant homes using recycled material.
AFKE BOOTSMAN, UNDP HAITI: There's the shared location of the debris is a big challenge. Haiti is built on many mountains where no heavy machinery can come. The culmination of community planning, debris removal, demolition recycling, and bringing back those recycled products into the neighborhoods at this scale is unprecedented.
MARC-ANDRE FRANCHE: The local economy has now started again. Jobs have been created in power plants and outside. It demonstrates that when the international community and the government get together and provide the money and the investments are made change is possible.
MARIE-JOSETTE DARIUS: The streetlights, the repair of Charlemagne Peralte road, a water project that will build water kiosks for the most vulnerable residents in the area paving the paths. Before, I didn't think I'd see Morne Hercule and the road the way they are today. Before, it was muddy everywhere. I thought it was a dream.
Recovery and reconstruction in Haiti face major challenges, not least of which is the threat of additional disasters. Haiti is in a major hurricane zone. In 2004, 3,000 Haitians died from Hurricane Jeanne. Furthermore, some seismological evidence suggests that the 2010 earthquake relieved only some of the pressure building up in the tectonic plates. In August 2021, another major earthquake hit Haiti, causing at least 2,200 deaths. These frequent extreme events make Haiti's long-term recovery much more difficult: just as it starts to get back on its feet, it gets knocked down again. This is one reason why Haiti remains the poorest country in the Western hemisphere.
Building Resilience in Non-disaster Times
Even when there are no specific extreme events that could happen anytime soon, there are steps that we can take to increase our resilience. These are generally long-term projects to enhance our physical infrastructure, our awareness, and other steps that will be useful to have in place when an event does occur. For instance, we can develop and enforce building codes requiring that buildings be able to withstand earthquakes or high winds. We can stockpile certain supplies to be available in times of need. We can develop insurance schemes to help each other recover from damages that occur. We can design and install warning systems to alert us to extreme events that may be about to occur. And we can study natural hazards so that we know how to prepare for and respond to them when an extreme event occurs.
Increasing resilience to natural hazards often requires a detailed understanding of the hazards. In the Penn State Department of Geography, several researchers are active in improving our understanding of hazards and in helping communities use this understanding to reduce their vulnerability and increase their resilience. Emeritus Professor Brent Yarnal studies the vulnerability of coastal communities to storm surges from hurricanes. Hurricane storm surge is an increasingly important issue because, as we will see in Module 9, climate change is causing sea levels to rise, making storm surges more severe. Professor Yarnal and his colleagues work directly with members of coastal communities, both to learn from their experience and to share research insights with them so that they can be better prepared for future hurricanes. This community engagement is seen in the photo below, showing community members in Sarasota County, Florida, planning land use so as to reduce vulnerability to hurricane storm surge. Note their use of maps to visualize the vulnerability of specific places! In general, university researchers and community members bring different perspectives and different resources to the table. By working together, we are able to better prepare for natural hazards.
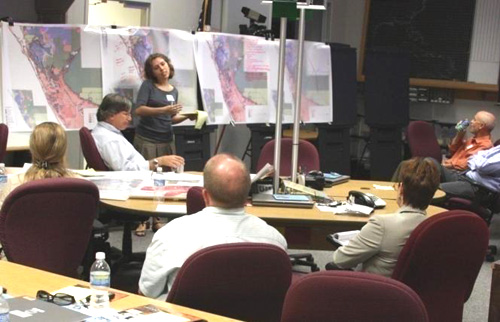
Natural Hazards Across Scale
Natural Hazards Across Scale
We study natural hazards because they are interesting and important, but also because we hope to reduce the damages caused by extreme natural events. Damage and losses from natural hazards are a major obstacle to sustainable development. In some sense, a community that can buffer the impacts of natural hazards is sustainable. Human populations always face natural hazards. When the impacts of an extreme event overpower a population’s abilities to cope (i.e., its resilience), there can be many significant losses, including loss of life, property, infrastructure (buildings, roads, etc.), and business. Sometimes these losses are so severe as to exceed the human system’s resilience and send it into a completely different state. For example, after Hurricane Katrina, many people moved out of New Orleans, never to return.
The natural hazards that we’ve discussed in this module have been mostly at local or regional scales. For example, the 2010 Haiti earthquake caused destruction mainly within one region of Haiti, which is a small country with about the same land area as Maryland. The response to the earthquake was global, but the disaster itself was not. The 2004 Indian Ocean tsunami caused destruction over a broader region, including parts of over ten countries. But neither these disasters nor any of the others discussed in the module were global in scale. Why, then, are natural hazards studied in a unit on global environmental change?
Perhaps the most important reason to study natural hazards in the context of global environmental change is to develop an appreciation for the subtle and specific ways in which humans prepare for and respond to environmental change in general. Natural hazards involve some of the most dramatic environmental changes at any scale and thus offer us important case studies for human-environment interaction. As we have seen throughout this module, extreme events challenge humanity to respond to environmental change, often by taking measures (such as medical triage) that we are usually uncomfortable doing. In many cases, if we do not try to respond, then people die, and often in large numbers. Such is the same with environmental change in general, including with global environmental change. As the environment changes, for any reason and at any spatial or temporal scale, we face the task of responding. The scenarios may not be as dramatic as the extreme events discussed in this module, but they are every bit as threatening.
Another important reason to study natural hazards in the context of global environmental change is that some natural hazards actually are of global scale. One is the hazard of objects from outer space: asteroids and comets. The largest of these can cause massive global destruction. Indeed, an asteroid impact is believed to have caused a global extinction event about 65 million years ago. The risk is sufficient enough that NASA maintains an active impact hazard monitoring program. Another global-scale hazard is the supervolcano: a massive volcanic eruption thousands of times larger than typical eruptions. Such an eruption would darken the skies for years, threatening the survival of many species, including humans. Fortunately, large asteroid and comet impacts and supervolcano eruptions are very rare and thus unlikely to happen anytime soon. But they could happen. Given the stakes involved, they may be worth at least some of our attention.
Finally, for any discussion of environmental change, it is important to remember the scales at which we as humans experience the environment. No matter how broad-scale an extreme event may be, we only experience it within our own portion of the world: our field of vision, our range of hearing, the local places that we exist in. For people in Indonesia that were hit by the 2004 Indian Ocean tsunami, on some level it did not matter that the tsunami also hit India, Somalia, and other far-off places. Their experience of the tsunami was immediate and local, as were the experiences of people in India, Somalia, and the other affected countries.
As we turn our attention to more global-scale processes, in particular, global climate change, it is important to remember that we experience these processes at the local scales of our lives. This holds for both the ways in which we help cause these global processes and the ways in which we are impacted by them. For this reason, we should keep in mind that global change is commonly experienced and addressed at local scales. Indeed, it is for this reason that the Association of American Geographers (AAG) led a team of leading geography researchers to write a book Global Change and Local Places. The ideas behind this book are central to the final set of modules and further illustrate the value of studying natural hazards in the context of global environmental change.
With that in mind, we will turn to one of the biggest examples of global environmental change - climate change - in our next module.
Summary
Summary
A natural hazard is an extreme event that causes harm to humans or to other things that we care about. Natural hazards include earthquakes, cyclones, tsunamis, floods, droughts, and many other types of events. Vulnerability to specific natural hazards varies across space and also within a place, based on factors such as age, gender, education, and so on. There are several steps that we can take to reduce our vulnerability to natural hazards, including increasing our overall resilience to them, preparing for specific extreme events, and responding and rebuilding after the event occurs. Researchers and professionals across several fields including geography have careers dedicated to reducing vulnerability to natural hazards and reducing the harm caused by specific extreme events. Community members also play important roles in reducing vulnerability and harm. While discussions of natural hazards often focus on events that occur at local and regional scales, there are global-scale hazards. There is also much to be learned from studying natural hazards (and, in particular, the human role in natural hazards) that can be applied to other topics in global environmental change.
Module 9 - Climate Change
Introduction
About Module 9
Climate refers to long-lived, broad-scale trends in meteorological phenomena such as temperature, precipitation, and wind. Natural and human systems are heavily influenced by climatic conditions. However, mainly since the Industrial Revolution two or three hundred years ago, human activity has been changing the global climate. This climate change is causing major disruptions to natural and human systems alike. The large scale of the disruptions and the large scale of the effort required to do something about it make climate change among the most important environmental issues that humanity faces today.
In this module, we are going to learn some key fundamentals of climate change, in particular on the human side. The module opens with some context for why climate change is important and some basics of our understanding about climate change. It then covers how climate change will impact human systems and what we can do about it.
What will we learn in Module 9?
By the end of Module 9, you should be able to:
- explain what a planetary boundary is in terms of scale and resilience;
- explain some fundamentals of the physical basis of climate change;
- describe some major impacts of climate change;
- discuss individual and collective actions that are being and could be taken to reduce greenhouse gas emissions.
What is due for Module 9?
The chart below provides an overview of the required activities for Module 9. For assignment details, refer to the location noted. Due dates are noted in Canvas.
| Requirement | Location | Submitting Your Work |
|---|---|---|
| Video Assignment: Planetary Boundaries | Planetary Boundaries | No submission |
| Written Assignment 5: Vulnerability Reduction | Written Assignments | Submit in Canvas |
Questions?
If you have any questions, please post them to our Course Q & A discussion forum in Canvas. I will check that discussion forum often to respond. While you are there, feel free to post your own responses if you, too, are able to help out a classmate. If you have a more specific concern, please send me a message through Inbox in Canvas.
Planetary Boundaries
Planetary Boundaries
We begin our discussion of climate change by considering the concept of planetary boundaries. The planetary boundary concept is a new one, originating in research released in 2009, but it is based on some classic concepts, in particular resilience at the global scale. In short, a planetary boundary is a limit to how much the Earth system can be disturbed without sending Earth into a new, unsafe state.
Video Assignment: Planetary Boundaries (18:42 minutes)
The planetary boundary concept was introduced in 2009 by a group of international researchers led by Johan Rockström of the Stockholm Resilience Centre.
JOHAN ROCKSTROM: We live on a human dominated planet, putting unprecedented pressure on the systems on earth. This is bad news, but perhaps surprising to you, it's also part of the good news. We're the first generation, thanks to science, to be informed that we may be undermining the stability and the ability of planet Earth to support human development as we know it. It's also good news because the planetary risks we're facing are so large that business as usual is not an option.
In fact, we're in a phase where transformative change is necessary, which opened the window for innovation, for new ideas, and new paradigms. This is a scientific journey on the challenges facing humanity in the global phase of sustainability. On this journey, I'd like to bring, apart from yourselves, a good friend. A stakeholder who's always absent when we deal with the negotiations on environmental issues. A stakeholder who refuses to compromise.
Planet Earth. So I thought I'd bring her with me here today on stage to have her as a witness of a remarkable journey, which humbly reminds us of the period of grace we've had over the past 10,000 years. This is the living conditions on the planet over the last 100,000 years. It's a very important period. It's roughly half the period when we've been fully modern humans on the planet. We've had the same roughly abilities of developed civilizations as we know it. This is the environmental conditions on the planet here used as a proxy temperature variability.
It was a jumpy ride. 80,000 years back in a crisis we leave Africa. We colonized Australia in another crisis 60,000 years back. Leave Asia for Europe and another crisis 40,000 years back and then we enter the remarkably stable Holocene phase, the only period in the whole history of the planet that we know of that could support human development. 1,000 years into this period, we abandon our hunting and gather patterns. We go from a couple of million people to the 7 billion people we are today. The Mesopotamian culture. We invent agriculture. We domesticate animals and plants. You have the Roman the Greek and the story as you know it. The only phase as we know it that can support humanity.
The trouble is, we're putting a quadruple squeeze on this poor planet, a quadruple squeeze which, as its first squeeze, has population growth, of course. Now, this is not only about numbers. This is not only about the fact that we're 7 billion people committed to 9 billion people. It's an equity issue as well. The majority of environmental impacts on the planet have been caused by the rich minority, the 20% that jumped onto the industrial bandwagon in the mid-18th century. The majority of the planet, aspiring for development, having the right for development, are largely aspiring for an unsustainable lifestyle, a momentous pressure.
The second pressure on the planet is, of course, the climate agenda, the big issue where the policy interpretation of science is that it would be enough to stabilize greenhouse gases at 450 ppm to avoid average temperatures exceeding two degrees. To avoid the risk that we may be destabilizing the west Antarctic ice shelf holding six meters level rise. The risk of destabilizing Greenland ice sheet holding another seven meter sea level rise.
Now, you would have wished the climate pressure to hit a strong planet, a resilient planet. But unfortunately, the third pressure is the ecosystem decline. Never have we seen over the past 50 years such a sharp decline of ecosystem functions and services on the planet, one of them being the ability to regulate climate on the long-term in our forest, land, and biodiversity.
The fourth pressure is surprise. The notion and the evidence that we need to abandon our old paradigm that ecosystems behave linearly, predictably, controllably in our, to say, linear systems. And that, in fact, surprise is universal, that systems tip over very rapidly, abruptly, and often irreversibly. This, dear friends, poses a human pressure on the planet of momentous scale. We may, in fact, have entered a new geological era, the Anthropocene, where humans are the predominant driver of change at a planetary level.
Now as a scientist, what's the evidence for this? Well, the evidence is unfortunately ample. It's not only carbon dioxide that has this hockey stick pattern of accelerated change. You can take virtually any parameter that matters for human well-being-- nitrous oxide, methane, deforestation, overfishing, land degradation, loss of species. They all show the same pattern over the past 200 years. Simultaneously, they branch off in the mid-50s, 10 years after Second World War, showing very clearly that the great acceleration of the human enterprise starts in the mid-50s. We see for the first time an imprint on the global level. And, I can tell you, you enter the disciplinary research in each of these, you find something remarkably important.
The conclusion that we may have come to a point where we have to bend the curves. That we may have entered the most challenging and most exciting decade in the history of humanity on the planet, the decade when we have to bend the curves. Now, as if this was not enough to just bend the curves and understanding the accelerated depression on the planet, we also have to recognize the fact that systems do have multiple stable states, separated by thresholds illustrated here by this ball-and-cup diagram where the depth of the cup is the resilience of the system.
Now, the system may gradually on the pressure of climate change erosion by the rest of loss lose the depth of the cup the resilience but appear to be healthy and appear to suddenly under a threshold be tipping over. Sorry. Changing state and literally ending up in an undesired situation, where a new biophysical logic takes over, new species take over, and the system gets locked.
Do we have evidence of this? Yes. Coral reef systems. Biodiverse low nutrient, hard coral systems under multiple pressures of overfishing, unstable tourism, climate change. A trigger, and the system tips over, loses its resilience. Soft coral take over, and we get undesired systems that cannot support economic and social development.
The Arctic. A beautiful system, a regulating biome at the planetary level, taking the knock after knock on climate change, appearing to be in a good state. No scientist could predict that in 2007, suddenly what could be crossing a threshold, the system suddenly very surprisingly loses 30% to 40% of its summer ice cover. And the drama is, of course, that when the system does this, the logic may change.
It may get locked in an undesired state because it changes color, absorbs more energy, and the system may get stuck, in my mind, the largest red flag warning for humanity that we are in a precarious situation. As a sideline, you know that the only red flag that popped up here was a submarine from an unnamed country that planted a red flag at the bottom of the Arctic to be able to control the oil resources.
Now if we have evidence, which we now have, that wetlands, forest, parts of the monsoon system, the rainforest behave in this non-linear way. 30 or so scientists around the world gathered and asked the question for the first time-- do we have to put the planet into the pot? Do we have to ask ourselves, are we threatening this extraordinarily stable Holocene state? Are we in fact, putting ourselves in a situation where we're coming too close to thresholds that could lead to deleterious and very undesired, if not catastrophic change for human development?
You know, you don't want to stand there. In fact, you're not even allowed to stand where this gentleman is standing at the foaming, slippery waters at the threshold. In fact, there is a fence quite upstream of this threshold, beyond which you are in a danger zone. And this is the new paradigm, which we gather two or three years back, recognizing that our old paradigm of just analyzing and pushing and predicting parameters into the future, aiming at the environment, minimizing environmental impacts is of the past.
Now we have to ask ourselves, which are the large environmental processes that we have to be stewards of to keep ourselves safe in the Holocene? And could we even, thanks to major advancements in earth system science, identify the thresholds, the points where we may expect non-linear change? And could we even define a planetary boundary, a fence, within which we then have a safe operating space for humanity?
This work, which was published in Nature late 2009, after a number of years of analysis led to the final proposition that we can only find nine planetary boundaries with which, under active stewardship, would allow ourselves to have a safe operating space. These include, of course, climate. It may surprise you that it's not only climate.
But it shows that we are interconnected among many systems on the planet with the three big systems, climate change, stratospheric ozone depletion, and ocean acidification, being the three big systems where there's scientific evidence of large-scale thresholds in the paleo-record Of the history on the planet. But we also include what we call the slow variables, the system that under the hood, regulate and buffer the capacity of the resilience of the planet.
The interference of the big nitrogen and phosphorus cycles on the planet, land use change, rate of biodiversity loss, freshwater use, functions which regulate biomass on the planet, carbon sequestration, diversity. And then we have two parameters, which we are not able to quantify, air pollution, including both warming gases and air polluting sulfates and nitrates, but also chemical pollution.
Together, these form an integrated whole for guiding human development in Anthropocene, understanding that the planet is a complex self-regulating system. In fact, most evidence indicates that these nine, may behave as three musketeers, one for all, all for one. You degrade forests, you go beyond the boundary on land, you undermine the ability of the climate system to stay stable.
The drama here is, in fact, that it may show that the climate challenge is the easy one, if you consider the whole challenge of sustainable development. Now this is the big bang equivalent, then, of human development within the safe operating space of the planetary boundaries. What you see here in black line is the safe operating space, the quantified boundaries, as suggested by this analysis.
The yellow dot in the middle here is our starting point, the preindustrial point, where we're very safely in the safe operating space. In the '50s, we start branching out. In the '60s already through the green revolution, and the Haber-Bosch process of fixing nitrogen for the atmosphere, you know, humans today take out more nitrogen from the atmosphere than the whole biosphere does naturally, as a whole.
We don't transgress the climate bound until the early '90s, actually, right after Rio. And today, we are in a situation where we estimate that we've transgressed three boundaries, the rate of biodiversity loss, which is the sixth extinction period in the history of humanity-- one of them being the extinctions of the dinosaurs, nitrogen, and climate change.
But we still have some degrees of freedom on the others, but we are approaching fast on land, water, phosphorous, and oceans. But this gives a new paradigm to guide humanity to put on the light on our, so far, overpowered industrial vehicle, which operates as if we're only on a dark straight highway.
Now the question then is how gloomy is this? Is then, sustainable development utopia? Well, there's no science to suggest-- in fact, there is ample science to indicate that we can do this transformative change, that we have the ability to now move into a new innovative, a transformative gear across scales. The drama is, of course, that 200 countries on this planet have to simultaneously start moving in the same direction.
But it changes fundamentally, our governance and management paradigm, from the current linear command and control thinking, looking at efficiencies and optimization towards a much more flexible, a much more adaptive approach where we recognize that redundancy, both in social and environmental systems is key to be able to deal with a turbulent era of global change. We have to invest in persistence, in the ability of social systems and ecological systems to withstand shocks, and still remain in that desired cup.
We have to invest in transformations capability, moving from crisis into innovation, and the ability to rise after a crisis, and of course, also to adapt to unavoidable change. This is a new paradigm. We're not doing that at any scale on governance. But is it happening anywhere? Do we have any examples of success on this mind-shift being applied at the local level? Well, yes, in fact, we do. And the list can start becoming longer and longer. There is good news here.
For example, from Latin America where plow-based farming systems of the '50s and '60s led farming, basically, to a dead end with lower and lower yields, degrading of organic matter and fundamental problems at the livelihood levels in Paraguay, Uruguay, a number of countries, Brazil-- leading to innovation and entrepreneurship among farmers in partnership with scientists into an agricultural revolution of zero-tillage systems combined with mulch farming with locally adapted technologies, which today, for example, in some countries have led to a tremendous increase in area under mulch zero-till farming, which not only produces more food, but also sequesters carbon.
The Australian Great Barrier Reef is another success story. Under the realization from tourist operators, fishermen, the Australian Great Barrier Reef Authority, and scientists that the Great Barrier Reef is doomed under the current governance regime, global change, eutrophication of agriculture, overfishing, and unsustainable tourism, altogether placing the system in the realization of crisis.
But the window of opportunity was innovation new mindset, which today has led to a completely new governance strategy to build resilience, acknowledge redundancy and invest in the whole system as an integrated whole, and then allow for much more redundancy in the system.
Sweden, the country I come from, has other examples where wetlands in southern Sweden were seen as, as in many countries, as flood-prone polluted nuisance in the peri-urban regions. But again, a crisis, new partnerships, actors locally, transforming these into a key component of sustainable urban planning. So crisis leading into opportunities.
Now what about the future? Well, the future, of course, has one massive challenge, which is feeding a world of 9 billion people. We need nothing less than a new green revolution. And the planetary boundaries analysis shows that our culture has to go from a source of greenhouse gases to a sink. It has to basically do this on current land. We cannot expand anymore because it erodes the planetary boundaries. We cannot continue consuming water as we do today with 25% of world rivers not even reaching the ocean, and we need a transformation.
Well, interestingly, and based on my work and others in Africa, for example, we've shown that even the most vulnerable small-scale rainfed farming systems with innovations and supplementary irrigation to bridge dry spells and droughts, sustainable sanitation systems to close the loop on nutrients from toilets back to farmers fields, and innovations and tillage systems, we can triple, quadruple yield levels on current land.
Elinor Ostrum, the latest Nobel Laureates of economics clearly shows, empirically, across the world that we can govern the commons if we invest in trust, local, action-based partnerships and cross-scale institutional innovations where local actors together can deal with the global commons at a large scale. But even on the hard policy area we have innovations. We know we have to move from our fossil dependence very quickly into a low-carbon economy in a record time.
And what shall we do? Everybody talks about carbon taxes, it won't work, emission trading schemes. But for example, one policy measure feed-in tariffs on the energy system, which is applied from China doing it on offshore wind systems all the way to the US, where you give a guaranteed price for investment in renewable energy, but you can subsidize electricity to poor people.
You get people out of poverty, you solve the climate issue with regard to the energy sector, while at the same time stimulating innovation-- examples of things that can be out-scaled quickly at the planetary level. So there is no doubt opportunity here, and we can list many, many examples of transformative opportunities around the planet. The key though, in all of these, the red thread is the shift in mindset.
Moving away from a situation where we simply are pushing ourselves into a dark future, where we instead backcast our future, and we say, what is the playing field on the planet? What are the planetary boundaries within which we can safely operate, and then backtrack innovations within that.
But of course the drama is it clearly shows that incremental change is not an option. So there is scientific evidence, the so to say, the harsh news that we are facing the largest transformative development since the industrialization. In fact, what we have to do over the next 40 years is much more dramatic and more exciting than what we did when we moved into the situation we're in today.
Now science indicates that yes, we can achieve a prosperous future within the safe operating space if we move simultaneously, collaborating on a global level, from local to global scale, in transformative options which build resilience on a finite planet. Thank you.
[APPLAUSE]
SPEAKER: Investment in broadband high-speed internet can help small businesses create new American jobs. Small businesses are being formed, dreams are being launched, and at AT&T, we're investing billions to upgrade and build out our wired and wireless networks. Now is not the time to stall momentum or stifle innovation or investment. Jobs, dreams, and the future are at stake. AT&T, your world, delivered.
As you watch the video please think about the following questions:
- What is the Holocene, and why does it matter to development/civilization?
- Note that the Holocene began about 12,000 years ago. Why is this time significant?
- What is the boundary for climate change?
- So, humanity is pulling nitrogen from the atmosphere and converting it to other forms. How are we doing this? With what process? Why are we doing this?
- Are the boundaries isolated issues or are they interrelated?
Details of the research project can be found at the Stockholm Resilience Centre website. Pay particular attention to recent updates to the Planetary Boundaries model.
As discussed in the video, the Holocene is the most recent epoch of Earth’s history. For the last 12,000 years or so, conditions on Earth have been relatively stable. This can be seen in data from ice cores in Antarctica and Greenland:
Note that in this graph, time proceeds to the left, meaning that today is at the left edge of the graph and points further to the right are further into the past. The graph shows concentrations of isotopes of hydrogen and oxygen at different times. Ice sheets build gradually over time; the chemical composition of a layer of the ice depends on the chemical composition of Earth’s atmosphere at the time. An ice core is a long cylinder that we remove from the ice sheet, giving us a sample of information about Earth’s atmosphere over long times. Ice cores are valuable sources of information about Earth’s history, which helps us understand how the Earth system works and, in turn, what Earth may be like in the future.
The important point to understand from the ice core graph is that the last 12,000 years or so have been relatively stable on Earth. It is during this period of stability that human civilization emerged. No one knows for sure whether civilization would have emerged without this period of stability, but we have strong reason to believe that the stability played an important role. Stable conditions made developing agriculture much easier since our ancestors could breed plants customized for stable local growing conditions. This may explain why – as we saw in Module 5 – agriculture emerged in several parts of the world within the last 12,000 years, but had not emerged anywhere else prior to then. For those of you interested in religion and its history, you might even ask whether it is a coincidence that in the Judeo-Christian tradition, the world (and everything else) was created about 6,000 years ago… and that this tradition originated in the Fertile Crescent.
So, what does this all have to do with climate change? Simply put, climate change threatens to cross a planetary boundary, to put the Earth system into a new state, a state different from that in which civilization emerged. Our civilization remains highly customized to Holocene Earth. Climate change may force us to make major adaptations. At this time, it is uncertain whether civilization can survive climate change intact.
Intellectually, we’re going to need a lot of resources to understand climate change and what to do about it. That’s what the rest of this module is about.
Climate Change Background
Climate Change Background
In Module 5, we watched a video by Hans Rosling about global development. Let’s begin our discussion of climate change by watching another Hans Rosling video (4:47) that covers similar ground.
PRESENTER: Visualization is right at the heart of my own work too. I teach Global Health, and I know having the data is not enough. I have to show it in ways people both enjoy and understand. Now, I'm going to try something I've never done before, animating the data in real space, with a bit of technical assistance from the crew.
So here we go. First, an axis for health, life expectancy, from 25 years to 75 years. And down here, an axis for wealth, income per person, $400, $4,000, and $40,000. So down here is poor and sick, and up here is rich and healthy. Now, I'm going to show you the world 200 years ago, in 1810.
Here come all the countries, Europe brown, Asia red, Middle East green, Africa south of Sahara blue, and the Americas yellow. And the size of the country bubble show the size of the population. And in 1810, it was pretty crowded down there, wasn't it? All countries were sick and poor. Life expectancy were below 40 in all countries, and only the UK and the Netherlands were slightly better off, but not much. And now, I start the world.
The Industrial Revolution makes countries in Europe and elsewhere move away from the rest, but the colonized countries in Asia and Africa they are stuck down there. And eventually, the Western countries get healthier and healthier, and now we slow down to show the impact of the First World War and the Spanish Flu epidemic. What a catastrophe! And now, I speed up through the 1920s and the 1930s, and in spite of the Great Depression, Western countries forge on towards greater wealth and health. Japan and some others try to follow, but most countries stay down here.
Now, after the tragedies of the Second World War, we stop a bit to look at the world in 1948. 1948 was a great year. The war was over, Sweden topped the medal table at the Winter Olympics, and I was born. But the differences between the countries of the world was wider than ever. United States was in the front. Japan was catching up. Brazil was way behind. Iran was getting a little richer from oil, but still had short lives. And the Asian giants, China, India, Pakistan, Bangladesh, and Indonesia, they were still poor and sick down here. But look what is about to happen.
Here we go again. In my lifetime, former colonies gained independence, and then finally, they started to get healthier and healthier and healthier. And in the 1970s, then countries in Asia and Latin America started to catch up with the Western countries. They became the emerging economies. Some in Africa follows. Some Africans were stuck in civil war, and others hit by HIV.
And now, we can see the world today in the most up-to-date statistics. Most people today live in the middle, but there are huge difference at the same time within the best of countries and the worst of countries. And there are also huge inequalities within countries. These bubbles show country averages, but I can split them. Take China, I can split it into provinces. There goes Shanghai. It has the same wealth and health as Italy today, and there is the poor inland province Guizhou. It is like Pakistan. And if I split it further, the rural parts are like Ghana in Africa.
And yet, despite the enormous disparities today, we have seen 200 years of remarkable progress. That huge historical gap between the West and the rest is now closing. We have become an entirely new converging world, and I see a clear trend into the future with aid to trade green technology and peace. It's fully possible that everyone can make it to the healthy, wealthy corner. Well, what you have seen in the last few minutes is a story of 200 countries, shown over 200 years and beyond. It involved plotting 120,000 numbers. Pretty neat, huh?
Notice that incomes and life expectancies around the world started increasing about 200 years ago. The United States and Great Britain were among the first countries to experience increases. Other countries took more time, but, by now, there have been increases almost everywhere. Why is that? What happened 200 years ago that caused health and wealth to start improving?
The answer is the Industrial Revolution. As societies learned how to develop industrial processes to produce more for us, our health and wealth began improving. By now, industry is so deeply embedded in so many facets of our lives that it’s often difficult to imagine life without it. There are still plenty of people today who produce much of what they use – including food, clothing, and shelter – by hand, but these people are increasingly few. Suffice to say, they are also not the people who tend to find themselves taking online university courses.
Central to the Industrial Revolution and to contemporary industry is the use of fossil fuels: oil, coal, and natural gas. They are called “fossil” fuels because they are sources of energy that derive from living organisms that were alive a long time ago. Originally, the energy from fossil fuels came from the sun. Ancient plants and other organisms trapped the sun’s energy via photosynthesis. Some of that energy found its way into today’s fossil fuels and is released when we burn the fuels for our industry.
The use of fossil fuels is unsustainable because we are using fossil fuels much faster than they are regenerating. Fossil fuels regenerate on timescales of hundreds of millions of years, but we are burning them up in just a few centuries. We can’t keep using fossil fuels forever as we use them today. Eventually, something must change. Given how central fossil fuels are to our industry, and how deeply embedded industry is within our lives, the depletion of fossil fuel resources represents a major challenge for humanity.
But there is another challenge associated with our use of fossil fuels. These fuels contain more than just energy. They also contain certain matter that, when we burn the fuels, ends up in the atmosphere. Some of this matter is in the form of molecules known as greenhouse gases, for reasons we’ll explain shortly. Greenhouse gases are also released into the atmosphere when we chop down and burn trees and other living matter.
Humanity has burned so much fossil fuel since the Industrial Revolution that we have significantly changed the concentrations of greenhouse gases in the atmosphere. The most important change is of carbon dioxide (CO2). 400 years ago, before the Industrial Revolution, there were 280 parts per million (ppm) of CO2 in the atmosphere, meaning that 280 out of every one million molecules in the atmosphere was a CO2 molecule. That might not seem like a lot, but it’s enough to make a big impact on the planet. Today, mainly because of burning fossil fuels (and also because of deforestation and a few other activities), there are about 400 ppm of CO2 in the atmosphere. That’s already a fairly large change, and we’re burning more fossil fuels now than ever before. If we burn all of the fossil fuels available on Earth, there could be about 1700 ppm of CO2 in the atmosphere, though we don’t yet know exactly how much fossil fuel exists across the planet. This is a very major change from the pre-industrial atmosphere, and a frightening thought, given that researchers believe that just 350 ppm may be a planetary boundary.
The change in greenhouse gases in the atmosphere is causing changes to the global climate system. These changes are already impacting natural and human systems worldwide. Much larger and more disruptive changes are projected as greenhouse gases continue to accumulate in the atmosphere. Unfortunately, the consequences of these climate changes are the sorts of things that are generally considered to be bad, whether one adopts an anthropocentric ethical view or an ecocentric ethical view.
Climate change is a difficult issue for several reasons. First, avoiding climate change involves reducing greenhouse gas emissions, which is difficult because fossil fuels are so central to our industry and our lives. Second, the global climate system and its interconnections with human and ecological systems are very complicated. We know a lot about these systems, but some important uncertainty remains. Third, the massive scale of climate change makes it a very difficult collective action problem. It involves everyone across the entire planet, from now until many thousands of years into the future. Finally, the severity of climate change is so great that human civilization may not survive it. For these and other reasons, climate change is perhaps the single most important issue for our civilization today.
The Physical Basis
The physical basis of climate change refers to our understanding of the physical properties of the climate and how it is changing. In other words, it is the physical (or natural) science behind climate change. Despite being a physical science, it asks some questions of major political and societal importance. Is the climate changing? In what ways is it changing? Are these changes caused by human activity? Because there is so much at stake with the answers to these questions, the physical science of climate change has been the center of extensive attention and a fair amount of controversy. In order to understand the human aspects of climate change, including the political issues, it is very helpful to have some understanding of the physical basis.
Climate vs. Weather
As a starting point for understanding climate change, we should recognize the difference between climate and weather. The difference is essentially a difference in scale. Climate refers to broad-scale trends in meteorological phenomena such as temperature, precipitation, and wind. Weather refers to local-scale instances of these same phenomena. Mark Twain once famously said: “Climate is what we expect, weather is what we get.” Climate patterns are identified by averaging the meteorological conditions over a long span of time (generally 30 years or more), allowing us to generalize what the weather conditions tend to look like for a given location and time of year. For instance, looking at the chart below from the Pennsylvania State Climatologist’s Office, we know that average high temperatures in July for Harrisburg, PA tend to be in the mid-80s (F). However, depending on the weather conditions during a particular year, actual values of meteorological data can end up above or below a climatological average. During July 2020, for example, anomalously warm weather conditions led to an average high temperature of 92 degrees F – several degrees higher than the average conditions.
| - | January | February | March | April | May | June | July | August | September | October | November | December | Year |
|---|---|---|---|---|---|---|---|---|---|---|---|---|---|
| Normal Daily Maximum | 37.5 | 40.9 | 50.9 | 62.6 | 72.6 | 80.8 | 85.7 | 83.7 | 75.7 | 64.3 | 52.5 | 41.7 | 62.4 |
| Normal Daily Minimum | 23.1 | 24.7 | 32.5 | 41.5 | 51.4 | 60.6 | 66.0 | 64.2 | 56.7 | 44.6 | 36.1 | 27.8 | 44.1 |
| Monthly Mean | 28.6 | 31.3 | 41.2 | 51.6 | 61.8 | 70.9 | 75.7 | 74.1 | 66.4 | 54.7 | 44.4 | 33.6 | 52.9 |
| Record Highest | 73 | 88 | 87 | 93 | 97 | 100 | 107 | 101 | 102 | 97 | 84 | 75 | 107 |
| Year | 1950 | 1997 | 1998 | 1985 | 1942 | 1966 | 1966 | 1944 | 1953 | 1941 | 1950 | 1998 | JUL 1966 |
| Record Lowest | -22 | -5 | 5 | 19 | 31 | 40 | 49 | 45 | 30 | 23 | 13 | -8 | -22 |
| year | 1994 | 1979 | 1984 | 1982 | 1966 | 1980 | 1945 | 1976 | 1963 | 2000 | 1955 | 1960 | JAN 1994 |
Understanding the distinction between climate and weather is crucial to developing a sound understanding of climate change. An isolated warm summer, by itself, is not necessarily evidence of climate change; rather, the departures from expected climate conditions for a particular year indicate climate variability, which do not necessarily demonstrate shifting trends in long-term climate. In contrast to climate variability, which corresponds to the standard “highs and lows” of the weather conditions for a given year, climate change refers to a shift in climate conditions over time. Although sporadic colder than average conditions have occurred recently, the observed shifts in overall climate conditions with time demonstrate a warming trend at the global scale, which is evidence of climate change.
Climate Change
Although changes in climate regimes have occurred numerous times throughout Earth’s history, a key distinction of modern (21st century) climate change is the impact of human activity on climate. In particular, emissions from industrial sectors are leading to an increase in the concentration of greenhouse gases in the lower atmosphere. The chemical composition of these greenhouse gases (e.g., carbon dioxide, methane) leads to absorption of surface radiation, ultimately increasing the amount of heat stored in the lower atmosphere. Over time, this net increase in global heat storage has led to rapid (climatologically-speaking) rates of warming. These human impacts on climate change are referred to as anthropogenic climate change. Although natural drivers of climate change do exist (e.g., the cycle of Earth’s axis position), these natural impacts by themselves would suggest little changes to Earth’s climate regime at the present, except perhaps for a minor cooling trend. Thus, given the current strong warming rate, anthropogenic sources are the clear main drivers of modern climate change.
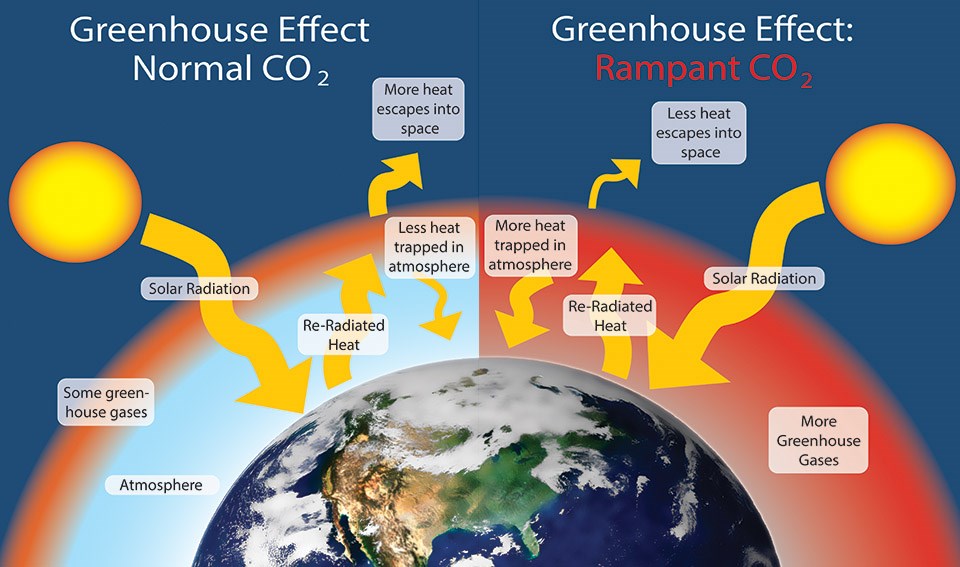
Common Misconceptions Surrounding Climate Change
To further develop a strong understanding of climate change, it is crucial to identify and clarify common misconceptions surrounding the physical basis of climate change. First and foremost, there is strong consensus within the climate science community on 1) the reality of modern climate change and 2) the significant impact of human activity on modern climate change. There is little debate among climate scientists about the reality of anthropogenic climate change; rather, most of the “debate” within the atmospheric science community corresponds to other issues, such as how to best predict future climate regimes or which potential governmental responses would be most effective at reducing greenhouse gas emissions. With that said, let’s clarify a few common misconceptions about modern climate change.
- Climate change is a natural phenomenon. As mentioned previously, it is true that natural drivers exist which influence climate change. For instance, the three factors of Earth’s axial tilt, precession, and orbital eccentricity – known collectively as Milankovitch cycles – play major roles in determining ice age and interglacial periods. However, these natural drivers of climate change alone would not be expected to produce the climate change presently occurring. Thus, modern climate change is largely anthropogenically-driven.
- The effects of modern climate change are good for humanity. Key tenets of this argument include that increasing carbon dioxide concentration levels will allow for greater agricultural production, as plants feed off of carbon. However, although plant life has flourished in prehistoric times of high carbon dioxide concentrations, these concentrations are rising at a much faster rate today than in prehistoric times. Thus, plant life today does not have the ability to adapt to shifting climate regimes and gas concentrations in the same way that prehistoric plant life could adapt to much more gradual climate change. In fact, many scientists anticipate adverse effects of rapid climate change on agricultural outputs. Another argument for the positive impacts of climate change is that increasing global temperatures will benefit human populations in colder locations. However, the effects of climate change are neither steady over time or uniform globally; a rapid shift to a warmer climate regime over a period of decades can result in unprecedented seasonal temperature swings within a given year, which can be very detrimental to food production. Additionally, climate change has major implications on precipitation patterns, leading to more unpredictable flood and drought patterns.
- Not all parts of the world are experiencing climate change. It is true that the temperature and precipitation shifts associated with climate change are non-uniform globally, with areas such as the Arctic more likely to experience dramatic increases in average temperatures than the Southeast U.S., for example. Further, much more subdued warming trends – or even cooling trends – have been observed over some parts of the world, such as the North Atlantic Ocean. However, these trends do not refute the existence and seriousness of modern climate change; rather, these patterns are occurring because of the impacts of climate change at other locations. For instance, increasing meltwater from warming over Arctic ice caps may be changing ocean circulation patterns, leading to an isolated area of cooling over the North Atlantic (Rahmstorf et al. 2015).
- Why are major snowstorms still occurring in the Northeast if the climate is changing? In short, air is able to retain more moisture as temperatures increase. This phenomenon is displayed mathematically by the Clausius-Clapeyron relation, which meteorology students may be (or will soon become) familiar with. Thus, so long as the ambient temperature at a given location during a winter storm is still cold enough to support snowfall, a snowstorm might produce more snowfall than would be normally expected, as more moisture is being retained by the atmosphere in our warming climate.
The bottom line: the physical basis for climate science is complicated and an area of extensive research, but the existence of anthropogenic climate change is scientifically-proven fact. Further, the rate at which the climate is changing is unprecedented, creating substantial concern for what climate conditions could be even within the next few decades.
The Human Dimensions of Climate Change
The remainder of this module focuses on the human dimensions of climate change, in particular how humans are impacted by climate change and how humans are responding to climate change. There are two main ways in which humanity is responding to climate change: mitigation and adaptation. Mitigation refers to efforts to reduce the amount of climate change that will occur via reducing the amount of greenhouse gases in the atmosphere. Adaptation refers to efforts to improve the impacts of whatever climatic changes end up occurring. Exactly what is meant by an “improvement” in terms of impacts is an ethics question. Similarly, there are ethics questions in what mitigation efforts humanity should make.
The relationship between climate change, mitigation, and adaptation can be seen in a simple systems diagram:
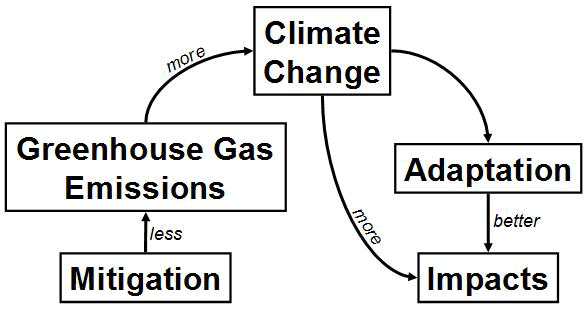
As this diagram shows, mitigation causes less greenhouse gas emissions, while greenhouse gas emissions cause more climate change. Thus mitigation causes less climate change. Meanwhile, climate change causes more impacts. Climate change can also cause adaptation, which leads to better impacts.
Reference
Rahmstorf, S., J. E. Box, G. Feulner, M. E. Mann, A. Robinson, S. Rutherford, and E. J. Schaffernicht, 2015: Exceptional twentieth-century slowdown in Atlantic Ocean overturning circulation. Nat. Climate Change, 5, 475–480, https://doi.org/10.1038/nclimate2554.
Impacts and Adaptation
Impacts and Adaptation
As the previous page indicates, it is clear that the climate is changing, and that these changes are caused mainly by human emissions of greenhouse gases. But this does not explain why we care so much about climate change, and, in particular, why we think climate change is bad. Why climate change is bad depends on our ethical view of what is “bad.” Here we’ll look at both anthropocentric and ecocentric views. In the case of climate change, disruption of ecosystems often also involves disruption to human systems, so the reasons for believing that climate change is bad are largely the same from both anthropocentric and ecocentric ethical views.
Temperature shifts
The simplest impacts of climate change are shifts in temperatures around the world. Overall, temperatures are increasing. Zones within a certain temperature range are shifting towards the north and south poles and towards higher elevations. Some species, in particular, plant species, are adapted to certain temperature ranges. These species are often shifting to different locations along with the temperature zones. But this shifting is imperfect. First, species may also be adapted to certain elevations or to certain latitudes. Latitude is important for plants because latitude defines how long days and nights are at a given time of year. Second, there may be obstacles impeding the species’ shift. For example, if a species lives on a mountain, it may not be able to cross a valley to get to the next mountain over. Thus some species will not successfully adapt to the temperature shifts caused by climate change. This includes both species in natural ecosystems and species used in human agriculture. (As we will have seen in previous modules, agriculture is always part of an ecosystem, so natural ecosystems and human agriculture are not completely separate from each other.)
Shifts in water
Water patterns are closely connected to temperature patterns. When temperatures are warmer, more ice melts or water evaporates. This affects precipitation patterns. Shifts in precipitation patterns complicate the process of species adapting to temperature shifts since species are generally also adapted to certain precipitation. For example, a plant might shift towards the north pole to stay within the same temperature zone, but if the precipitation zone does not also shift north, then the plant will have to struggle with different precipitation.
One of the most important shifts in water from climate change is the melting of ice at several places around the world.
In the Arctic Ocean, ice melting is leading to the opening of the Northwest Passage, a sea route between the north Atlantic and north Pacific oceans. The Passage is becoming increasingly navigable, making shipping (especially freight shipping) much less expensive between the wealthy and populous northern nations of Europe, North America, and East Asia. Other countries will be hurt by this, in particular, Panama, whose Canal will diminish in importance.
In central Asia, ice melting in the Himalayas is disrupting water supplies of crucial importance to very large human populations in India, China, and surrounding areas. There is concern about whether these populations will have access to enough fresh water in the future.
In Antarctica and Greenland, large amounts of ice are melting, increasing the amount of water in the oceans. This, in turn, raises sea level. Sea level rise is further increased by thermal expansion: as ocean temperatures increase, the water expands, pushing sea level higher. Ice melt and thermal expansion are causing enough sea-level rise that some low-lying coastal areas could become uninhabitable. This is a particularly serious concern because a large portion of the human population lives in such areas. Many major world cities are threatened, including New York, Los Angeles, Mumbai, Tokyo, Hong Kong, and even London, which is near sea level despite being inland along the River Thames. Already, London has moveable barriers to protect against high tide storm surges. Sea level rise threatens to make the surges more severe.
Extreme weather events
As we saw in Module 8, extreme weather events can cause major disruptions. Climate change is affecting extreme weather events, often by making them more extreme and disruptive. One example of this is hurricanes. Hurricanes get their energy from the warm waters they pass over. This is why the strongest hurricanes occur in warmer regions. As waters warm, they gain more energy, thereby making hurricanes more powerful. For this reason, climate change is expected to increase the intensity of hurricanes and, unfortunately, more intense hurricanes often cause much more damage.
Adaptation
Human and non-human systems alike are adapting and will continue to adapt to climate change. These adaptations are not always successful; the impacts of climate change will inevitably cause harm. But adaptation can reduce the amount of harm caused.
Adaptation raises some large ethical questions. Who should pay for the costs of adaptation: the people who are adapting or the people who emit the greenhouse gases that made the adaptations necessary? It might seem unfair for some people to force other people to adapt, but it is difficult to get emitters to pay when the emitters are everyone across the planet! Another question is: How should we prioritize among adaptation projects? Should we support the projects that a few wealthy people are able to pay for or the projects that many poor people really need? There are distributive justice issues here. Also, how should we prioritize adaptations for humans vs. adaptations for ecosystems? Finally, what process should be used to make adaptation decisions? These questions and others are heavily debated among those involved in adaptation across all scales from local to global.
One final point to remember about impacts and adaptation is that they are occurring in the context of other changes to natural and social systems. In other words, climate change is not the only aspect of our world that is changing. There are also political, economic, technological, ecological, and other changes going on. As we prepare for the future impacts of climate change, it is important to remember that it will be the future world doing the adapting, not the present world. When we treat climate change as only one aspect of our world, we are more likely to be successful at adapting to future conditions in general, including conditions affected by climate change.
Gender and Climate Change
Why Focus on Women?
In Module 8, we learned about the relationship between identities and vulnerability regarding disasters. Marginalized populations are more vulnerable to change not by nature of who they are, but as a result of the hegemonic social conditions that produce and maintain their subordination. For example, women are not more vulnerable because they are women, but because they are marginalized in relation to men given society’s patriarchal norms. Additionally, similar to the escalation of disasters, humans play a role in the detrimental effects of climate change through local and international policies and practices (e.g. irrigation methods). Given that women are both more vulnerable to the effects of climate change and, as roughly half of the human population, play a significant role in the progression of climate change, it is critical that they have agency regarding climate change protection and mitigation efforts.
In this sub-module, we will 1) explore different approaches to incorporating gender into climate change policies, projects, and programs, 2) address some of the ways in which women from around the world are impacted by climate change, and 3) examine some of the steps that women are taking towards achieving environmental sustainability and climate change resilience.
Many of the points below are derived from the following two readings from the International Union for Conservation of Nature and the Global Gender and Climate Alliance’s Roots for the Future: The Landscape and Way Forward on Gender and Climate Change:
- Oliva, Manuel J. and Owren, Cate. “Roots for a More Equal and Sustainable Future.” Roots for the Future. Ed. Aguilar, Lorena, Granat, Margaux, and Owren, Cate. Washington, DC: IUCN and GGCA, (2015): 14-45.
- Oliva, Manuel J. and Owren, Cate. “Leading the Way: Case Studies of Gender-Responsive Initiatives.” Roots for the Future. Ed. Aguilar, Lorena, Granat, Margaux, and Owren, Cate. Washington, DC: IUCN and GGCA, (2015): 383-466.
Please review for more background on this topic!
Gender Sensitive vs. Gender Responsive vs. Gender Transformative Policies
There are three key approaches to incorporating gender into policies and projects: a gender sensitive approach, a gender responsive approach, and a gender transformative approach. A gender sensitive approach, otherwise known as a “do no harm” approach, entails “Understanding and taking into consideration socio-cultural factors underlying sex-based discrimination” (Oliva and Owren, 2015). A gender responsive approach, otherwise known as a “do-better” approach, is a more thorough integration of gender that entails “[i]dentifying, understanding, and implementing interventions to address gender gaps and overcome historical gender biases in policies and interventions” (Oliva and Owren, 2015). Taking a gender responsive approach one step further, a gender transformative approach entails focusing on gender as “central to a policy, programme or project, promoting gender equality as a priority and aiming to transform unequal relations, power structures, access to and control of resources, and decision-making spheres” (Oliva and Owren, 2015).
Consider a few of the case studies within Roots for the Future. Why are these case studies labeled as gender responsive rather than gender inclusive or gender transformative?
Gender Equity vs. Equality
Equity and equality are often conflated, but actually have two different meanings. The differences between equity and equality affect the intent of policies that incorporate these terms. Gender equality means that men and women are equivalently able to achieve their goals without hindrance caused by oppressive social structures and norms. For instance, a gender equality approach to hiring would require that men and women have the same opportunities to apply for and be considered for a job. However, this approach ignores the historical and lasting effects of gender-based oppression. While gender equality is a valuable aim, gender equity must occur first. Gender equity means that men and women have the same opportunities to achieve their goals, while taking into account the historical and lasting effects of gender-based oppression that gender equality ignores. For example, a gender equitable approach to hiring would require that men and women have the same opportunities to be considered for a job, while taking into account gendered reasons for employment gaps, e.g. to care for a family member, and different educational and employment pathways, e.g. the prioritization of men’s education and employment over women’s, that are often influenced by gendered policies and practices. While gender equity is essential to achieving gender equality, it is an ongoing process. Thus, when considering gender equality in relation to climate change related policies, measures towards achieving gender equity must constantly be integrated, re-worked, and assessed (Oliva and Owren, 2015).
Environmental Impacts on Women
Due to social and political norms, women tend to have less policy influence, greater care-giving roles, fewer opportunities to access educational, financial, and health resources, and an increased risk of experiencing sexual assault. As a result, climate change exacerbates already existing vulnerabilities for women and girls.
These issues are well demonstrated through the gender transformative UN Women Bangladesh climate change initiative. As program specialist Dilruba Haider explains, the increase in climate-change related disasters in Bangladesh has resulted in detrimental effects for women and girls in the country including “further violations of women’s rights and dignity, such as human trafficking, child marriage, sexual exploitation and forced labour” (Haider, 2017). As Haider asserts, “Even simple things like lack of access to toilets impact women and girls disproportionately—during floods, men will often defecate in the open, while women wait until darkness falls, increasing their risk of Urinary Tract Infections and other health hazards, as well as sexual abuse” (Haider, 2017).
See pages 33-35 of “Roots for a More Equal and Sustainable Future” for more examples of how men and women are differentially impacted by climate change (Oliva and Owren, 2015).
Women’s Climate Change Resilience and Mitigation Efforts
Because women’s perspectives and experiences are often overlooked, women offer unique expertise regarding climate change mitigation efforts. Furthermore, women’s involvement in climate change initiatives results in improved outcomes. In Bangladesh, as part of UN Women’s 2017-2020 National Resilience Programme, women are pursuing disaster-resilient, non-traditional livelihoods, including “mele (a type of climate resilient reed) cultivation, growing floating vegetable gardens and pickle making” (Haider, 2017). While this initiative is most focused on mitigating the effects of cyclones and floods, other initiatives, such as the World Bank Group’s Water Global Practice, focus on mitigating the effects of droughts. The Water Global Practice has been taking a gender responsive approach to nutrition-sensitive water management. Within their initiatives, women’s feedback is essential for success. For instance, given differences between the physical height and strength and the home and child-rearing responsibilities that often differentiate men and women, women’s feedback regarding the types of water irrigation systems implemented and their locations is essential for these systems to have optimal effects. Additionally, when considering which crops to prioritize, given the norms that place unequal responsibility on women to cook and care for children, women tend to prioritize nutrient dense crops for the home rather than to sell in the market. Without including women’s input in water management, women and children are disproportionately at risk for experiencing nutrient deficiencies (Bryan, Chase, Shulte, 2019).
Works Cited
Haider, Dilruba. September 5, 2017. “Expert’s Take: When Building Climate Resilience, Women’s Needs Cannot Be an Afterthought.” UN Women. Accessed on November 20, 2020. https://www.unwomen.org/en/news/stories/2017/9/experts-take-dilruba-haider.
Oliva, Manuel J. and Owren, Cate. Roots for the Future. Ed. Aguilar, Lorena, Granat, Margaux, and Owren, Cate. Washington, DC: IUCN and GGCA, (2015): 14-45. https://portals.iucn.org/union/sites/union/files/doc/rftf_2015_chapter_1.pdf.
Bryan, Elizabeth, Chase, Claire, and Shulte, Mik. “Nutrition-Sensitive Irrigation and Water Management.” Washington, DC: Water Global Practice, (2019). https://documents1.worldbank.org/curated/en/589571566456141451/pdf/Nutrition-Sensitive-Irrigation-and-Water-Management.pdf.
Individual Action on Mitigation
Individual Action on Mitigation
Suppose you want to reduce your greenhouse gas emissions. What can you do? Here are some major suggestions.
Plan where you live
Where you choose to live is probably the single biggest factor in how much greenhouse gases you emit. This includes what city you live in, what neighborhood you live in within the city, and even what building you live in within the neighborhood. Where you live is important for several reasons.
First, as we saw in Module 7, the type of urban area you live in has a large influence on your transportation. This includes what modes of transportation you use (cars, transit, walking, etc.). In general, cars cause the most greenhouse gas emissions, followed by transit. Walking and bicycling cause almost no greenhouse gas emissions. This also includes how much transportation you’ll be using. In general, the farther you travel to go from place to place, the more greenhouse gas emissions you’ll cause.
Second, as we also saw in Module 7, buildings vary tremendously in how much energy they require per person. Much of this energy is in heating and air conditioning. Buildings in more moderate climates (such as the west coast of the United States) need less energy for heating and air conditioning than buildings in more extreme climates (such as the east coast of the United States). Apartment buildings need less energy per person than stand-alone houses because apartments share walls with each other and don’t lose heating and cooling to the outside as much. Finally, buildings can vary in the efficiency of their design. Buildings with better insulation and other ‘green’ design features require less energy for heating and air conditioning. Buildings with energy efficient technologies also require less energy.
Where you live also influences what social interactions you’ll have. This includes who you’ll meet and be friends with and what opportunities you’ll have to get involved in a democracy. These factors are also important to greenhouse gas emissions, though this relates to social norms and collective action as much as it does to individual action. Wherever you choose to live, it’s also important to maintain your residence effectively. This includes using insulation and choosing efficient appliances. It also includes using less heating and air conditioning by setting the temperature lower in the winter and higher in the summer. Finally, it means turning off lights and other devices when they’re not needed. In general, the biggest electricity savings come from the biggest devices: washing machines, dryers, refrigerators, and other big appliances that get used frequently. Light bulbs are also important because they are used so often and there’s such a big efficiency difference between incandescent (less efficient) and fluorescent (more efficient) lights.
Choose low-impact foods
In Module 6, we saw that livestock has a large shadow, i.e., a large environmental impact, including a large amount of greenhouse gas emissions. This is because we need to grow a lot of plants to feed livestock animals and because the animals produce pollution, including greenhouse gases, on their own. Eating less of an animal-based diet and more of a plant-based diet will, in general, have much lower greenhouse gas emissions. This is among the biggest actions that individuals can take to reduce emissions.
There are other actions we can take with food as we also saw in Module 6. We can eat locally-grown foods that do not use as much energy for shipping. Eating fresh foods instead of refrigerated or frozen foods also helps, because the refrigeration and freezing processes use a lot of energy. Food processing, in general, requires energy, so processed foods will usually require more energy. This includes processing we do in our homes: cooking, refrigerating leftovers, etc. But there can be tradeoffs. For example, some processed foods last longer than fresh foods and are thus less likely to go to waste. It can often be difficult to identify exactly which foods cause the least emissions.
Buy carbon offsets (Video- 5:45 minutes)
A carbon offset is a way to pay other people to reduce their emissions. It’s called an offset because you can use it to ‘offset’ the emissions that you cause. It’s an appealing scheme because you get to do what you wanted that causes emissions and the climate won’t be affected. This depends on the offset working as it's supposed to. This scheme follows from ends ethics and not means ethics: the means of causing emissions are OK as long as the ends of climate change are unaffected.
PRESENTER: Recently its become trendy for corporations to advertise their efforts to become carbon neutral, which at first glance seems like a commitment to rid themselves of fossil fuels. While, this is an admirable cause it's a little too good to be true. How can a car rental company like Avis possibly achieve carbon neutrality, when its whole business model is based on a fossil fuel reliant form of transportation? In reality, the majority of this carbon neutrality is based not on changing business practices, but instead on purchasing carbon offsets to counteract a large chunk of their emissions. So today I'm going to answer a few questions.
"What are carbon offsets?"
"How do they work and are they effective carbon offsets?"
"Are essentially a trading scheme for carbon emissions?"
Carbon offset are essentially a trading scheme for carbon emissions. When someone purchases an offset, they are investing their money in an environmental project somewhere around the world. These projects include everything from building new solar installations, to planting a tree, to lighting methane releases in landfills on fire.
Clearly the types of offsets vary widely and it's often pretty difficult to figure out where the money is actually going. Additionally because offsets are so varied, they run a wide spectrum of effectiveness. And if you do want to counteract the emissions of a long car ride, for example, you'd have to buy through a company like Terra Pass. Which invests in a range of renewable projects that capture methane from landfills and abandoned coal mines. So again, it's hard to know exactly where your money is going.
"But do carbon offsets actually lower our global carbon emissions?"
In short, not really. Carbon offsets act as a band-aid that allows the root problem to continue to exist. A factory can keep on pumping out greenhouse gases by pushing the responsibility onto a wind farm halfway across the world. By buying into the idea that markets can solve problems, that markets created. Offsets may slow the more fundamental changes that need to happen in our economy government and society. As Naomi Klein author of this changes everything points out "when a company buys these offsets as a way to justify their continued rate of fossil fuel emissions, it's one step forward, one step back, at best they are running in place,"
Whether the offset is effective or not is just one part of deciding whether they are a good piece of the solution to climate change. There are also important ethical considerations to weigh as we as individuals are deciding how we approach carbon offsets.
The Guardian journalist George Monbiot likens our use of offsets to the way in which people from 15th and 16th century Netherlands absolved their bad deeds with purchases of indulgences. A system in the Catholic Church where an you could donate money in order to rid yourself of sins. On the ground some carbon sequestration efforts can do much more harm than good. As is the case for the Norwegian own green resources forestry offset project in Cottrell Uganda which has violated the basic human rights of the local residents undermine their livelihoods and threaten their very survival. Although this doesn't reflect all carbon offset projects there have been enough of these schemes to give rise to the phrase carbon colonialism. This can't be a path forward instead climate justice movements and initiatives need to work in tandem with more human centered justice movements and initiatives and vice versa.
If you feel the need to alleviate your guilt from a long plane trip via carbon offsets consider addressing your guilt head-on you may still decide to purchase a carbon offset but definitely do your research know what kind of offset you are purchasing and realize that it's not addressing the core problems that lead to climate change. Even better than carbon offsets are giving money to an environmental justice group doing good work in your area. Or try to reduce the amount of times you fly in the year. For companies and individuals offsetting should not replace the hard work of trying to reduce emissions in any way possible.
If you're struggling with carbon offsets or have to fly a lot and don't really know what to do, I'd strongly suggest heading over to my fellow youtuber Levi Hildebrand's channel and watching his video on carbon offsets. It's a really honest look at dealing with a high impact lifestyle and it's basically the part two of this video. So go on over and check it out you won't be disappointed.
Everyone if you did end up enjoying this video I've got a lot more lined up for the next couple of months. Like the environmental cost and fast fashion so make sure you hit the subscribe button share the video around or support the channel financially on patreon. All that helps me out a lot, otherwise I will see you in two weeks.
Carbon offsets are somewhat controversial. Some people are concerned that offsets make it easier for the rich to keep polluting while placing the mitigation burden on the others, instead of having all members of society carry their share of the burden. Others respond that with offsets, everyone benefits, since the people who are reducing their emissions in an offsets scheme are agreeing to make the reductions in exchange for being paid. Another concern is that sometimes the offset doesn't actually happen. If the money isn't spent properly, then the climate benefits won't be realized. For example, the money could go to an emissions reductions project that would have happened anyway, in which case the offsets bring no additional climate benefits. This 'additionality' issue is a major concern with offsets. All things considered, offsets cannot, on their own, solve all of our mitigation problems, but they can be a useful component to a broader set of mitigation efforts.
Collective Action on Mitigation
Collective Action on Mitigation
Climate change mitigation can often be treated as a collective action problem. This happens when individuals don’t want to reduce their own emissions. Sometimes we do want to reduce emissions. For example, low-emission food, transportation, and buildings are often healthier, more convenient, and less expensive. But, often, we don’t want to reduce emissions. Instead, we would rather continue doing whatever we had been doing before. In the language of Unit 2, we don’t want to transition to sustainability. When this happens, we face a collective action problem. It is in our individual interest to keep emitting, but it is in our group interest to reduce emissions.
This has its challenges. With climate change, we are trying to foster collective action among all of humanity, now more than 8 billion people. This has many more challenges. There are language barriers. There are differences in values. There are differences in awareness about climate change. And there is the monumental logistical challenge of reaching some sort of agreement across so many people.
Since 1992, global collective action on climate change has been promoted via the United Nations Framework Convention on Climate Change (UNFCCC). Note that it is the United Nations. This means that the world’s population is grouped by nationality, instead of by religion, wealth, ethnicity, ethics views, or anything else. Each nation sends representatives to treaty negotiations that occur once or twice per year. The biggest meeting happens each December in a different city. In 1997, the meeting was in Kyoto. This meeting resulted in the Kyoto Protocol, a treaty signed by most countries (but not the United States) that was aimed at reducing emissions between 2008 and 2012 but was largely unsuccessful. In 2009, the meeting was in Copenhagen. Hopes were high that a more successful Kyoto Protocol replacement would be achieved at Copenhagen. Instead, the much weaker Copenhagen Accord was reached, a non-binding document negotiated by the US and other countries. In 2012, at the meeting in Doha, Qatar, the Doha Amendment was adopted, which extended the Kyoto Protocol until 2020. A key shift in climate diplomacy occurred at the 2015 Conference of the Parties (COP) meeting in Paris, France. Specifically, signatories to the Paris Agreement agreed to set country specific greenhouse gas reduction targets, which are referred to as Nationally Determined Contributions (NDCs). You can read more about the Paris Agreement on the UNFCCC website.
There are several reasons why it is so difficult to reach a strong international treaty to reduce greenhouse gas emissions. First, reaching any international treaty is difficult, given the large number of nations around the world. The UNFCCC has 197 member nations. Even North Korea participates, despite being absent from many other international processes. Second, reducing emissions is very difficult. Emissions are closely tied to fossil fuel use, which is, in turn, closely tied to industrial activity. For a nation to reduce its emissions, it might have to reduce its standard of living or even its geopolitical strength. Third, there are major differences between the positions and views of different countries. Poor countries often feel that it is unfair for rich countries to ask them to reduce emissions when the rich countries cause most of the emissions and when the poor are just trying to develop a decent standard of living. Countries that own a lot of fossil fuels often want the opportunity to extract and use the fossil fuels, either for their own activities or to sell to other countries. Countries that are especially vulnerable to the impacts of climate change (e.g., small island developing states in the Caribbean and Pacific) are especially eager for emissions to be reduced. All of these factors (and others) combine to make it very difficult to achieve international collective action on mitigation.
History of the UNFCCC and Kyoto Protocol
The political process to tackle climate change began one year after the United Nations (UN) succeeded in forging the Montreal Protocol that imposed a gradual phase-out of CFCs responsible for the ozone hole.
- 1988: The UN asked for a high-level scientific assessment and the IPCC (Intergovernmental Panel on Climate Change) was established; the UN General Assembly takes up climate change
- 1990: The IPCC First Assessment Report is published, which acknowledges human influence on climatic changes; negotiations were opened on the framework convention
- 1992: The United Nations Framework Convention on Climate Change (UNFCCC) is adopted in New York; the UNFCCC is opened for signature at the Earth Summit in Rio de Janeiro
- 1994: The UNFCCC comes into force (50 ratifications)
- 1995: Start of Conferences of the Parties (annual COP); the IPCC Second Assessment Report is published
- 1997: The Kyoto Protocol is created
- 2001: The IPCC Third Assessment Report is published
- 2005: The Kyoto Protocol becomes binding as Russia ratified the protocol
- 2007: The IPCC Fourth Assessment Report is published; the IPCC and Al Gore receive the Nobel Peace Prize
- 2014: The IPCC Fifth Assessment Report is published
- 2015: The Paris Agreement is adopted
If you are interested, check out the IPCC website and browse the full reports of the three different working groups. Also, check out how the process works to participate in the 6th Assessment Report.
Self-check
The map below shows the size of individual countries proportional to their carbon emissions in 2000.
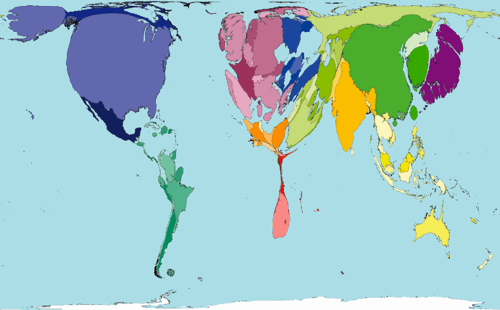
Research total carbon emissions and per capita carbon emissions for the following 10 countries: United States, Australia, China, India, Qatar, Russia, Canada, Ghana, Bangladesh, and Peru. Then, write a paragraph discussing the implications of these differential contributions and your point of view on what a fair global climate treaty should look like.
Note that the map above was from 2000. Check out a more recent map of global carbon dioxide emissions in 2020 to see what has changed.
Rationale of UNFCCC and the Kyoto Protocol
The UNFCCC
“The ultimate objective of this Convention and any related legal instruments that the Conference of the Parties may adopt is to achieve, in accordance with the relevant provisions of the Convention, stabilization of greenhouse gas concentrations in the atmosphere at a level that would prevent dangerous anthropogenic interference with the climate system. Such a level should be achieved within a time-frame sufficient to allow ecosystems to adapt naturally to climate change, to ensure that food production is not threatened and to enable economic development to proceed in a sustainable manner.”
Source: What is the United Nations Framework Convention on Climate Change?
All countries that have signed and ratified the convention agree to general commitments. Specific levels of greenhouse gas concentrations or reductions are not quantified.
The convention distinguished between two types of parties (countries that have ratified the FCCC): Annex I Parties (industrialized countries comprising the OECD countries and ‘economies in transition’) and Non-Annex I Parties (most developing countries). This distinction has been exceedingly important for obligations later identified under the Kyoto protocol.
The above distinction is reflected in the figure below, illustrating annual fossil fuel carbon dioxide emissions, in million metric tons of carbon, by region:
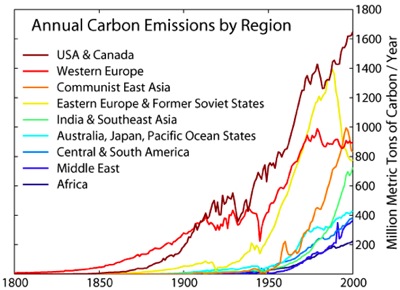
The Kyoto Protocol
(Adapted from United Nations Framework Convention on Climate Change: Kyoto Protocol)
The Kyoto Protocol is an international agreement linked to the United Nations Framework Convention on Climate Change. The major feature of the Kyoto Protocol is that it sets legally binding targets for 37 industrialized countries and the European community for reducing greenhouse gas (GHG) emissions. These amount to an average of five percent against 1990 levels over the five-year period 2008-2012.
The major distinction between the Protocol and the Convention is that while the Convention encouraged industrialized countries to stabilize GHG emissions, the Protocol commits them to do so.
Recognizing that developed countries are principally responsible for the current high levels of GHG emissions in the atmosphere as a result of more than 150 years of industrial activity, the Protocol places a heavier burden on developed nations under the principle of “common but differentiated responsibilities.”
The Kyoto Protocol was adopted in Kyoto, Japan, on 11 December 1997 and entered into force on 16 February 2005. The detailed rules for the implementation of the Protocol were adopted at COP 7 in Marrakesh in 2001, and are called the “Marrakesh Accords.”
191 states have signed and ratified the Kyoto Protocol to the United Nations Framework Convention on Climate Change. The United States is the only major emitter country that has signed but not ratified the protocol.
Flexibility in meeting targets
Emission targets for industrialized country Parties to the Kyoto Protocol are expressed as levels of allowed emissions, or “assigned amounts”, over the 2008-2012 commitment period. Such assigned amounts are denominated in tonnes (of CO2 equivalent emissions). Industrialized countries must first and foremost take domestic action against climate change, but the Protocol allows them a certain degree of flexibility in meeting their emission reduction commitments through three innovative market-based mechanisms.
The Kyoto Mechanisms
The three Kyoto mechanisms are: Emissions Trading, known as “the carbon market”; the Clean Development Mechanism (CDM); and Joint Implementation (JI). The carbon market spawned by these mechanisms is a key tool in reducing emissions worldwide. It was worth 30 billion USD in 2006 and is set to increase.
JI and CDM are the two project-based mechanisms that feed the carbon market. JI enables industrialized countries to carry out joint implementation projects with other developed countries (usually countries with economies in transition), while the CDM involves investment in sustainable development projects that reduce emissions in developing countries.
Since the beginning of 2006, the estimated potential of emission reductions to be delivered by the CDM pipeline has grown dramatically to 2.9 billion tonnes of CO2 equivalent – approximately the combined emissions of Australia, Germany, and the United Kingdom. As of 2021, more than 7000 CDM projects have been registered.
What happened in Copenhagen?
The 15th Conference of the Parties in Copenhagen, Denmark (December 2009) was supposed to bring clarity on how countries would agree to pursue emission reductions after 2012. Instead, COP 15 produced a non-binding document, known as The Copenhagen Accord. It recognizes "the scientific view that the increase in global temperature should be below 2 degrees Celsius" although it calls for "an assessment of the implementation of this Accord to be completed by 2015. This would include consideration of strengthening the long-term goal," for example, to limit temperature rises to 1.5 degrees. No quantified emission reduction goals are included.
Check out this image regarding the Copenhagen conference: Brokenhagen.
Self-check
Think about your position on what the US should do in the next round of policy negotiations. Do you think the US should commit to more stringent emission reductions than currently proposed by the president (<20%)? Do you think China needs to set a positive example before the US commits to a new treaty? Should developing countries have a right to develop (and emit) just as the industrialized countries did?
The Current Climate Change Debate: “Climategate” and More

Penn State University houses one of the most prominent climate scientists: Dr. Michael Mann. He is most famous (and contested) for the “hockey stick,” a reconstruction of Northern Hemisphere temperatures that shows a sharp increase in the last 100 years, resembling the blade of a hockey stick.
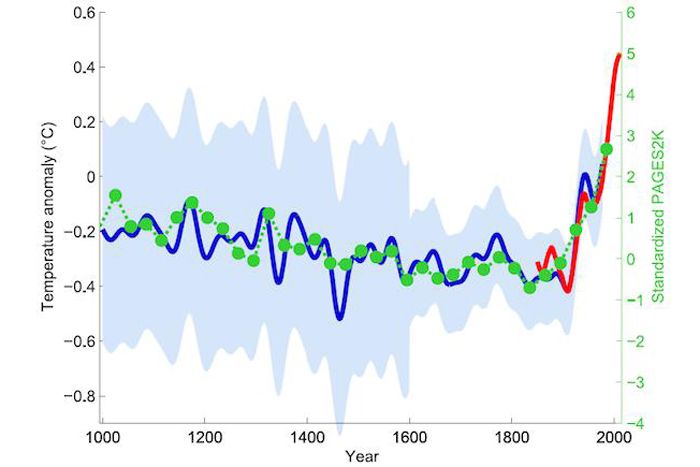
Consider This: Debates on Climate Change
Explore RealClimate to understand what the debate is all about. Another source to get a general impression on the types of topics that come up in climage change debates is How to Talk to a Climate Sceptic. This site presents common points of skepticism in the climate change debates, and responses to them.
Self-check
On your own, provide a 2 paragraph summary – in your own words – of what you have learned from the above reading.
Optional Reading Assignment
Back in November of 2009, hundreds of private emails between some of the world's leading climate scientists on climate change at the University of East Anglia's Climate Research Unit were leaked to the media and caused quite a controversy. Climate change skeptics argued that these emails provided the proof that climate scientists had manipulated data to support thier belief that climate change is real, and is caused by human actions. For a more comprensive view on what actually happened, check out the following article: http://www.realclimate.org/index.php/archives/2009/11/the-cru-hack.
Summary
Summary
Human activity is causing the global climate system to change. The main activity causing climate change is the burning of fossil fuels, which releases greenhouse gases into the atmosphere. Climate changes are already having significant impacts to both environmental systems and human systems, and even larger impacts are expected in the future. Unfortunately, the impacts are predominantly negative. For this reason, people are responding to climate change by adapting to the changes (adaptation) and by reducing greenhouse gas emissions (mitigation). Mitigation is important but difficult given how many human activities emit greenhouse gases. Indeed, greenhouse gas emissions are closely tied to a large portion of human development, in particular industrial activity and much of agriculture. Mitigation is also difficult given that it is a collective action problem at the global scale. Global collective action on climate change is attempted, mainly via treaty negotiations organized by the United Nations. However, these attempts have been largely unsuccessful thus far. Much work remains on mitigation as well as adaptation at all scales from the individual to the global.
Module 10 - Biodiversity
Introduction
About Module 10
Biodiversity is a measure of variation and richness of living organisms at a particular scale. In this module, we are going to learn some of the important roles that biodiversity plays in human systems. The module begins by explaining what biodiversity is, what causes biodiversity, and why we care about it. The module then discusses biodiversity loss throughout history and around the world today. Human activity is causing extensive and alarming biodiversity loss, with many species going extinct. But humans are also active in conserving biodiversity. The module closes with a discussion of threats to the extinction of one particularly noteworthy species: humans.
What will we learn in Module 10?
By the end of Module 10, you should be able to:
- define biodiversity and explain the value of biodiversity in both ecocentric and anthropocentric terms;
- describe geographic trends in biodiversity, including factors that influence biodiversity and biodiversity hotspots;
- discuss how changes in biodiversity are influenced by processes at many spatial and temporal scales;
- describe problems associated with biodiversity loss, as well as progress in protecting biodiversity.
What is due for Module 10?
There are two reading assignments and a Written Assignment associated with Module 10.
| Requirement | Location | Submitting Your Work |
|---|---|---|
| Reading Assignment: Conservation Triage | Threats to Biodiversity | No submission |
| Reading Assignment: Colony Collapse Disorder | Biodiversity and Ecosystem Resilience | No submission |
| Written Assignment 6: Biodiversity | Written Assignments | Submit in Canvas |
| Quiz 3 | Modules | Submit in Canvas |
Questions?
If you have any questions, please post them to our Course Q & A discussion forum in Canvas. I will check that discussion forum often to respond. While you are there, feel free to post your own responses if you, too, are able to help out a classmate. If you have a more specific concern, please send me a message through Inbox in Canvas.
What is Biodiversity?
What is Biodiversity?
“The most wonderful mystery of life may well be the means by which it created so much diversity from so little physical matter. The biosphere, all organisms combined, makes up only about one part in ten billion of the earth’s mass. It is sparsely distributed through a kilometer-thick layer of soil, water, and air stretched over a half billion square kilometers of the surface.”
The variety of life on Earth is immense and wondrous, as this quote by famed ecologist E.O. Wilson suggests. About two million species have been described by scientists. On an average day, about 300 new species are documented. Some scientists estimate that there are as many as 50 million species alive in the world today.
Biodiversity is a measure of variation and richness of living organisms at a particular scale. It can be measured on an extremely small scale, such as the number of organisms living in a spoonful of soil, or on a large scale, such as the whole earth. Biodiversity can also be thought of on several levels of biological variation, ranging from genetic diversity within a species to species richness within whole biomes. The biodiversity of a particular place, region, or landscape is influenced by climate, topography, and geologic history, as well human and non-human disturbances.
Why biodiversity matters
Humans have many reasons to value biodiversity, including anthropocentric reasons and ecocentric reasons.
Anthropocentric reasons to value biodiversity include the many potentials for different lifeforms to provide scientific information, recreational benefits, medicine, food, or other materials that are useful to us. Even if we don’t know what exactly some species or ecological community might be useful for, we may choose to protect it, just in case it turns out to be useful.
Ecosystem services are the services that ecosystems perform for humanity. They are a popular way of characterizing the variety of anthropocentric values surrounding parts of nature, including biodiversity. Animals, plants, and other components of every ecosystem do many things for humans such as purifying water and air, pollinating crops, maintaining a proper heat balance in the atmosphere, and cycling critical nutrients.
When we speak of these natural processes as ecosystem services, often we are imagining them in an economic context. For example, we might consider how much it would cost for flood control and soil erosion prevention if the vegetation in a particular region wasn’t providing the “services” of absorbing much of the rainfall, slowing down runoff, and holding the soil in place with its roots. In the case of biodiversity, one team of researchers from Minnesota recently showed that prairies with high species richness are more drought-resistant than those with fewer species. In many cases, high biodiversity enables a region to be more resilient and to continue providing important basic “ecosystem services.”
Ecocentric reasons to value biodiversity are based on the idea of biodiversity having intrinsic value irrespective of any potential human uses (refer back to Module 3 for a refresher). An ecocentric perspective on valuing biodiversity would include conserving coral reefs or redwood forests on the basis that these ecosystems have a right to exist, irrespective of how, if at all, they might benefit human society.
Given the value of biodiversity, its protection has become a primary conservation concern during the past several decades. As you work through this module, consider whether you think that anthropocentric or ecocentric arguments are more likely to be successful in conserving biodiversity. What are the strengths and weaknesses of each? What type of argument would you construct if you wanted to save a particular species or protect a natural area?
Conserving biodiversity is the main issue driving the rapid growth of protected areas around the world, places like biosphere reserves, national parks, and wildlife refuges. Sometimes protected areas are developed to protect one particular species, or to keep certain types of habitat intact. Learning about protected areas is important not only because they are important for protecting biodiversity, but also because these areas are often laboratories for studying human-environmental change. These are the sites where new ideas about environmental management are tried out, where mistakes are made, and where lessons are learned about how to balance the needs of humans with the values of biodiversity.
What factors influence biodiversity?
Biodiversity is heavily influenced by both human and non-human factors. Throughout the module, we will spend a significant amount of time studying the negative impacts of humans on biodiversity. However, it’s important to remember that humans have a very complicated relationship with biodiversity. In some cases, human activities enhance biodiversity through habitat modification or periodic disturbance. In others, certain types of biodiversity are favored over others because of human influences. For these and other reasons, it is helpful to always think of biodiversity as part of a human-environment coupled system.
Biodiversity varies significantly among different regions. Polar icecaps and tropical deserts are almost devoid of life, while tropical rainforests and coral reefs are extremely biodiverse. A forest in the mid-latitudes, in places like Pennsylvania, might have 30-40 tree species per square kilometer, whereas a square kilometer of tropical rainforest in Borneo or Ecuador might have 300-400 species.
Geographers, ecologists, and conservation biologists have learned a great deal about the patterns of biodiversity around the planet. One pattern that’s important to recognize for our purposes is that the number of species is much higher near the equator and decreases as you move toward the poles. This is known as the latitudinal gradient of species richness and is largely shaped by the availability of energy and water in each respective region. This general pattern is apparent on every continent of the world. It may also exist in the oceans, although researchers have not yet collected enough data about oceanic biodiversity.
On a smaller scale, other factors have a significant influence as well. Factors that seem to foster an increase in biodiversity include:
Physically diverse habitats. If a region has a variety of different “microclimates” caused by variability in topography, water availability, and sunlight, it’s likely to have more biodiversity than a more uniform landscape.
Moderate disturbance. Disturbances include weather or geological events, fires, or insect outbreaks. If disturbances are too extreme, such as a volcanic eruption that kills all the vegetation in a region, then biodiversity is reduced, but a moderate amount of disturbance helps create a variety of habitats and fosters evolution. Humans practicing slash-and-burn agriculture in a tropical rainforest can create this type of moderate disturbance in some cases.
Large area. Regions that are a part of a large, connected land mass are likely to have higher biodiversity than those that are geographically isolated. Small islands that are far away from the mainland of a continent will have fewer species than large islands that are near the coast.
Longevity of system. If a particular region has been spared from extreme disturbance events like being covered by glaciers or volcanic ash, or being clear-cut or plowed by humans, it is likely to have a higher level of biodiversity. This is true even on a very long time-scale. For example, there are 85% more coral species in the Pacific Ocean than in the Atlantic Ocean, because the Pacific is a much older ocean basin.
So, if you are in a continental region of the world that receives a lot of sunlight and rainfall and is buffered from extreme disturbance events, you can expect it to be highly biodiverse. On the other hand, in isolated regions or those with low water or sunlight availability, or those that are subject to frequent extreme disturbance, you’ll likely find quite a bit fewer species.
One goal of this overview is to emphasize how important the concept of scale is to understanding and studying biodiversity. It’s important to both think about biodiversity on a very large scale, such as a biome or continent, and on a very small scale, such as a farmer’s field or a particular section of a stream. Understanding the factors that shape biodiversity on these different scales is quite challenging but also incredibly interesting and important.
Biodiversity Hotspots
Biodiversity Hotspots
A biodiversity hotspot is a region with a high amount of biodiversity that experiences habitat loss by human activity. In order to qualify as a biodiversity hotspot, according to Conservation International, “a region must contain at least 1,500 species of vascular plants (>0.5% of the world’s total) as endemics, and it has to have lost at least 70% of its original habitat.” Today, 34 hotspots have been identified around the world. While these areas once covered about 16% of the Earth’s land surface, today 86% of their habitat has been destroyed. Even though now hotspots only cover about 2% of the land, 50% of the world's vascular plants and 42% of land vertebrates are endemic to a hotspot. To get a better understanding of the distribution of biodiversity hotspots around the world, please view the following biodiversity hotspots map produced by Conservation International.
The biodiversity hotspot concept highlights the coupledness of biodiversity and humanity. The concept, first suggested in 1988 by Norman Myers, arose from growing concern among ecologists and environmentalists about the rapid loss of habitat in areas of high biodiversity and endemism. Endemism means that a species only lives in a particular region of the world, which means that if it is wiped out there, it’s lost forever. For example, the now-extinct Dodo bird was endemic to Mauritius, a small island in the Indian Ocean.
One example of a hotspot is the Irano-Anatolian region, which forms the boundary between the ecosystems of the Mediterranean Sea and the plateaus of Western Asia and includes 2,500 endemic plants. Its original extent was about 900,000 square kilometers, stretching from Turkey to Turkmenistan and Iran, but today only about 135,000 square kilometers of original vegetation are left. The most significant threats to this hotspot are large-scale irrigation projects, overgrazing, and unsustainable timber harvesting. The human population has doubled in this region since the 1970s, so even traditional livestock grazing and wood-gathering practices have put increased pressure on the region’s resources. Huge areas of swamps have been drained and converted to growing sugar beets and other crops using industrial agricultural methods. The political instability of the region and active military conflicts also undermine conservation efforts.
A Historical Perspective on Biodiversity Loss
About 99.9% of species that have ever lived on earth are now extinct, but at the same time, there are likely more species alive during the current era in geological history than at any previous time. Why is this?
Since the first cellular life appeared about 3.8 billion years ago, new life forms have been constantly evolving and some species have been going extinct. Since life on Earth is so old, most of the species that have ever lived are now gone, even if they persisted for millions of years. There have been periods of biodiversity explosions, as well as periods of mass extinctions, but generally, the trend has been toward an increase in the variety of life forms on this planet. Speciation rates (the rates of new species coming into existence) are high following mass extinction events and have been increased by the evolution of body types that allow animals to inhabit all types of habitats like deserts, soils, thermal ocean vents, and the sky. Also, the breaking up of Pangaea into separate continents has fostered an explosion in the number of species on Earth.
We should realize that humans are not responsible for most of the extinctions that have happened on Earth. At the same time, humans have been influencing biodiversity for a long time, and human-caused extinctions are not a new thing at all.
Early Anthropogenic Extinctions
During the end of the last ice age (known as the Pleistocene), about 10,000 to 15,000 years ago, many of the large mammals, birds, and reptiles, collectively known as megafauna, went extinct in North and South America. Mastodons, mammoths, giant beavers, and saber-toothed tigers, along with many other species, disappeared in a fairly short period of geologic time.
While we do not have direct evidence of what caused their extinction, most researchers believe that overharvesting of wildlife by humans played a decisive role in many extinctions. The extinctions roughly coincide with the arrival of humans into the Americas, and a similar story is apparent in Australia, although human arrival there was much earlier.
It is important to note that during this period the climate was warming rapidly (due to natural, not human causes), and vegetation was changing as a result. Therefore, humans were not the only stress that may have damaged populations of these megafauna species. On the other hand, these species had persisted through significant climate fluctuations in the past, and the major new factor when they became extinct was the presence of humans.
Another striking example of human-caused biodiversity loss from before the modern era comes from Polynesia in the southern Pacific Ocean. Humans caused the extinction of over 2000 species of birds as they colonized these tropical islands between 1000 and 3000 years ago. Among the factors causing extinction were direct harvesting, habitat alteration, and the introduction of predators like pigs and rats. Flightless birds were particularly vulnerable to human and non-human hunters, and many of them went extinct.
One important lesson to draw from these two examples is that even people whom we identify as “native” or “indigenous” to a place can cause extinctions. It can be tempting to imagine that Western civilization, capitalism, or other “modern” ideas or technologies are the root cause of biodiversity loss, but that belief is not supported by this history. It is vital that we view indigenous peoples not as somehow “one with nature” or in perfect harmony with their ecosystems, but as dynamic and diverse human cultures that have long played important roles in shaping the landscapes that they inhabit. That said, there are valuable lessons that we can learn from indigenous cultures about how to maintain functioning ecosystems and biodiversity while providing for basic human needs.
European Colonialism
The above example of Polynesian colonialism was a precursor to the massive colonial efforts by European nations from the 1400s through the 1800s. European colonialism had massive impacts on biodiversity through the exchange of species between Europe and colonized regions, the conversion of habitat, and over-harvesting of species that led to extinction.
The transfer of plants, animals, and microbes between continents during this era is known as the “Columbian Exchange.” One of the most dramatic impacts of this exchange was the introduction of European diseases into Native American populations that had no immunities to them. These diseases caused declines in indigenous populations of up to 90% in some cases, crippling social systems and subsistence harvesting, altering long-established practices like burning and agriculture, and leading to large cities simply disappearing in many parts of the Americas. Because of these diseases, much of the interior regions of North and South America became much less populated than they had been for thousands of years.
The “hollowing out” of the interiors of these continents had a serious impact on the processes of colonial settlement, both in the past and today. In North America during the 1700s and 1800s, many European settlers interpreted the regions they were moving into as an “untouched wilderness,” when, in many cases, those areas had a long history of habitation and alteration by Native American groups.
In South America, the impacts of European diseases are perhaps even more evident today. We don’t have precise data on population levels in the Amazon River Basin prior to European settlement, but the best estimates are that about 10 million people lived in the region. There were cities, villages, and intensive agricultural areas, as was true of many other biologically rich places in the Western Hemisphere at that time. During the 1600s and 1700s, diseases brought by European explorers wiped out 90% of Amazon residents, leaving less than one million. During the subsequent centuries, descendants of the Spanish and Portuguese colonists have built large cities like Rio de Janeiro, Lima, and São Paulo along the coasts, while the population of the interior Amazon region remains low. The world map of population distribution below shows that South America remains a “hollow continent” today.
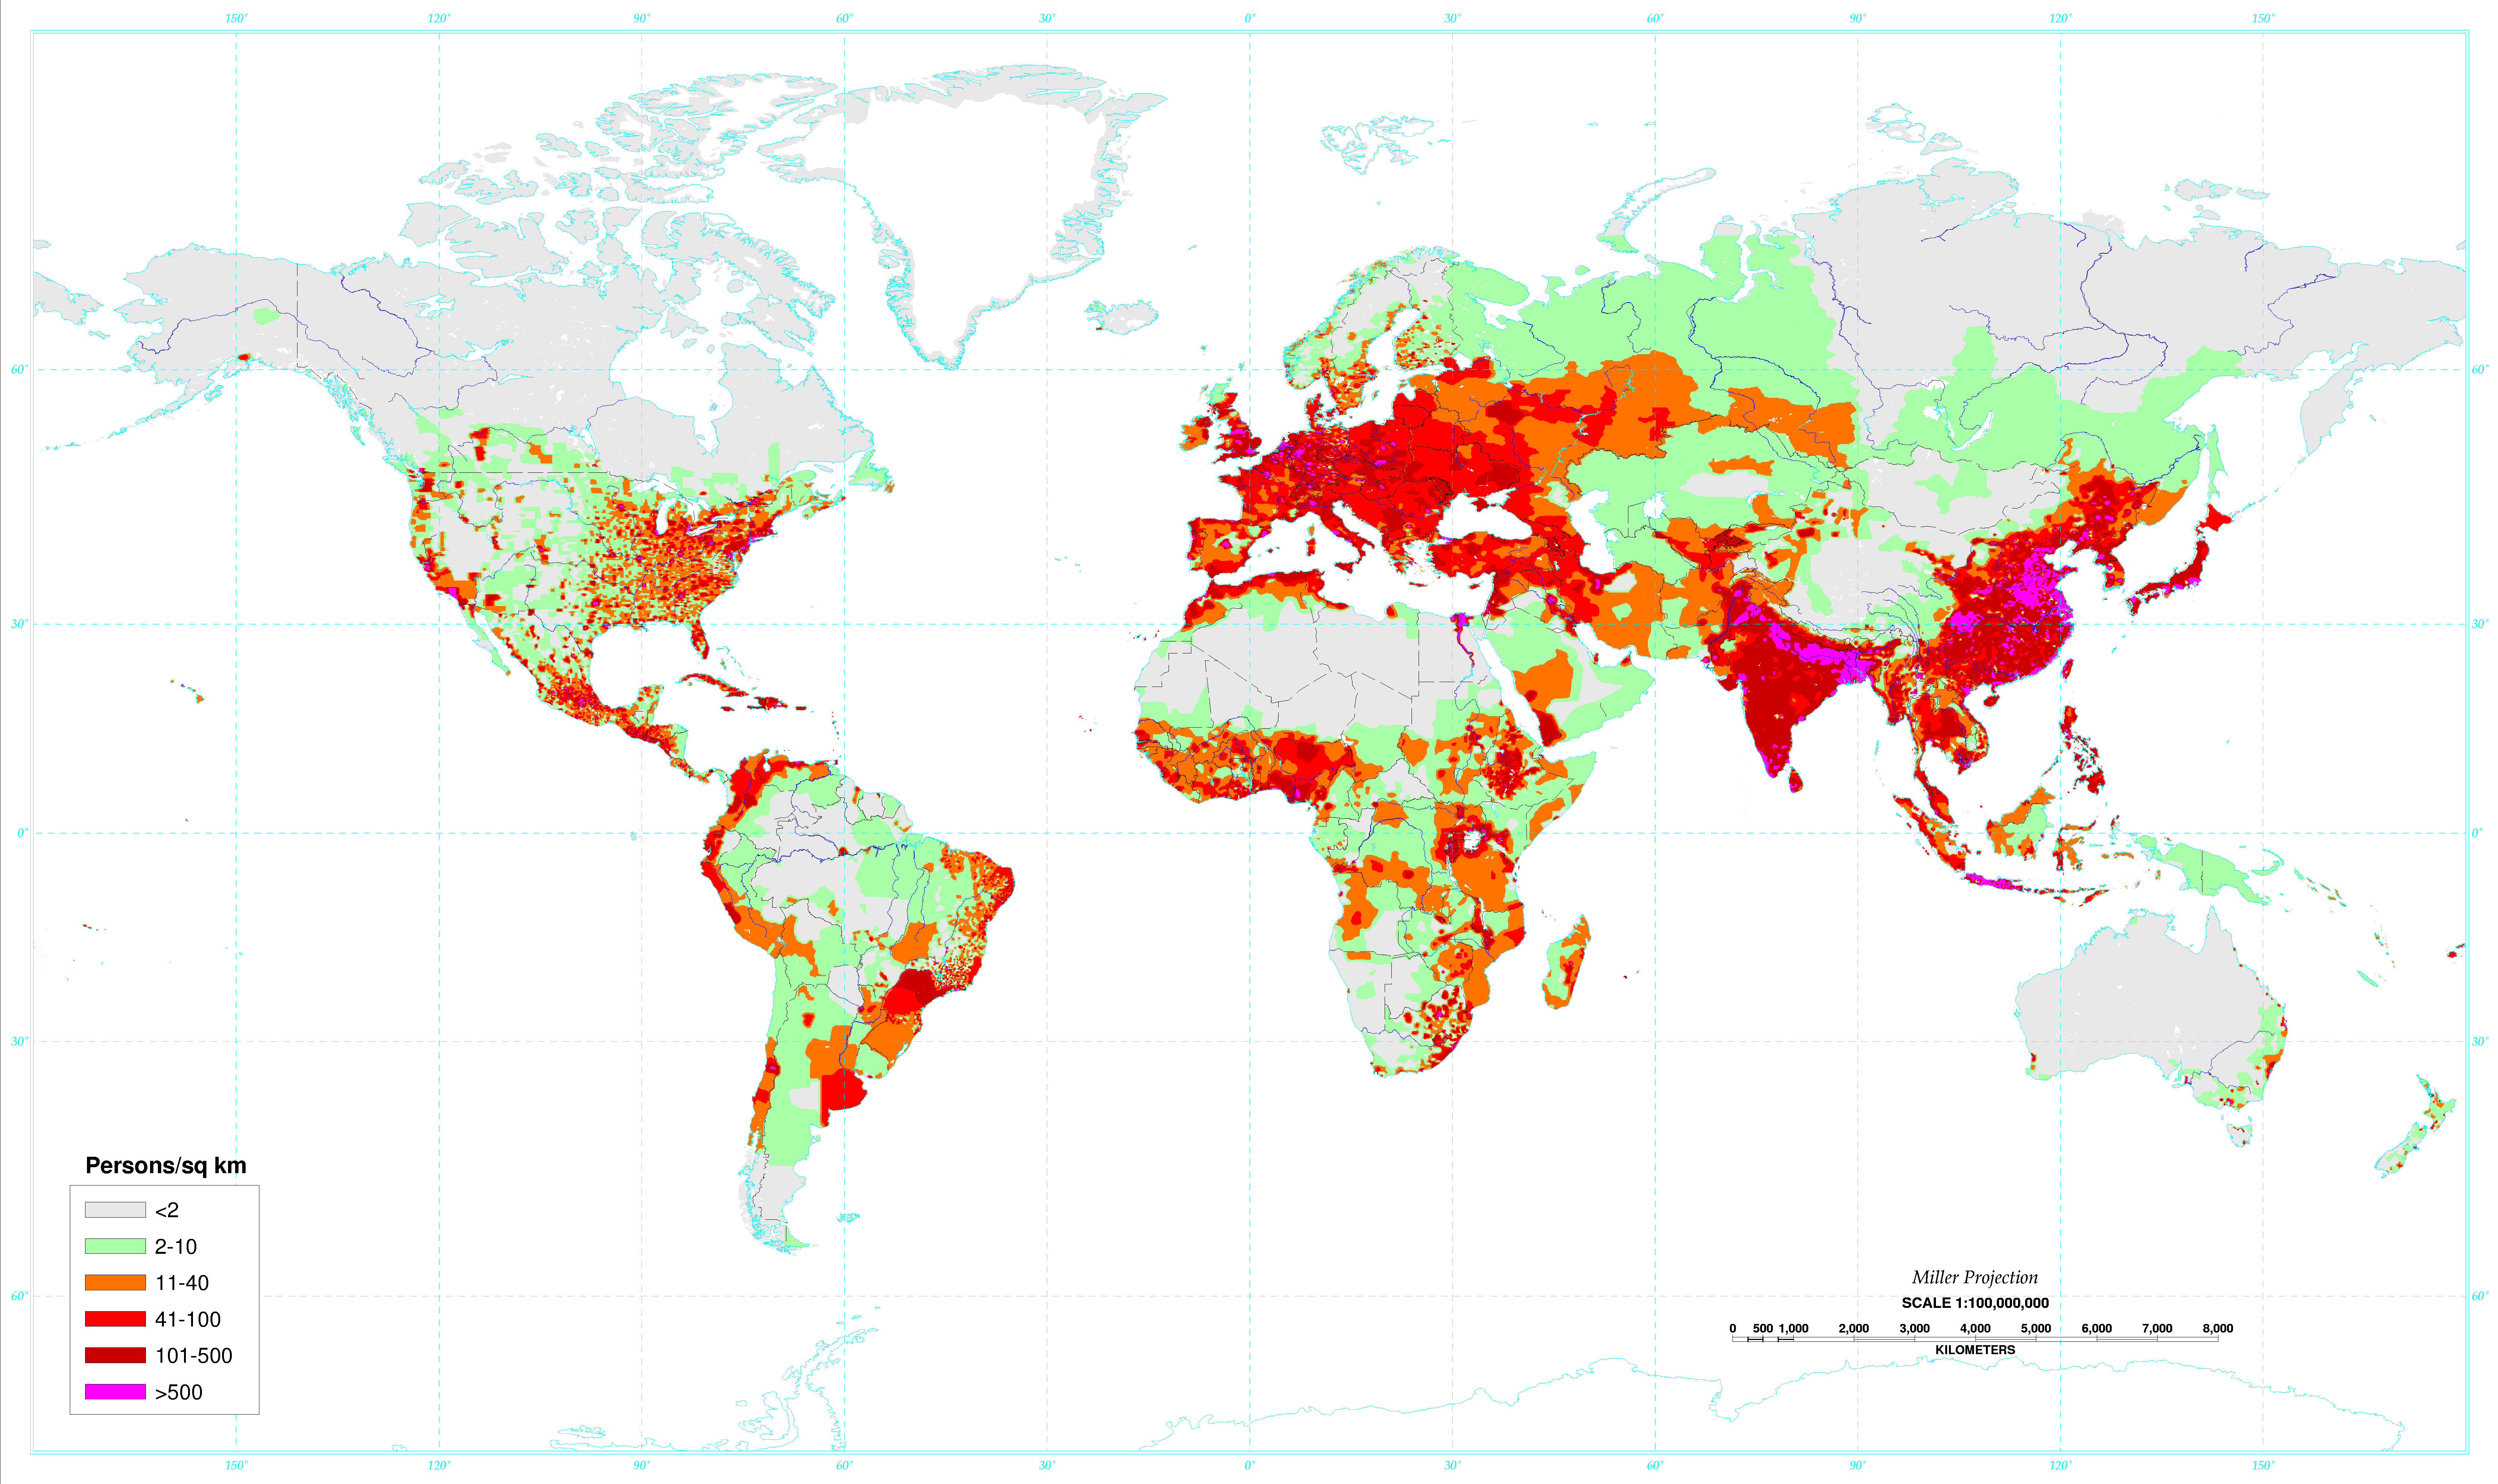
In this light, we should not think of the Amazon rainforest as a “virgin wilderness,” but rather as a long-humanized landscape that has only recently grown back into a wild state. Without the influence of European diseases, South America’s demographics and environments would look much different. This is a reminder that we can never ignore history when trying to understand complex human-environment systems.
European colonialism also led to habitat modifications on an unprecedented scale, which had serious negative impacts on biodiversity. One key example is deforestation in North America. Native Americans made noticeable alterations to the temperate forests of North America through burning the understory and clearing patches of forest to grow maize and other crops, but their modifications are eclipsed by the systematic destruction of forests by European colonists.
Consider This: Deforestation in the United States
Deforestation was driven largely by a desire for cleared agricultural land, but also by the needs of manufacturing industries. In Pennsylvania (literally “Penn’s Woods”), much of the forest was cleared and turned into charcoal to fuel iron furnaces. While today much of Pennsylvania has reforested, during the past 200 years almost every forest in the state has been cleared, some multiple times. While biodiversity has benefited from forest regrowth in many places in North America, often new forests do not have the same level of biodiversity as their predecessors, and some areas remain agricultural lands or urban developments with low levels of biodiversity.
Consider the map of the history of deforestation in the United States below. The map focuses on areas of “virgin forests,” otherwise known as old-growth or primary forest, and so it doesn’t show us where forests have grown back. Nevertheless, it’s useful because it mirrors a process that is going on today: the deforestation of the Amazon rainforest in South America. While many people in the U.S. bemoan the destruction of the Amazon today, that deforestation follows in the footsteps of the U.S., Europe, and other “developed” nations. We should be careful not to point fingers of blame at developing countries in the tropics as the main causes of deforestation because that would ignore our own history.
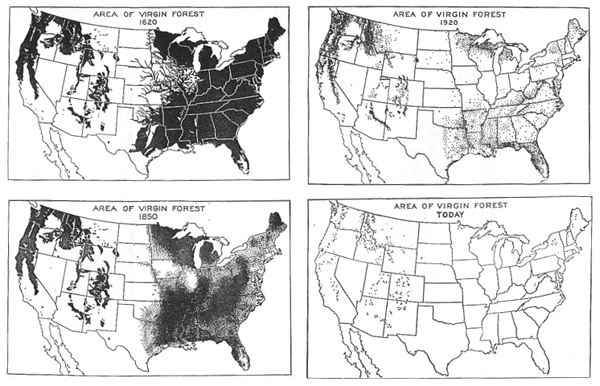
One of the most important lessons that we should learn from biodiversity hotspots is that biodiversity cannot be fully understood without considering factors like human population, agricultural techniques, military activities, and political systems. Biodiversity is entangled with human influences. At the same time, human economic, social, and political systems cannot be understood outside the context of the diverse life forms that support our existence.
Threats to Biodiversity
“Extinction is the most irreversible and tragic of all environmental calamities. With each plant and animal species that disappears, a precious part of creation is callously erased.” -Michael Soulé, noted American conservation biologist
It is estimated that the current rate of species extinction is between 1,000 and 100,000 times more rapid than the average rate during the last several billion years. The growth of human populations, consumption levels, and mobility is the root of most of the serious threats to biodiversity today.
While learning about the negative impacts of humans on biodiversity, please keep a few things in mind. First, it is rare that humans intend to make a species go extinct or to threaten biodiversity in some other way. Usually, those impacts are the unfortunate by-products of people trying to provide a decent living for themselves or to serve some other purpose. Second, in the last 30 years or so, efforts to protect and preserve biodiversity have expanded exponentially. We will explore those efforts later in the module. As you learn about the current threats to biodiversity, resist the temptation to conclude that humans are simply foolish or short-sighted or greedy, and instead consider the larger pressures and systems that lead toward biodiversity loss.
H.I.P.P.O.
There are many threats to biodiversity today. The biggest ones can be remembered by using the acronym H.I.P.P.O.: Habitat Loss, Invasive Species, Pollution, Human Population, and Overharvesting.
Habitat Loss
This occurs when a particular area is converted from usable to unusable habitat. Industrial activities, agriculture, aquaculture, mining, deforestation, and water extraction are all central causes of habitat loss. This includes deforestation for wood for cooking food. Habitat fragmentation, the loss of large units of habitat, is also a serious threat to biodiversity. The picture below shows an example of habitat fragmentation in the Amazon rainforest.
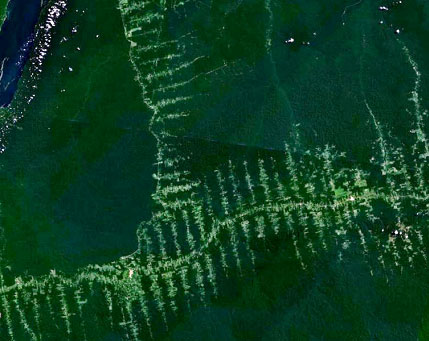
Invasive Species
When an animal, plant, or microbe moves into a new area, it can affect the resident species in several different ways. New species can parasitize or predate upon residents, hybridize with them, compete with them for food, bring unfamiliar diseases, modify habitats, or disrupt important interactions. One famous and striking example of an invasive species is the brown tree snake in Guam. Native to Australia, the snake was accidentally transported to Guam in ship cargo following World War II. Because Guam had basically no predators to keep the snake population in check, it rapidly multiplied and caused the extirpation of most of the resident bird species. Extirpation means extinction within a region: the species survives elsewhere, but not in that region.
Pollution
The discharge of toxic synthetic chemicals and heavy metals into the environment has a huge impact on species abundance and can lead to extinctions. It’s important to remember that substances that are “natural” can become pollution when they are too abundant in a certain area. For example, nitrogen and phosphorous are important nutrients for plant growth, but when they concentrate in water systems after being applied as agricultural fertilizers, they can cause “dead zones” that are uninhabitable for fish and other wildlife. Also, carbon dioxide is a “natural” component of the atmosphere but is considered a pollutant when emitted by human industrial activities.
Bioaccumulation is an important concept connected with pollution. This is the process of chemicals becoming increasingly concentrated in animal tissues as they move up the food chain. Killer whales provide an example of how bioaccumulation can be a serious problem for biodiversity, and especially for marine mammals. Many agricultural and industrial chemicals are persistent organic pollutants (POPs), which do not seem to cause biological damage at very low concentrations. However, these POPs are easily incorporated into organisms like bacteria, phytoplankton, and other invertebrates at the bottom of marine food chains. As those organisms are eaten by fish, and fish are eaten by marine mammals, the POPs move up the food chain. If a killer whale eats 100 king salmon, she incorporates all the POPs that were in those salmon into her body tissues, meaning that over time, the concentrations of POPs in her body can become quite high. At these higher concentrations, many POPs have been shown to cause disruptions to hormone levels and immune systems, and increase birth defects. Anything that eats high on the food chain (such as humans!) is at risk of impacts from bioaccumulation of toxins.
Human Population
In the year 1800, there were fewer than 1 billion people on Earth, and today there are about 8.1 billion. Even without the vast increases in per capita resource use that have occurred during this period, the pressures on biodiversity would have increased during this time period simply based on population growth. While the impacts that each human has on biodiversity varies widely depending on the types and amounts of resources that they use (remember the I=PAT equation!), overall, increasing populations have lead to increasing threats to biodiversity.
Overharvesting
This includes targeted hunting, gathering, or fishing for a particular species as well as incidental harvesting such as bycatch in ocean fisheries. The megafauna extinction example earlier was an example of overharvesting causing biodiversity loss.
Ocean fisheries have been particularly vulnerable to overharvesting during the post-WWII period because of technological developments like refrigeration, sonar, larger nets, and onboard processing. The cod fishery in the Northwestern Atlantic Ocean was an important commercial fishery for hundreds of years, but only a few decades of intense harvesting using these new technologies in the late twentieth century led to a population collapse. The population declined by over 90%, and fishing for the species was closed in both Canada and the United States. The loss of a top predator like cod, along with reductions of other top predator fish populations like haddock and flounder, has led to an explosion in prey fish populations like herring, capelin and shrimp. Cod populations have not recovered, despite fishing pressures ceasing, and this observation has made researchers speculate that the ecosystem may now be in an alternative stable state that will prevent the recovery of cod populations any time in the near future.
Interactions among drivers of biodiversity loss
As explained above, in most places, more than one of these factors is having an impact on biodiversity. It often requires a closer look at a particular place to understand the interplay between habitat loss, invasive species, human population, pollution, overharvesting, and other factors that affect biodiversity. For example, an increasing human population with high meat-consumption patterns and loose environmental regulations may increase deforestation rates for agriculture and cattle grazing, resulting in habitat loss and nitrogen pollution from synthetic fertilizers. Arguably, human population is not a driver of biodiversity loss in and of itself, but it tends to intensify and interact with other drivers.
Climate Change & Biodiversity Loss
In Module 9, we saw that climate change is impacting ecosystems in several ways, including via temperature shifts. These shifts are making it difficult or even impossible for many species to survive. As the climate changes more and more, biodiversity will face ever greater threats. Likewise, efforts to conserve biodiversity will face ever greater challenges. Indeed, some are starting to speak about conservation triage as a situation in which not all species can be saved, forcing conservationists to decide which species to protect. This use of the term triage is adapted from its use in medical crises, such as in emergency response to natural disasters.
Reading Assignment: Conservation Triage
Please read the article Climate change turns conservationists into triage doctors, written by Sharon Oosthoek for the Canadian Broadcasting Corporation. The CBC is Canada's national public media organization, analogous to the Public Broadcasting Service in the United States. This article describes the desperate situation that biodiversity conservationists are finding themselves in given the stresses that climate change is putting on ecosystems. As you read this article, consider the following questions:
1) How does conservation triage as described in the article compare to medical triage conducted in emergency response to natural disasters?
2) How would you decide which species to protect in a conservation triage scenario?
3) What are the implications of the conservation triage scenario to decisions about reducing greenhouse gas emissions?
Case Study: The Amazon Rainforest
Case Study: The Amazon Rainforest
The Amazon in context
Tropical rainforests are often considered to be the “cradles of biodiversity.” Though they cover only about 6% of the Earth’s land surface, they are home to over 50% of global biodiversity. Rainforests also take in massive amounts of carbon dioxide and release oxygen through photosynthesis, which has also given them the nickname “lungs of the planet.” They also store very large amounts of carbon, and so cutting and burning their biomass contributes to global climate change. Many modern medicines are derived from rainforest plants, and several very important food crops originated in the rainforest, including bananas, mangos, chocolate, coffee, and sugar cane.
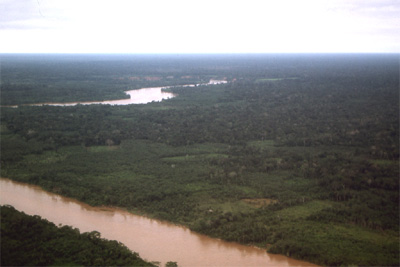
In order to qualify as a tropical rainforest, an area must receive over 250 centimeters of rainfall each year and have an average temperature above 24 degrees centigrade, as well as never experience frosts. The Amazon rainforest in South America is the largest in the world. The second largest is the Congo in central Africa, and other important rainforests can be found in Central America, the Caribbean, and Southeast Asia. Brazil contains about 40% of the world’s remaining tropical rainforest. Its rainforest covers an area of land about 2/3 the size of the continental United States.
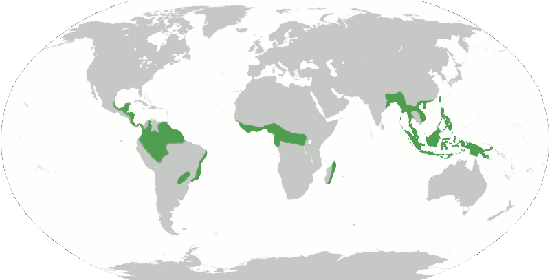
There are countless reasons, both anthropocentric and ecocentric, to value rainforests. But they are one of the most threatened types of ecosystems in the world today. It’s somewhat difficult to estimate how quickly rainforests are being cut down, but estimates range from between 50,000 and 170,000 square kilometers per year. Even the most conservative estimates project that if we keep cutting down rainforests as we are today, within about 100 years there will be none left.
How does a rainforest work?
Rainforests are incredibly complex ecosystems, but understanding a few basics about their ecology will help us understand why clear-cutting and fragmentation are such destructive activities for rainforest biodiversity.
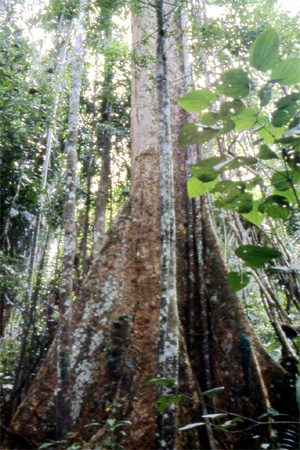
High biodiversity in tropical rainforests means that the interrelationships between organisms are very complex. A single tree may house more than 40 different ant species, each of which has a different ecological function and may alter the habitat in distinct and important ways. Ecologists debate about whether systems that have high biodiversity are stable and resilient, like a spider web composed of many strong individual strands, or fragile, like a house of cards. Both metaphors are likely appropriate in some cases. One thing we can be certain of is that it is very difficult in a rainforest system, as in most other ecosystems, to affect just one type of organism. Also, clear cutting one small area may damage hundreds or thousands of established species interactions that reach beyond the cleared area.
Pollination is a challenge for rainforest trees because there are so many different species, unlike forests in the temperate regions that are often dominated by less than a dozen tree species. One solution is for individual trees to grow close together, making pollination simpler, but this can make that species vulnerable to extinction if the one area where it lives is clear cut. Another strategy is to develop a mutualistic relationship with a long-distance pollinator, like a specific bee or hummingbird species. These pollinators develop mental maps of where each tree of a particular species is located and then travel between them on a sort of “trap-line” that allows trees to pollinate each other. One problem is that if a forest is fragmented then these trap-line connections can be disrupted, and so trees can fail to be pollinated and reproduce even if they haven’t been cut.
The quality of rainforest soils is perhaps the most surprising aspect of their ecology. We might expect a lush rainforest to grow from incredibly rich, fertile soils, but actually, the opposite is true. While some rainforest soils that are derived from volcanic ash or from river deposits can be quite fertile, generally rainforest soils are very poor in nutrients and organic matter. Rainforests hold most of their nutrients in their live vegetation, not in the soil. Their soils do not maintain nutrients very well either, which means that existing nutrients quickly “leech” out, being carried away by water as it percolates through the soil. Also, soils in rainforests tend to be acidic, which means that it’s difficult for plants to access even the few existing nutrients. The section on slash and burn agriculture in the previous module describes some of the challenges that farmers face when they attempt to grow crops on tropical rainforest soils, but perhaps the most important lesson is that once a rainforest is cut down and cleared away, very little fertility is left to help a forest regrow.
What is driving deforestation in the Amazon?
Many factors contribute to tropical deforestation, but consider this typical set of circumstances and processes that result in rapid and unsustainable rates of deforestation. This story fits well with the historical experience of Brazil and other countries with territory in the Amazon Basin.
Population growth and poverty encourage poor farmers to clear new areas of rainforest, and their efforts are further exacerbated by government policies that permit landless peasants to establish legal title to land that they have cleared.
At the same time, international lending institutions like the World Bank provide money to the national government for large-scale projects like mining, construction of dams, new roads, and other infrastructure that directly reduces the forest or makes it easier for farmers to access new areas to clear.
The activities most often encouraging new road development are timber harvesting and mining. Loggers cut out the best timber for domestic use or export, and in the process knock over many other less valuable trees. Those trees are eventually cleared and used for wood pulp, or burned, and the area is converted into cattle pastures. After a few years, the vegetation is sufficiently degraded to make it not profitable to raise cattle, and the land is sold to poor farmers seeking out a subsistence living.
Regardless of how poor farmers get their land, they often are only able to gain a few years of decent crop yields before the poor quality of the soil overwhelms their efforts, and then they are forced to move on to another plot of land. Small-scale farmers also hunt for meat in the remaining fragmented forest areas, which reduces the biodiversity in those areas as well.
Another important factor not mentioned in the scenario above is the clearing of rainforest for industrial agriculture plantations of bananas, pineapples, and sugar cane. These crops are primarily grown for export, and so an additional driver to consider is consumer demand for these crops in countries like the United States.
These cycles of land use, which are driven by poverty and population growth as well as government policies, have led to the rapid loss of tropical rainforests. What is lost in many cases is not simply biodiversity, but also valuable renewable resources that could sustain many generations of humans to come. Efforts to protect rainforests and other areas of high biodiversity is the topic of the next section.
Globalization of Biodiversity Concerns
Globalization of Biodiversity Concerns
The realization that global biodiversity is seriously threatened by human activities emerged as a primary international concern in the 1970s, although the history of human efforts to protect rare species is much older.
National Parks and Biodiversity Conservation
In the United States, efforts were made to prevent the extinction of the American bison at the end of the 1800s. Yellowstone National Park, the first national park in the world, was established in 1872, and it provided habitat to the only wild bison herd during that era. In 1900, the U.S. federal government passed the Lacey Act, which forbade interstate commerce in illegally harvested animals or their body parts, and likely helped prevent the extermination of snowy egrets and other birds that were being harvested for their feathers.
The national park system in the United States grew rapidly during the late 1800s and early 1900s. Its model for protecting nature was to draw a boundary around a particular area and restrict human uses within it. Most early parks were focused on places with geological, not biological, wonders, so they weren’t especially good at protecting biodiversity, but they established an important model for nature protection.
With adequate enforcement, the national park model can be very effective for conserving biodiversity, but it also raises questions of social justice. Even during the 1800s when the first parks were established, local residents complained about lost access to resources because of the restrictions that parks imposed. Among those most disenfranchised were Native American groups, such as the Blackfeet of Montana who lived within today’s Glacier National Park; they were told they were no longer allowed to do traditional hunting, fishing, and gathering within the park boundaries. Despite the social injustices that were a part of the U.S. national park movement, this model of nature conservation was adopted by many European nations that established national parks in their African colonies. Below, you will learn about efforts to balance biodiversity protection in key areas with the needs of humans who live nearby, and those efforts stem from social justice concerns about the original “fortress” model for nature conservation exemplified by national parks.
These early efforts were quite minimal compared to the global boom in protected areas since the 1960s. Today, there are over 100,000 individual protected areas that cover about 12% of the Earth’s total land surface. Over half of this area was protected just in the last decade.
Within the field of geography, particularly in a subfield called political ecology, there has been a lot of research in protected areas on the issue of balancing biodiversity protection with human needs. Political ecologists have looked at the political and economic interests of humans in protected areas, and how those interests relate to biodiversity and other ecological processes. The establishment of a new protected area invokes social justice concerns about the way that the fortress model of conservation displaces local people from their land and resources. At the same time, some parks have been operational for over 100 years and have their own unique set of political and ecological issues. An example can be seen in Yosemite National Park, where park visitation levels have become so high that efforts are underway by park managers to establish a park “capacity” for visitation to certain parts of the park with the goal of limiting human impacts on ecological processes (recall the “carrying capacity” concept from Module 2). As visitation to protected areas increases, the interface between environmental protection and levels of visitation becomes increasingly complex, and innovative management strategies are required to meet the given objective of a protected area.
IUCN Protected Area Categories
It’s important to remember, however, that protected areas receive very different levels of protection, and may have many more purposes than simply protecting biodiversity. The International Union for the Conservation of Nature (IUCN) has identified six different levels of protected areas:
Category 1: Strict Nature Reserves. These areas restrict motorized vehicles and extractive uses. They may be open to indigenous people for traditional gathering and hunting, but, in most cases, the only human activities are scientific research and monitoring and low-impact recreation. The federal wilderness system in the United States, established in 1964, is an example of this kind of reserve.
Category 2: National Parks. These are areas intended to balance ecosystem protection with human recreation, which is often a very difficult mandate for the managing agency to achieve. Extractive uses in these areas are prohibited. Many national parks, such as Tubbataha National Park in the Philippines, are sources of ecotourism income as well as breeding grounds for commercially important species. One problem with national parks in many developing countries is that there is little or no enforcement of regulations. One study showed that only 1% of parks in Africa and Latin America have adequate enforcement. We might think of these as “paper parks” that exist on a map but, in reality, are not protected.
Category 3: Natural Monuments. Protecting interesting natural or cultural features is the goal in these areas, but they are smaller than the areas in the two previous categories.
Category 4: Habitat/Species Management Areas. These are areas that are relatively heavily utilized by humans for agriculture or forestry but have been designated as important habitats for a particular species or natural community. Management plans and continual monitoring are important components to ensure that conservation goals are achieved.
Category 5: Protected Landscape/Seascape. These areas are intended to protect historically important interactions between people and nature. Examples include traditional farming areas, homelands of indigenous peoples, and significant religious landscapes. Endemic and rare species in these regions are often best protected by maintaining the traditional human land uses that have existed alongside them for many generations.
Category 6: Managed Resource Protected Area. Similar to Category 5, these areas are managed for the long-term sustainable use by humans. In the Ngorongoro Crater Conservation Area in northern Tanzania, Masai pastoralists graze cattle on most of the land while living alongside Africa’s largest concentrations of megafauna.
One system of protected areas that has become particularly important for conserving biodiversity is “Biosphere Reserves.” In 1971, The United Nations’ Educational, Social and Cultural Organization (UNESCO) started the Man and the Biosphere Programme. Its major focus has been building a network of biosphere reserves. There are over 400 reserves in almost 100 countries today. Each reserve has to be large enough to contain three different “zones”: (1) a core area where the national government restricts essentially all human activities except scientific monitoring and research, (2) a buffer zone where tourist recreation and local resident usage for agriculture, sustainable logging, grazing, hunting, and fishing are allowed, as long as they don’t threaten the core area, and (3) a transition zone where more intensive uses of land are permitted. This model seeks to balance the needs of humans and the biosphere, as its name implies.
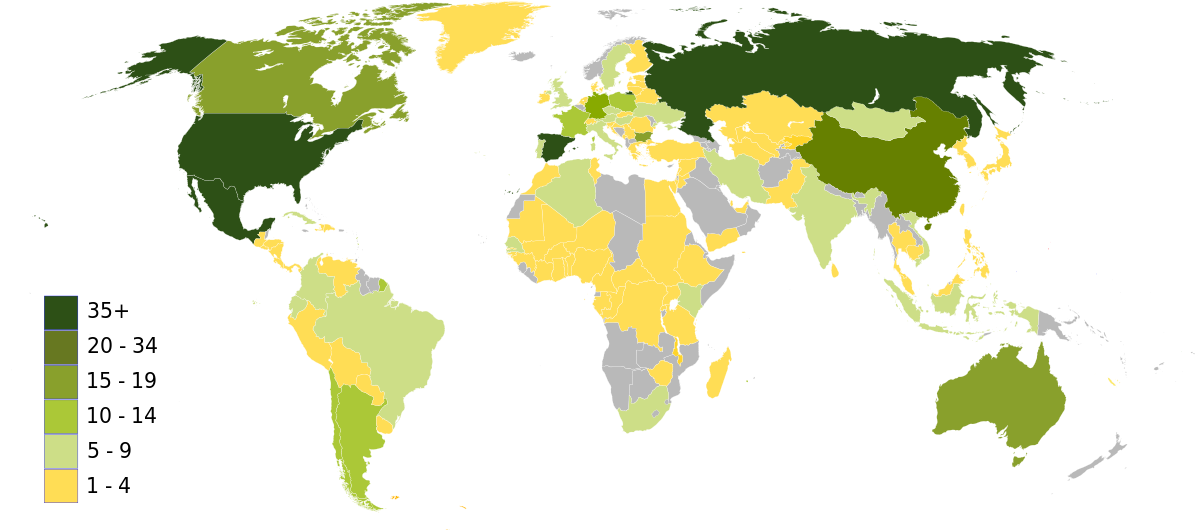
If you were designing a set of protected areas with the goal of preserving biodiversity, here are a few concepts that you would want to keep in mind:
Comprehensiveness: Include samples of different types of habitats and ecological processes.
Representativeness: It’s unlikely that you will be able to preserve much of each habitat type, so protect an area that is representative of the ecological processes contained within it.
Risk Spreading: Natural disasters, wars, or other disturbances can harm even the most well-protected areas, so it may be wise to not have all of your reserves connected and nearby each other.
Connectivity: On the other hand, maintaining connections between protected areas is very important for several reasons, including the dispersal of genetic material, the ability for migrating and wide-ranging species to persist, and the possibility for species to adapt to climate changes or adjust their ranges after disturbance events.
Examples of Biodiversity Conservation Practices
Of course, creating a theoretical set of protected areas is much easier than doing it in the real world, but here are several examples of how these ideas are being implemented or advocated for in different parts of the world.
Costa Rica is perhaps the best example of a biodiversity-rich country making a commitment to protecting its natural endowments. While it is a small country, about the size of West Virginia, it is home to about 500,000 plant and animal species. Though Costa Rica experienced very serious deforestation driven by cattle ranching during the 1960s and 1970s, it has worked for the last 30 years to protect about 25% of its land in national parks and other forms of reserves. The protected areas are designed to ensure the survival of at least 80% of Costa Rica’s remaining biodiversity. Efforts have been made to facilitate connectivity between reserves and to ensure that they are as representative as possible. Beyond the reserves, the Costa Rican government has also halted subsidies that encourage forest clearing and has encouraged investment in ecotourism. Today, tourism is the largest industry in Costa Rica, and is very substantially focused on activities within and surrounding these reserves. Tourism has become so popular that the Costa Rican government and conservation biologists are now concerned about the impacts that so many visitors are having on the country’s biodiversity. Nevertheless, Costa Rica remains an example of the benefits that protected areas can have for biodiversity and local economies.

Connectivity between reserves is often necessary on a larger than national scale, and that was the goal of advocates for the “Paseo Pantera” (Panther Path) in Central America. Now known as the “Mesoamerican Biological Corridor,” this system of protected areas and corridors stretches from Mexico to Panama.
The Rewilding Institute advocates for the creation of large-scale connectivity between important ecosystems in North and Central America, focusing on the necessity for large carnivores like wolves, mountain lions, and grizzly bears to travel the long distances they require.

The primary goal of all of these corridor-based projects is to ensure landscape permeability, which means that even if a particular place is not designated as a protected area, wildlife is able to use the habitat and to travel freely through it. Elements that ensure landscape permeability include laws that regulate or restrict wildlife hunting or trapping, designing roads and railroads so that animals can cross safely, and establishing relationships between government wildlife agencies and local communities so that everyone feels that they benefit from protecting the biological integrity of the region.
Biodiversity and Ecosystem Resilience
Biodiversity and Ecosystem Resilience
Ecosystems involve many complex interactions between members of different species. These interactions often create negative feedback loops, keeping the ecosystem in approximately the same state. For example, if the population of a certain type of plant starts to grow, then the population of an animal that eats this plant may also start to grow, thereby lowering the population of the plant. Ecosystems contain many interactions like this. These interactions are crucial to understanding the importance of individual species in biodiversity.
Suppose the animal species described above goes extinct, perhaps because of human hunting. This destroys the negative feedback loop. When the plant population grows, there is nothing to stop it from continuing to grow. The plant may then deplete resources that are crucial for a different species, which then starts to die out. As that species dies out, it can affect still other species. Indeed, removing just one species can have huge consequences for all other species in the ecosystem, sending the entire ecosystem into a completely different system state. In other words, removing just one species can be a disturbance so great that it exceeds the ecosystem's resilience. But this doesn't always happen. Sometimes, when one species is removed, the ecosystem does not respond in such dramatic fashion.
For this reason, ecologists often explain the role of biodiversity in ecosystem resilience using the metaphor of the house of cards. When we remove cards from the house, one of two things can happen. If the card was not essential for the house's structure, then the house remains standing. Or, if the card was essential to the house's structure, then the entire house falls down. There is often no middle ground in which part of the house remains standing. To be sure, ecosystems are more complex than card houses, and removing a species can result in a partial collapse of the ecosystem. But the metaphor still works well because it emphasizes the importance of interactions between species and the role that one species can play in the overall function of the entire ecosystem.

One clever Flickr user noted that biodiversity is actually more similar to the game of Jenga than it is to a house of cards because in Jenga, we start with the structure intact and actively remove pieces instead of starting with no structure and building it up. This is a fair point, though in Jenga we intentionally remove pieces, whereas people rarely intentionally remove species from ecosystems.

Reading Assignment: Honey Bees and Colony Collapse Disorder
One of the clearest and most important examples of the importance of one species to others is that of the honey bee and its role in agricultural ecosystems. Honey bees help many important crops by performing pollination, including many fruits, vegetables, nuts, and other species. Just some examples include almonds, apples, broccoli, cotton, grapes, lemons, onions, soybeans, tomatoes, and walnuts. However, recently many honey bees have been dying, a phenomenon known as colony collapse disorder, thereby threatening these crops.
Please read the articles Pollinator Declines and Pesticides and Pollinators. These articles discuss the collapse of honey bee populations and the role of Penn State researchers in understanding and addressing the phenomenon. As you read them, consider the following. What is colony collapse disorder? What are the causes of it? What are the consequences of it? What actions are being taken to address it?
Human Extinction
Throughout this module, we've been focusing on biodiversity loss and species extinctions, in which the species going extinct are species other than humans. But what about us?
It turns out that there are threats to the existence of the human species. Some of them have already been discussed in this course. Human extinction would also have major impacts on natural systems. The possibility of human extinction raises profound ethical issues, including issues of sustainability.
Human Extinction Hazards
Recall from Module 8 that a hazard is an extreme event that causes harm to humans. A human extinction hazard is thus an event that causes human extinction. For better or worse, there exist quite a few human extinction hazards. Here are some important ones:
Climate change. We already know that the climate is changing and that these changes are harming humanity. What we don't know is exactly how harmful climate change will be. We can hope that climate change will be relatively mild and easy to adapt to. However, it might not be. Worst-case scenarios for climate change are frightening, including the possibility that large portions of Earth's land mass will become too warm for mammals to survive. Many species would go extinct under these worst-case scenarios. Humans could be one of them. But it is important to understand that such scenarios would unfold over time scales of decades or centuries. Exactly what the impacts end up being could depend heavily on what else is going on in society during this time. This means that we should view climate change as being part of the human society system. That said, the worst-case scenarios for climate change really are so severe that they could cause human extinction.
Biodiversity loss. The following video summarizes the relationship between biodiversity and human wellbeing and why biodiversity loss is a concern. As more species go extinct, it becomes more likely for ecosystems to collapse. Given how many species are endangered, it is difficult to put an upper limit on how severe the ecosystem collapses could be. The collapses could be so severe that human extinction is threatened. The current honey bee colony collapse situation illustrates this. Without honey bees, humans would struggle - and perhaps fail - to grow many important crops. As more biodiversity is lost, we may find ourselves learning the hard way how important it is to our civilization and indeed our very survival.
Video: Biodiversity- Vancouver Film School (2:41 minutes)
PRESENTER: Life on this planet is made up of a beautiful but very fragile web of interconnected species and environments. We call this biodiversity, and it is the collection of all the different genes, species, and ecosystems in a region.
The Earth has 895 separate ecological regions. They are home to over 4,000 different species of mammals, 270,000 species of plants, and 950,000 species of insects. The more biologically diverse the region, the better its chances of survival.
We can think of biodiversity in three ways. Genetic biodiversity measures how much variety there is in the gene pool of a particular species. When threatened by disease, those species with a more diverse gene pool are more likely to produce individuals who are able to survive and procreate. Those with smaller gene pools can be wiped out forever.
The same principle holds true for species diversity. More kinds of species in a particular ecosystem, the more likely it is to overcome threats such as natural disasters and climate change.
Finally, ecosystem diversity measures number a variety of different ecosystems in a region. The more diverse the region, the more likely it is for life to survive there when catastrophic events occur.
Human beings have a peculiar relationship with biodiversity. On the one hand, we rely on a large variety of species in our environment to keep our water clean; regulate our climate; control pests and disease; and provide us with food, shelter, clothing, and medicine. But human beings today tend to work against biodiversity.
Even though there are over 80,000 species of plants that are potentially edible, we chose only 30 of them to supply 90% of the calories in our diet. Just 14 animal species make up 90% of our livestock, and we've only tested 1% of the plants in the world's rainforests for their potential medicinal value, even though half our medicine is made from natural substances.
The choices we make in our farming, logging, and urban development are crowding out a lot of the species that make up the biodiversity on our planet. And because these species are so interdependent, when one gets wiped out, it can cause other ones to disappear too. And if we're not careful, one day one of those species might just be us.
Pandemics. In Module 8, we saw that biological hazards have led to some of the most severe disasters in human history, such as the bubonic plague and the "Spanish" flu. The COVID-19 pandemic has altered almost every aspect of our society. Politics have changed to reflect concerns about virus transfer. Economic systems have been upended by falling consumption and unemployment. People are transforming the way that they interact socially in order to minimize infection risks. In the coming years, we might begin to see that some of the changes made in response to the pandemic continue even after the risk for infection disappears as a way to increase society's resilience.
Nuclear warfare. In Module 2, we learned that arms races are examples of positive feedback loops. During the Cold War, the arms race between the United States and the Soviet Union was so extensive that it produced enough nuclear weapons to cause destruction worldwide. The Cold War is now over, but many of these weapons still exist. Meanwhile, other countries are pursuing nuclear weapons. The destruction from even a regional nuclear war would be global, because smoke from the weapon detonations would blacken the sky, reducing the amount of sunlight available for crops (a phenomenon sometimes known as nuclear winter). The threat of nuclear warfare is lower now than it was during the Cold War (when there were a few near-misses). But as long as nuclear weapons still exist, the threat will not be zero. The question is, will the world's nuclear powers continue to act collectively to avoid global destruction?
Asteroids and comets. In Module 8, we noted that asteroids and comets are examples of global-scale natural hazards, and that NASA (among other space agencies around the world) is working on monitoring the skies for them. If a large enough asteroid or comet hits Earth, then it could cause human extinction, as well as the extinction of many, many other species. The destruction would come from the impact itself (which could cause massive tsunamis) and from the large amount of dust that kicks up into the atmosphere (similar to the effects of nuclear weapon detonation). Fortunately, large asteroid and comet impacts are not likely to happen anytime soon. In general, the most likely human extinction scenarios are those related to human activity, including all of the other scenarios discussed on this page.
Environmental Consequences of Human Extinction
Given the many interconnections between human systems and environmental systems, we should expect human extinction to have major environmental consequences.
Impacts of the extinction event. Depending on how humans go extinct, environmental systems could also be significantly affected. If there is a pandemic that only infects humans, then the extinction event itself would not have much effect on the environment. However, for other extinction scenarios, the impacts would be quite large. As we've seen in this course, climate change and biodiversity loss harm natural systems at least as much as they harm human systems, with many non-human species going extinct. The explosions and atmospheric dust accumulation from nuclear weapon detonation or asteroid or comet impact would affect all species, except perhaps those in deep-sea ecosystems that get their energy from hydrothermal vents instead of sunlight. While it is unlikely that any one event would end all life on Earth, the event would probably eliminate a significant portion of the species now alive.
Consequences of Earth without humans. Human impact on Earth systems is so large that this era of Earth's history is known as the Anthropocene. Without further human influence, ecosystems would evolve in very different directions. Ecosystems would not return to exactly how they were before humans. If nothing else, the many lingering artifacts of human civilization would prevent this from happening. But some return would occur, as would other novel changes. Some of these consequences are explored in the book The World Without Us by Alan Weisman. To get an overview of the ideas presented there, please view this timeline from The World Without Us.
Ethical Issues With Human Extinction and Some Concluding Remarks
Please read the article Long-Term Sustainability. What are the ethical issues raised here? What are the arguments being made? Do you agree or disagree with them? What other issues does human extinction raise, both for us as individuals and for society at large? How much of a priority should avoiding human extinction be relative to other issues we face? And above all, what do you think should be done?
All of these are difficult but important questions. How you answer them depends on what your ethical views are, as well as your understanding of the nature of human-environment systems and of what can be done to ensure their sustainability. It is not the intent of this course to tell you what your views should be. Instead, it is hoped that the course has given you the opportunity to learn about and reflect on some important topics that will be relevant to you and the world around you, no matter what you end up doing with your life. This is because of how closely interconnected the environment and society are in this ever-changing world.
Summary
Summary
Biodiversity refers to the variation and richness of living organisms. Biodiversity provides many important services to humanity and is also often considered to be valuable for its own sake. Biodiversity tends to be concentrated in certain regions, with rainforests having more biodiversity than any other type of ecosystem on land. While there have been species extinctions throughout history, both because of human activities and for other reasons, today, human activities are threatening extinctions at unprecedented rates. To be sure, humans are also active in protecting biodiversity, such as through protected areas and other projects focused on conservation. But the overall threat to biodiversity loss is so great that conservationists face conservation triage, in which they must decide which species to protect. If too much biodiversity is lost, ecosystems could collapse, threatening the extinction of one more species: humans. The threat of human extinction, whether due to biodiversity loss or other events, raises some very profound ethical issues, issues which connect deeply to the topics in this course.
Assignments
Written Assignment 1: Understanding the Role of Ethics in Human-Environment Geography
This assignment requires you to write a clear, well-organized paper (500-750 words) that responds to the prompt provided below and demonstrates you have read the material in the modules.
- First and foremost, we are grading your comprehension of the course material. To get a good grade, you must demonstrate that you have read and understood the content from the modules we have covered so far.
- Second, we are grading for critical thinking and analysis. How well do you form and support your arguments with evidence from the course material or external sources?
- Third, we are grading for clean and quality writing. This means your paper should be well-written, thoroughly proofread, answer all parts of the prompt, and cite and format any/all sources correctly (see course Orientation for guidance on the APA style we expect you to use in this class).
Written Assignment Instructions
For this learning activity, you are going to analyze a human-environment scenario from the list below, discuss components of the human-environment system at work in the scenario, and then make an argument for or against a specific action based on an ethical position you have chosen.
Additionally, you must connect at least one relevant current event or source from the past 12 months to your argument. For instance, if you are writing about renewable energy, you could reference a recent example of renewable energy use or a new research study on the economic impacts of renewable energy. Be sure to cite your sources.
Below is a list of human-environment scenarios. Choose one of the scenarios and assume it is taking place in your hometown.
Here are the scenarios:
- During an economic recession, a plastics company proposes to construct a production facility in your town, providing employment for dozens of unemployed residents. This company has also made a pledge to plant 100,000 trees a year to mitigate global carbon emissions, but wastewater from their production facilities is known to have a negative impact on marine life in nearby rivers and streams.
- In an effort to shift toward renewable energy sources, your home city considers building a new solar power plant. This solar plant would eliminate all reliance on non-renewable energy for your city. To finance the plant construction, a temporary tax increase is proposed, which would force some lower-income residents to leave.
- A new airport to serve a nearby large city is proposed to be built in your town. The airport would provide hundreds of new jobs and give a major boost to the town’s economy, with travelers utilizing local restaurants and hotels. The only possible location to construct the new airport would be along a key migratory bird corridor, displacing bird populations.
Write a paper that is 500-750 words responding to the following questions:
- State your chosen scenario in bold type at the beginning of your paper.
- Using your chosen scenario, briefly describe the coupled human-environment system to which the scenario relates. What human and environmental components make up the system? How are they affecting one another?
- Identify an ethical viewpoint from Module 3 with which you identify and explain its basic tenets.
- Make an argument for or against the proposed action in your scenario and give an ethical justification for your argument based on the ethical viewpoint which you chose. Be sure to include at least one relevant current event or source from the past 12 months. It does not matter if you are for or against the action. What we need to see is that you recognize how your ethical framework led you to that decision.
You must engage at least three course concepts in your paper.
- Remember: engaging a course concept means defining that concept and explaining how it helps you think about the theme of your paper. Please bold the concepts you engage in your response. Additionally, remember to properly cite any external sources.
Review the grading rubric before completing your assignment. If you need help getting started, please reach out to the instructor or a teaching assistant.
Written Assignment 2: Carbon Footprints and Individual vs Collective Action
This assignment requires you to write a clear, well-organized paper (500-750 words) which responds to the prompt provided below and demonstrates you have read the material in the modules.
- First and foremost, I am grading your comprehension of the course material. To get a good grade, you must show me that you have read and understood the content from the modules we have covered so far.
- Second, I am grading for critical thinking and analysis. How well do you form and support your arguments with evidence from the course material or external sources?
- Third, I am grading for clean and quality writing. This means your paper should be well-written, thoroughly proofread, answer all parts of the prompt, and cite and format any/all sources correctly (see course Orientation for guidance on the APA style we expect you to use in this class).
Written Assignment Instructions
The global carbon cycle refers to the processes by which carbon is emitted, transferred, and stored within the Earth system. Carbon is usually emitted in the form of carbon dioxide (CO2) or methane (CH4), often through the use of fossil fuels such as coal and oil. These carbon emissions are first stored in the atmosphere and can be transferred out of the atmosphere via processes such as vegetation respiration, through which plant life absorbs carbon dioxide. Figure A.2 displays schematically other facets of the carbon cycle, such as carbon transfer from the atmosphere to the ocean.
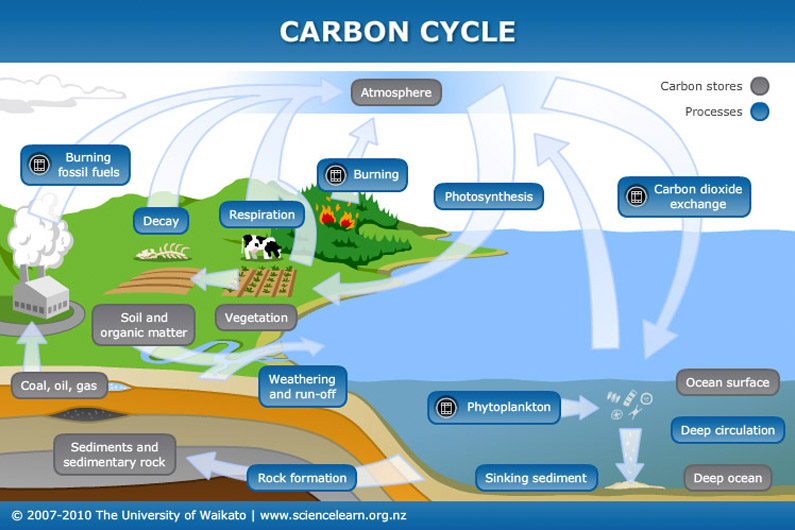
Carbon Processes:
Atmosphere: Burning Fossil Fuels, Decay, Respiration, Burning, Photosynthesis, Carbon Dioxide Exchange with the oceans. All except photosynthesis put carbon into the atmosphere.
Oceans: Carbon Dioxide exchange with the atmosphere, phytoplankton, sinking sediment, deep circulation, rock formation, weathering and run off. All except rock formation put/spread out carbon in the oceans.
Carbon Stores:
Sediments and sedimentary rock (caused by rock formation), ocean surface (caused by CO2 exchange), deep ocean (caused by sinking sediment, run off, phytoplankton and circulation), atmosphere (Caused by all atmospheric carbon processes listed above except photosynthesis), vegetation (caused by photosynthesis), soil and organic matter, coal, oil & gas.
The global climate cycle has become of heightened interest in recent decades, as fossil fuel burning has rapidly increased the amount of carbon stored in the atmosphere. Paleoclimate records – indicators of previous climate conditions – show us that the Earth has had drastic swings in atmospheric carbon levels throughout its 4.6 billion year history, which initially suggests that there is nothing abnormal about present atmospheric carbon levels. However, the rapid rate at which carbon is being stored in the atmosphere is leading to abrupt shifts in climate conditions. The speed at which these climate changes are occurring threatens the ability for animals – including humans – to adapt successfully. Accordingly, there is a pressing need to reduce carbon emissions from the industrial to the household level.
In this assignment, you will be examining your carbon footprint and how you and others like you can reduce their carbon footprint through individual or collective action. A carbon footprint is an indicator of the amount of carbon dioxide and methane we produce through various activities, either individually or collectively. It includes the carbon produced through how we travel (e.g., via car, airplane, or public transit), our home energy use, and even our diets. For example, consuming beef products produces carbon in multiple ways, including but not limited to: decreased carbon sequestration due to deforestation for cattle grazing, methane emitted by cows, and the emissions of vehicles transporting meat to a grocery store. An important takeaway is that although our actions may not always directly produce carbon, the choices we make can indirectly result in carbon emissions.
Writting the paper
To write this paper, you must do some research. First, read about carbon footprints on The Nature Conservancy carbon footprint calculator website and the Global Footprint Network website. As you read, think about the spatial patterns of carbon footprints (i.e., how carbon footprints vary by individual, household, state and even country). Consider the international differences between net (i.e., total) carbon emissions and per capita (i.e., per unit population) carbon emissions. Feel free to find other external references on carbon footprints. Remember to in-text cite and reference all external sources.
Second, use either the United States EPA Carbon Footprint Calculator or The Nature Conservancy Carbon Footprint Calculator to estimate and analyze your carbon footprint. Note that most of your carbon footprint is indirect and will be determined by your lifestyle. Find out what choices (e.g., transportation, diet, etc.) have the most substantial carbon footprint.
Finally, consider individual and collective actions that can be made to reduce carbon emissions. Consider your personal carbon footprint as you propose ways to decrease carbon emissions. Feel free to research some ideas for these actions – just be sure to cite and reference your source(s).
Based on the previous activities, write a paper of 500-750 words responding to the following questions:
- What is your carbon footprint?
- Attach a screenshot of your carbon footprint to your document.
- What habits or choices (e.g., amount of travel, shopping habits, etc.) explain your carbon footprint?
- Note: Your income is used to estimate your carbon footprint from the use of industrial goods. This is not a very exact estimate. Do not mention your income in your written assignment.
- How would you explain the spatial differences in carbon footprints? What factors (e.g., wealth/GDP, population, etc.) would you attribute to these spatial contrasts in carbon footprints?
- You may need to reference outside source(s) to fully respond to this prompt.
- What individual and collective actions can be taken to reduce your individual carbon footprint and the carbon footprint of your community or country?
You must engage at least 3-course concepts of the current modules in your paper.
- Remember engaging a course concept means defining that concept and explaining how it helps you think about the theme of your paper. Please bold the concepts you engage in your response.
Review the grading rubric before completing your assignment.
Written Assignment 3: Development and Agriculture
This assignment requires you to write a clear, well-organized paper (500-750 words) that responds to the prompt provided below and demonstrates you have read the material in the modules.
- First and foremost, we are grading your comprehension of the course material. To get a good grade, you must demonstrate that you have read and understood the content from the modules we have covered so far.
- Second, we are grading for critical thinking and analysis. How well do you form and support your arguments with evidence from the course material or external sources?
- Third, we are grading for clean and quality writing. This means your paper should be well-written, thoroughly proofread, answer all parts of the prompt, and cite and format all sources correctly (see course Orientation for guidance on the APA style we expect you to use in this class).
Written Assignment Instructions
In this assignment, you will examine how the COVID-19 pandemic has impacted food security in two different countries—the United States and a developing country of your choosing. First, read through the U.N.’s Sustainable Development Goals (SDGs), focusing particularly on Goal 2: "Zero Hunger." Consider how Goal 2 is being impacted by COVID-19 by reading the following report of the U.N. Secretary-General, specifically paragraphs 20-31: https://undocs.org/en/E/2021/58. After reviewing this report, research how COVID-19 has impacted the U.S. and one developing country of your choice, making sure to gather information that can help you answer the questions listed below.
Write a 500-750 word paper responding to the following questions:
- How does Sustainable Development Goal #2 (Zero Hunger) fit with your understanding of development from the course material?
- How has COVID-19 impacted food security in the two countries you have researched? How do the problems of access differ between your two countries?
- In your response, please include and analyze at least one source from the past 12 months. Be sure to cite your sources.
- How do the similarities and differences in food security and food access in these two countries impact the way you think about development?
You must engage at least three course concepts in your paper.
- Remember, engaging a course concept means defining that concept and explaining how it helps you think about the theme of your paper. Please bold the concepts you engage in your response. Additionally, remember to properly cite all external sources.
Review the grading rubric before completing your assignment.
Written Assignment 4: Sustainable Cities
This assignment requires you to write a clear, well-organized paper (500-750 words) which responds to the prompt provided below and demonstrates you have read the material in the modules.
- First and foremost, we are grading your comprehension of the course material. To get a good grade, you must demonstrate that you have read and understood the content from the modules we have covered so far.
- Second, we are grading for critical thinking and analysis. How well do you form and support your arguments with evidence from the course material or external sources?
- Third, we are grading for clean and quality writing. This means your paper should be well-written, thoroughly proofread, answer all parts of the prompt, and cite and format all sources correctly (see course Orientation for guidance on the APA style we expect you to use in this class).
Written Assignment Instructions
Select and research an urban neighborhood with which you are extremely familiar, preferably one you have visited a few times. In addition to your own experience with this urban neighborhood, you may also use Google Earth or Google Street View to analyze the location.
- Using course content analyze this neighborhood from a social and environmental perspective. Please do not select State College for your analysis.
You must cite at least 3 reputable outside sources that do not include the course modules for this assignment. At least one source must be from the past 12 months. For help evaluating what constitutes a reputable resource, please consult this guide from the Penn State libraries(link is external).
After you have selected your urban neighborhood, write a 500-750 word paper which answers the following questions (divided into two parts):
- Analysis of the urban environment
- Briefly state your connection to this neighborhood.
- Have you lived in this neighborhood, have friends/family from the area, etc.?
- What are the main attributes of the built environment of this neighborhood (e.g., size/existence of sidewalks; width of streets; height/size of buildings or homes)?
- What are the main environmental attributes (i.e., proximity to greenspace or water; habitat)? Is there a lot of vegetation in this neighborhood?
- How do people use this neighborhood?
- Is the neighborhood full of pedestrians, or are most people inside cars or buildings?
- What groups might feel welcome, and which not, in this neighborhood?
- How easy is it to access this neighborhood by different modes of transportation?
- Does this neighborhood have historical or cultural significance?
- Was it part of a redlined (or green) neighborhood? (See: https://dsl.richmond.edu/panorama/redlining/#loc=5/39.1/-94.58(link is external))
- Briefly state your connection to this neighborhood.
- Provide at least two strategies that you have learned about in the course module or from your independent research that might make this a more socially and environmentally sustainable neighborhood.
- How do these two strategies support social equity or environmental sustainability?
- How feasible are these strategies for this place?
- What challenges would this neighborhood face in enacting these changes?
You must engage at least three course concepts from the current modules in your paper.
- Remember engaging a course concept means defining that concept and explaining how it helps you think about the theme of your paper. Please bold the concepts you engage in your paper. Additionally, remember to cite all external sources properly.
Review the grading rubric before completing your assignment.
Written Assignment 5: Vulnerability Reduction
This assignment requires you to write a clear, well-organized paper (500-750 words) that responds to the prompt provided below and demonstrates you have read the material in the modules.
- First and foremost, we are grading your comprehension of the course material. To get a good grade, you must demonstrate that you have read and understood the content from the modules we have covered so far.
- Second, we are grading for critical thinking and analysis. How well do you form and support your arguments with evidence from the course material or external sources?
- Third, we are grading for clean and quality writing. This means your paper should be well-written, thoroughly proofread, answer all parts of the prompt, and cite and format all sources correctly (see course Orientation for guidance on the APA style we expect you to use in this class).
Written Assignment Instructions
In this assignment, you will apply concepts learned in Modules 8 and 9 to analyze the "natural disaster" of wildfires in California. You will need to engage relevant materials from the assigned readings, modules, AND outside sources. The objective of this assignment is to increase your understanding of the relationship between vulnerability, natural hazards, and disasters, and to help you develop a more complex framework for understanding how natural disasters unfold.
- Read the following article on the nature of "natural disasters" and the complexity of Hurricane Katrina's aftermath by Neil Smith: “There’s No Such Thing as a Natural Disaster”
- Research the factors increasing the frequency and intensity of wildfires in California.
- You will need to cite at least 3 reputable outside sources that do not include the course modules for this assignment. At least one source must be from the past 12 months. For help evaluating what constitutes a reputable resource, please consult this guide from the Penn State libraries.
Write a 500-750 word paper that answers the following questions:
- What does Smith mean when he states that there is "no such thing as a natural disaster"?
- Throughout the past few years, we have witnessed an increase in the occurrence, range, and severity of California wildfires. Using Smith’s reasoning regarding the classification of "natural" disasters as human-made occurrences, analyze the wildfires that have burned in California in recent years and determine the ways in which human (in)action has contributed to the severity of these disasters.
- How credible do you find Smith’s arguments? Is there really no such thing as a natural disaster?
You must engage at least 3 course concepts from Modules 8 and 9 in your paper.
- Remember, engaging a course concept means defining that concept and explaining how it helps you think about the theme of your paper. Please bold the concepts you engage in your paper. Additionally, remember to properly cite all external sources.
Review the grading rubric before completing your assignment.
Written Assignment 6: Biodiversity
This assignment requires you to write a clear, well-organized paper (500-750 words) that responds to the prompt provided below and demonstrates you have read the material in the modules.
- First and foremost, we are grading your comprehension of the course material. To get a good grade, you must demonstrate that you have read and understood the content from the modules we have covered so far.
- Second, we are grading for critical thinking and analysis. How well do you form and support your arguments with evidence from the course material or external sources?
- Third, we are grading for clean and quality writing. This means your paper should be well-written, thoroughly proofread, answer all parts of the prompt, and cite and format all sources correctly (see course Orientation for guidance on the APA style we expect you to use in this class).
Written Assignment Instructions:
First, please do some independent research on the links between biodiversity loss and the rise of zoonotic diseases, such as COVID-19. You will need to cite at least 3 reputable outside sources that do not include the course modules for this assignment. For help evaluating what constitutes a reputable resource, please consult this guide from the Penn State libraries. Second, write a 500-750 word essay on the links between biodiversity loss and zoonotic disease which addresses the following questions:
- Briefly explain zoonotic diseases.
- In your explanation, include at least one example from the past 12 months.
- How does biodiversity loss impact the emergence and frequency of zoonotic diseases, such as COVID-19?
- Drawing on materials from the course, provide a policy recommendation to reduce the correlation between biodiversity loss and the emergence of zoonotic diseases.
You must engage at least 3 course concepts from these modules in your paper.
- Remember engaging a course concept means defining that concept and explaining how it helps you think about the theme of your paper. Please bold the concepts you engage in your response. Additionally, remember to properly cite all external sources.
Review the grading rubric before completing your assignment.
Grading Rubric for Written Assignments
|
Criterion |
Excellent |
Good |
In progress |
Novice |
|---|---|---|---|---|
|
Grasp of course content (15 points) |
14-15 pts: Shows full grasp of course content by correctly engaging 3 or more course concepts. Engaging concepts includes defining them and explaining how they help understand the theme of the paper. |
11-13 pts: Addresses at least 3 concepts. Shows understanding of roughly 2/3 to 3/4 of the concepts addressed. |
9-10 pts: Addresses at least 2 concepts. Shows understanding of half of the concepts addressed. |
0-8 pts: Understands less than half of the concepts addressed. 5 points given for trying to engage with 1 or more concepts. |
|
Critical thinking and analysis (20 points) |
18-20 pts: Argument is very well-formed with evidence from modules or other sources to support it. The argument and analysis respond directly to the assignment prompt. |
15-17 pts: Argument is thoughtful and has some evidence to support it, but it may have gaps or it may rely on unsupported assumptions. The argument is not convincing. |
12-14 pts: Argument engages poorly with course concepts or assignment questions. It may be contradictory or rely heavily on unsupported assumptions. Critical thinking is insufficient. |
0-11 pts: There’s hardly an argument, or it is difficult to follow. Alternatively, the argument and analysis may be good, but do not respond to the assignment prompt. |
|
Meeting assignment requirements (8 points) |
Paper Addressing 3+ course concepts: 4 pts Addressing all assignment questions: 4 pts |
|||
|
Writing and citations (7 points) |
7 pts: Paper is well-written and free of grammar and spelling errors. Paper is correctly cited. |
5-6 pts: Fair writing, with a few mistakes. Easy to understand. |
3-4 pts: Poor writing, several mistakes. Requires effort to understand. |
1-2 pts: Very poor writing, with several mistakes. Difficult to understand. |
How to get good grades on the written assignments
Written assignments make up the bulk of your grade in this course. These should be high-quality short papers (500-750 words long) that are well-organized (i.e., with a clear introduction, body, and conclusion), thoroughtly proofread, carefully researched (you do not always have to do research outside of the modules, but your paper should demonstrate that you understand and can apply the material in the modules), and respond to ALL parts of the assignment prompt. Expect to work on each paper over the course of a few days (these are NOT assignments you can throw together 20 minutes before they are due).
Each paper must engage at least three concepts or ideas from that week's course material, which you should highlight in bold. It is not enough to just mention them. You must define them and explain why they are relevant to your paper.
Take time to understand the grading rubric before you begin the assignment. Your grade will depend on how well you meet the criteria and expectations outlined in the rubric.
How to get good grades on the quizzes
Please take studying for these quizzes seriously. You need to have a thorough grasp of all the material covered in that unit in order to do well on the quiz. The quiz is open-book, so if you don’t know the answer, but know where to look in the modules, you can find the answer. But remember, the quizzes are timed - 25 questions in 60 minutes - so you do not have time to search around for answers if you did not study beforehand. If you want to do well on the quiz, you will need to have the answers in your head already without having to look back, so study is critical.
All questions in the quizzes are new this semester. The TAs and I created an entirely new question bank, so you can not count on knowing answers from previous semesters. When studying, pay particular attention to bolded, italicized, or otherwise key concepts, but don’t neglect the areas that don’t have bolded text. You should be able to summarize the key concept or argument from each paragraph in the text, and from each assigned reading, prior to taking the quiz.
Questions may be from any part of the online material including assigned readings and videos.