Lesson 9 - Beginning the Term Project
An Overview of Lesson 9
This lesson will introduce you to the term project and the siting criteria we will use for the project. The project will use what you have learned in the two Esri courses and apply that knowledge to siting a transmission line, using GIS.
Utilities have historically sited transmission lines through a process of selecting transmission line corridors, narrowing the corridors to an optimum corridor, and then selecting the most appropriate route through the corridor for the new transmission line. This process has evolved from a subjective, table-top exercise in the early days of siting, to a more transparent, objective analysis using GIS. The utility industry recognized the need to make the process more efficient and objective because of growing siting difficulties created by increased costs to site and build transmissions lines, increased regulatory oversight, and mounting opposition from the people and communities these new lines would pass by or through.
What will we learn in Lesson 9?
In this lesson, you will utilize the knowledge you have gained so far to begin a final project. The end result of the project will be a presentation explaining your best-selected route for a proposed transmission line.
By the end of this lesson, and using Sample GIS data, students will be able to do the following:
- apply EPRI-GTC Overhead Electric Transmission Line Siting Methodology to a real-life scenario;
- describe how the EPRI-GTC process categorizes evaluation criteria into three general categories: Natural, Built, and Engineering Environments;
- generate a base map from ArcGIS Pro;
- conduct a siting analysis, using ArcGIS Pro, to determine the most appropriate location for a transmission line;
- evaluate route statistics and determine the siting route;
- explain the complexity of selecting the most appropriate siting route.
What is due for Lesson 9?
This lesson will take us one week to complete. Please refer to the Calendar for specific time frames and due dates. Specific directions for the assignment below can be found in this lesson.
- Lesson 9 Quiz
- Term Project Background Document
- Run a model using sample GIS data (this should take you between 3 and 4 hours to complete and should be done in one sitting). Please plan your time accordingly.
- Create a background document to be included in the final project. (this will require 1-3 hours of writing).
Questions?
If you have any questions, please post them to our Questions? discussion forum. I will check that discussion forum daily to respond. While you are there, feel free to post your own responses if you, too, are able to help out a classmate.
Introduction
The final term project will involve using GIS to select the most appropriate transmission line corridor given three competing corridors (Lesson 9). Public opposition to the siting of transmission lines is a critical factor that must be addressed. In Lesson 10, you will have the opportunity to develop plans to address this opposition. The final aspect of siting a new transmission line is how the utility presents the final route selection to the public. Normally, this is conducted through a series of public meetings held in the area where the proposed transmission line will be constructed. In Lesson 11, you will have the opportunity to develop a presentation that will be used for these public meetings. Lesson 12 will have you acting as a "Corporate Transmission Line Siting Committee Executive" reviewing and commenting on the public presentation of one of your classmates. Finally, during Lesson 13, you will incorporate any suggestions from Lesson 12 and submit your final project for grading.
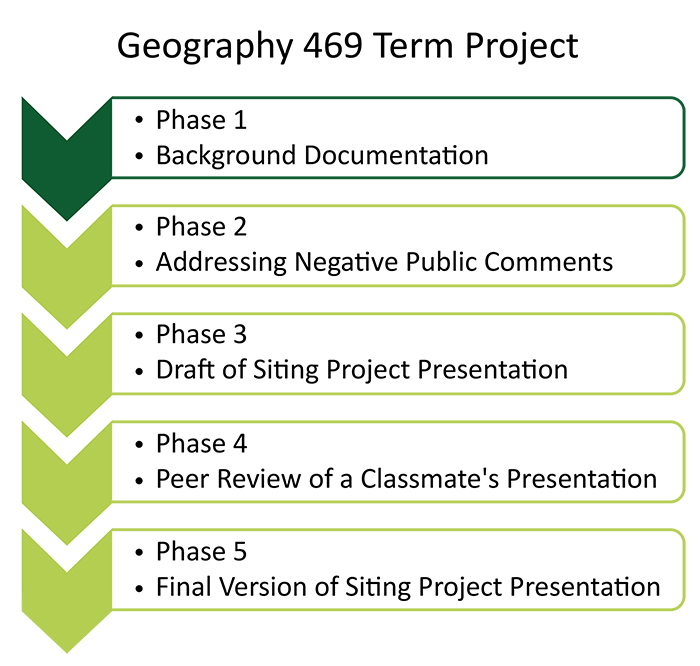
Lesson 9
Phase 1
Background Documentation
Lesson 10
Phase 2
Addressing Negative Public Comments
Lesson 11
Phase 3
Draft of Siting Project Presentation
Lesson 12
Phase 4
Peer Review of a Classmate's Presentation
Lesson 13
Phase 5
Final version of Siting Project Presentation
Term Project Expectations
The term project will encompass Lessons 9-13. Each lesson will address a specific aspect of the siting process and will use the information you learned through the first 8 lessons of the course.
I will be treating this project as close to a real-world scenario as possible, with all the pitfalls, decisions and outcomes that are typically encountered in these types of projects. Because of this, I expect you to meet all deadlines, no exceptions…..as many of you know, that is the way it works in the real world with projects of this magnitude…..tight timelines, heavy workloads, etc.…..time is money and any internal or external delay escalates the final cost and prolongs implementation of the project.
You will be the project manager for this project and you will be reporting to me. I expect you to complete each segment of the project on time and in a professional manner. All materials created should be created by you and presented in a form that shows your understanding of the issues and reflects your professionalism. Presentations should be prepared and delivered with the intent that you are selling your final routing decision before the Champlain Power Transmission and Distribution Siting Committee. Your final presentation will help determine the amount of money Champlain Power will allocate to this multi-million dollar project, so your presentation skills will be on display. In Lesson 12, you will reverse roles and be a member of the T&D Siting Committee, where you will select a presentation of a fellow student and provide constructive, positive feedback on his or her presentation highlighting the positive aspects of the presentation and recommending improvements where help may be needed. Lesson 13 will have you refine and resubmit your final presentation, based on the feedback you receive from Lesson 12.
The term project will consist of the following parts:
- Siting scenario and background information document: Lesson 9
- Addressing negative public comments: Lesson 10
- Creating a final presentation and submitting it for peer review: Lesson 11
- Reviewing a peers presentation: Lesson 12
- Refining and submitting your final presentation: Lesson 13
Term Project Siting Scenario
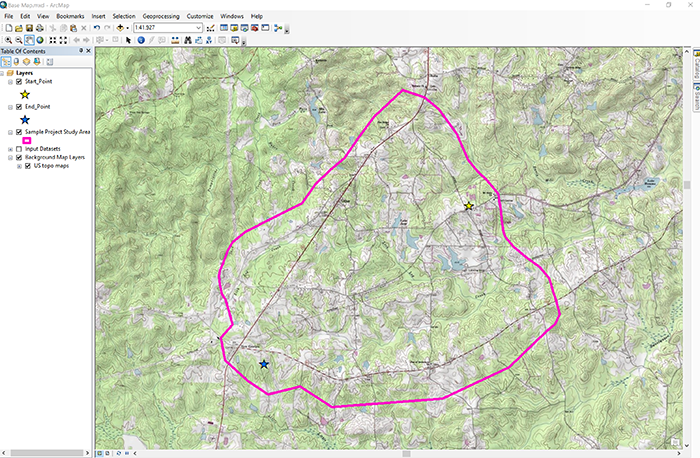
Champlain Power, Inc. has submitted a request to the Georgia State Public Service Commission (GSPSC) to construct, operate, and maintain an overhead 345 kV High Voltage Direct Current transmission line named the "Nebo-Baskins Road Interconnect."The line would begin near Nebo just northeast of Dallas Nebo Road (Start Point) and run southwest to an existing substation southwest of Baskin Road (End Point) (Figure 9.2). The proposed transmission line will be approximately 3.5 miles in length, depending on the final siting decision for the line route. The public outreach and GSPSC reviews should be finalized by April 1, 2019. Construct on the new transmission line is expected to start in January, 2020.
This interconnect is needed to meet the projected demand for new residential, commercial, and light industrial service in the area. The United States Census, the Georgia Economic Development Agency, and local government data all point to increasing current and future needs for infrastructure additions to meet this growing demand. Internal projections made by Champlain Power also suggest the need to increase electric capacity to the area to meet future projected needs. Currently, the area serviced by Champlain Power serves approximately 150,000 residential customers; 7,500 commercial customers; and 1,200 light-industrial customers. Future demand projections (2020-2050) suggest the electric services will increase to 300,000 residential; 18,000 commercial; and 1,500 light-industrial customers. This demand cannot be met by the existing electric service, and a major expansion is required to meet this anticipated increase.
Champlain Power has selected three potential corridors for the planned overhead line interconnect. From these three corridors, a preferred corridor will be selected. Additional siting analysis will then be conducted to select the most appropriate route based on optimum natural environment, built environment and engineering environment criteria. This final route will be submitted to the GSPSC for review and approval. Initial construction will commence within 60 days of final GSPSC approval.
For the term project, you have been assigned as the project manager for siting the Nebo-Baskins Road Interconnect Transmission Line.You will be responsible for leading a team that will have full responsibility for selecting a preferred corridor, conducting the additional siting analysis, and selecting the most appropriate route for review and approval by the GSPSC. In addition, you will responsible for managing all community information outreach programs to keep the general public informed of the siting process and progress. The following two videos will give you a brief introduction to the project:
Click for a transcript of "Introduction" video.
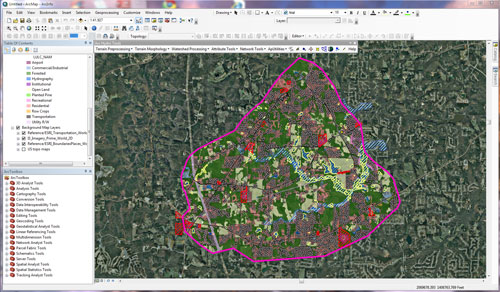
PRESENTER: This is a Google Earth view of the term project study area. The study area is inside the pink boundary. Now, one of your tasks for the term project is to locate three alternate routes through study area between the start point and the end point. But to complicate the route selection, you will need to consider the impacts on the built and natural environment.
These impacts include buildings, which I'll turn those on for you. You can see the buildings and their building footprints. Avoidances, let me click on that for you. You have the avoidances and avoidances include such things as schools, daycare centers, churches, cemeteries, and things of that nature.
Now, the next thing that you have to take a look at will be large building footprints. Obviously, we don't want a transmission line going over a large building. Then, we'll take a look at the conservation areas, and the conservation areas include a number of things. They include lakes, wetlands, and in this instance, they also include some floodplain areas. So then, your mission is to locate three alternate routes and then select the best route that minimizes impacts to the natural and built environment.
Good luck. The second video will give you a unique look at a fly-through of an example alternative route to give you a feel for the obstacles and questions you could encounter with your route selection.
PRESENTER: What I want to do is show you the lay of the land using a flythrough created in Google Earth. I have defined a typical alternate transmission line route through the study area, similar to the alternate routes you will create in your term project. Along the way, we will stop at numerous locations to view the surrounding areas and ask some questions.
As we start the flythrough, what you see is a thin white line and two red lines. The white line is the alternate route, and the red lines are the boundaries, or the right of way for the route. OK, so let's start to tour.
This tour starts at the end of the alternate route and works back to the start point. As we start our flythrough, we fly over alternate forest and agriculture land uses.
Stop 1. Our first stop is near a single-family residence on the right. What potential impacts, if any, to the resident can be associated with the location of the route?
As we proceed, we again encounter alternate forest and agricultural land uses. What would be some of the impacts associated with these types of land uses?
Stop 2. Our second stop shows a route passing over a small farm pond. When locating alternate routes, you want to minimize impacts to the natural environment as much as possible.
Sometimes, that may not be possible. But in this instance, the route could be moved to eliminate this impact. Continuing on our tour, we again pass long stretches of forest and agriculture land use. In addition, we encounter changes in topography. How do you think these topographical changes could impact the location of the proposed route?
Stop 3. It appears the alternate route goes directly through a planned subdivision. In this instance, the route would need adjustments to miss the subdivision. A more appropriate location may be to the right of the planned subdivision. Continuing, we again pass over long stretches of forest and agriculture land, minimizing our impacts to the built environment.
Stop 4. We encounter our first major hurdle, a conservation area including a large lake. In this instance, we may have no viable alternative, and this is our best location. What impacts do you recognize here? As we continue our flythrough, we again encounter a large area of forest land and agriculture land use before we arrive at our starting point.
Stop 5. The question is, can we define a better route? As we come to the end of the flythrough, you have seen some of the obstacles needing resolution, and typical questions that require answers before you can select a final route.
Background Document Instructions: Term Project
Most utility companies now use GIS to site new transmission lines, either using in-house developed siting methodology or relying on outside consultants to develop the GIS siting framework. The Electric Power Research Institute (EPRI), a private R&D company closely tied to the utility industry, recognized the need to standardize the process of siting to bring even more objectivity, transparency, and creditability to the siting process. In 2002, EPRI joined forces with the Georgia Transmission Corporation (GTC) to study transmission line siting and develop a process to make siting decisions more quantifiable, consistent, and defensible.
We will use an abbreviated EPRI-GTC Overhead Electric Transmission Line Siting Methodology for the term project. The graphic below shows a generalized flow line of how this methodology works. Click on the graphic below for a brief explanation.
The corridor analysis funnel is a high-level depiction of the siting process. The inputs to the funnel include community considerations, natural environment considerations, and engineering considerations.
Now the community considerations include things like human cultural resources, the natural environment includes things like plants, animals and water resources and the engineering considerations include physical constraints on the systems and features that would maximize location and minimize cost and schedule delays.
The information derived from each of these considerations is put into a geographic information system to determine values and weight for each of the considerations. Now as we move down through the funnel, the area of interest becomes more focused and defined and the data become more detailed and accurate.
Exiting the funnel is a culmination of the siting methodology where a preferred route or center line is proposed for the transmission line.
Now, as you go through the GIS analysis part of the project, you will analyze these considerations simultaneously to objectively determine the most suitable line location. To do this manually would require many man-hours of work, would be less accurate in the final outcome, and could lead to increased litigation, project delays and cost escalation because of a lack of objectivity and transparency.
As the project manager, your first task will be to develop a background document outlining your understanding of the siting process and the assigned task. Specifically, you will need to answer the questions below from the Siting Transmission Lines Using the EPRI-GTC Siting Methodology document found in the Term Project Materials module. You will also conduct the siting analysis to determine the most appropriate location for the transmission line. Before the selected route can be made public, the actual location must be approved by our Transmission Line Siting Oversight Committee. In preparation for your meeting with the Committee, you will need to develop a background document including the items identified under ACTIVITIES>2. Activity>Part 2 below. REMEMBER: YOU ARE THE PROJECT MANAGER... TREAT THIS LIKE A REAL WORLD PROJECT... MEET DEADLINES, DELIVER A QUALITY PRODUCT, ETC... YOU WILL BE GRADED ACCORDINGLY.
Activity #1: Quiz
- Before taking the quiz, read the white paper titled "Siting Transmission Lines Using the EPRI-GTC Siting Methodology" located in the "Term Project Materials" module.
- Take the Lesson 9 Quiz.
Activity #2
Note: This assignment has two parts.
Activity #2, Part 1
Caution! This exercise requires you to pay close attention to detail and follow the instructions completely. Failure to do so can result in completion delays, model run failures, and an unresponsive ArcMap.
PLEASE READ THE INSTRUCTIONS VERY CAREFULLY FROM START TO FINISH BEFORE STARTING THE LESSON 9 ArcGIS PROJECT.
I want you to be successful and have fun with the project…not become frustrated! So, I cannot emphasize enough the importance of following the instructions in Lesson 9 step-by-step! Failure to do so has resulted in students having problems. I would suggest you go so far as printing them off and checking off each step as they are completed. I would also highly suggest you run it from start to finish in one sitting.
I would suggest you run the model on your local computer. Please refer to the Frequently Asked Questions for Lesson 9. If you do not find answers there, please do not hesitate to reach out to me.
- Download the PDF file titled "Transmission Line Siting Exercise Instructions ArcGIS Pro" document located in the "Term Project Materials" module to your C:\temp folder.
- Verify that you successfully unzipped the "SAMPLE_ROUTING_PROJECT.zip" in Lesson 7.
- Verify that the "SAMPLE_ROUTING_PROJECT" folder created in your C:\temp folder (C:\temp\SAMPLE_ROUTING_PROJECT\) contains the following folders/files:
- Analysis folder
- Data folder
- Base_Map.mxd(Esri Map Document)
- SampleProject_Toolbox.tbx
- Simplified_Epri_model.xls
- Simplified_Route_Evaluation_spreadsheet.xls
- Follow the instructions in the "Transmission Line Siting Exercise Instructions ArcGIS Pro" document that you downloaded (step 1) to complete the exercise and find the optimal route. The instructions are very detailed, and a missed step can result in the siting model not executing. PAY ATTENTION TO DETAILS!
Activity 2, Part 2
Using a Word document or Google Docs, create a background document that includes the following elements:
- a title page including project title, your name, course number, and date
- a brief description of the project
- the base map showing the study area in question
- a map showing your selected route
- the Data Normalized Table from the Excel spreadsheet
- the Combined Rank Chart from the Excel Spreadsheet
- your analysis/comments on why you chose your selected route including
- an explanation of a normalized data table
- an explanation of a combined rank chart
- your conclusions/opinions about the best route identified in the Combined Rank Chart
Having Problems?
If you are having problems, please consult the FAQ for answers to some of the most frequently asked questions. If you don't see the answers you need there, post your questions to the Lesson 9 General Questions and Comments Discussion Forum.
Submitting Your Work
Upload your paper to the "Lesson 9 Term Project: Project Background" drop box by the due date indicated on our course calendar.
Grading Criteria
I will grade your work using the Term Project Background Document Rubric
Background Document Rubric
| Category | Weight | 40 - 31 points | 30 - 21 Points | 20 - 11 Points | 10 - 1 Points | 0 Points |
|---|---|---|---|---|---|---|
| Title Page | 3% | Included project title, student’s name, course number and date |
Included only 3 of the 4 required elements | Included only 2 of the 4 required elements | Included only 1 of the 4 required elements | No title page or none of the required elements were included |
| Brief description of the project | 10% | Brief, two-page, objective, technically written; description of the project; including the following topics: 1. Background Information 2. Location of project 3. Need for project 4. Projected outcome |
Brief two-page, objective, technically written description including topics 1-4 | Brief one-page, objective, technically written description but not including background and needs discussion. | A non-objective, nontechnical one-page description incorporating topics 1-4. | No project description presented |
| Base map showing the study area in question | 37% | Complete base map showing the following elements: 1. Starting and ending points 2. North Arrow 3. Scale Bar 4. Legend 5. Buildings 6. Floodplains 7. Wetlands 8. Landuse 9. Project Boundary 10. Completed route map showing the selected route and the two alternative routes. |
1. Elements 1-4 plus 4 of the remaining elements. 2. Completed route map showing the selected route and one alternative route. |
1. Elements 1-4 plus 3 of the remaining elements. 2. Completed route map showing the selected route and no alternative routes. |
1. Elements 1-4 not displayed, but 2 of the remaining elements displayed. 2. Completed map showing all three routes, but no selected route. |
1. No base map presented, or no elements displayed on the base map. 2. Map showing no selected route or alternative routes. |
| Route Evaluation Spreadsheet | 10% | Route statistics have been entered into each route category (9 numeric values total). | Route statistics have been entered for 2 of 3 route categories. | Route statistics have been entered for 1 of 3 route categories. | - | No route statistics have been entered into the spreadsheet. |
| Conclusions and opinions about the best route identified in the Combined Rank Chart | 40% | Conclusion & opinions based on information gathered from 1) Background data, 2) Base map, 3) Selected route map and 4) Combined Rank Chart. | Conclusions & opinions based on information gathered from 3 of 4 criteria listed in 4 Point Column. | Conclusions & opinions based on information gathered from 2 of 4 criteria listed in 4 Point Column. | Conclusions & opinions based on information gathered from 1 of 4 criteria listed in 4 Point Column. | No conclusions or opinion presented. |
The grade for each category is calculated by multiplying the weight for the category times the number of points awarded for that category to arrive at the weighted score for each category. The final grade is the sum of all category-weighted scores. See the following example.
| Category | Weight | Points Earned | Weighted Score |
|---|---|---|---|
| Title Page | 3% | 40 | 1.2 |
| Project Description | 10% | 20 | 2.0 |
| Base Map | 37% | 30 | 11.1 |
| Route Evaluation Spreadsheet |
10% | 30 | 3.0 |
| Conclusions | 40% | 30 | 12.0 |
| Total Score | - | - | 27.3 out of 40 = 68% |
Summary and Final Tasks
In this lesson, you learned how to use the EPRI-GTC siting document and answered the critical questions for understanding how the siting process works. You also completed the siting of the a new transmission line using GIS and presented the information in the form of a background paper for management review and approval prior to the public meetings.
Reminder - Complete all of the lesson tasks!
You have finished Lesson 9. Double-check the list of requirements on the first page of this lesson to make sure you have completed all of the activities listed there before beginning the next lesson.
Tell us about it!
If you have anything you'd like to comment on, or add to, the lesson materials, feel free to post your thoughts in the Questions? Discussion Forum.