4.10 Walkthrough I: A Bus Track Analyzer for GPS Data of Dublin Buses
It is time to apply what we learned about writing classes, inheritance, and polymorphism in a larger project. In this walkthrough we are going to build an application that processes GPS tracks of buses to detect certain events like a bus being stopped for more than a minute, two buses encountering each other along their routes, etc. Such an application might be used by a public transportation manager to optimize schedules or be warned about irregularities occurring in a real-time tracking data stream. In the walkthrough code, we will be defining classes for real-world objects from the domain like a class Bus, a class Depot, etc. and for abstract concepts like a GPS point with timestamp information and for the events we are looking for. The classes for the different event types we are interested in will be organized into a hierarchy like the geometry classes in section 4.9.
The data we will be using for this project comes from Ireland’s open data portal [1]. The Dublin City Council has published bus GPS data across Dublin City [2] for November 2012 and January 2013 in the form of daily .csv files that list GPS points for active bus vehicles in chronological order with timestamps measured in microseconds since January 1st, 1970. This is a common way of measuring time called Unix or Posix time [3]. GPS measurements for an active vehicle appear in intervals of approximately 20 seconds in the data. The locations are given in WGS84 (EPSG:4326) latitude and longitude coordinates.
We extracted the bus data for 1.5 hours in the late evening of January 30 and morning of January 31, 2013 and cleaned it up a bit, filtering out some outliers and vehicles for which there were only a very small number of GPS points. We manually created a second input file with bounding box coordinates for a few bus depots in Dublin that we will need for detecting certain events and then combined the two input files with some other resources that we will need for this project and the actual source code consisting of several Python .py files. Please download the resulting .zip file [4] and extract it into a new folder.
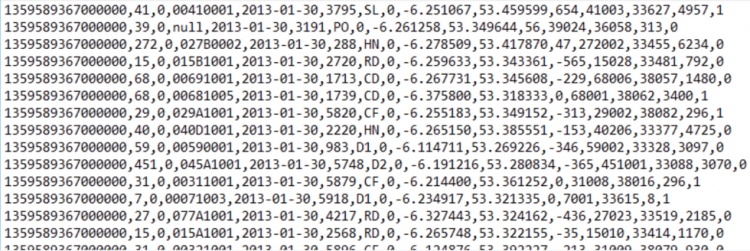
Have a quick look at the file dublin_bus_data.csv containing the bus GPS points. We are mainly interested in column 1 that contains the time information, column 6 that contains the ID of the bus vehicle, and columns 9 and 10 that contain the latitude and longitude coordinates. We will also use column 2 that contains the number of the line this bus belongs to, but only for information display.
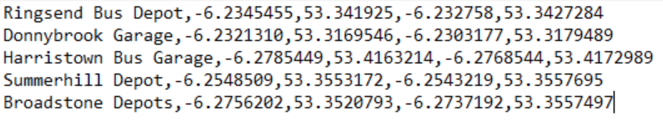
The file dublin_depots.csv contains the bus depot information with columns for the depot name and latitude-longitude pairs for the bottom left and top right corners of the bounding box as a rough approximation of the depot’s actual location and area.
In this walkthrough, we will focus on writing the code for the main classes needed for reading in the data, processing the data and detecting the events, and producing output vector data sets with the bus tracks and detected events. In addition, we will create a QT widget that displays the status of the different buses while the data is being processed. In the following optional part (Sections 4.11 and 4.12), we will further develop this project into a QGIS plugin that includes this widget and shows developing bus trajectories and detected events live as developing layers on the QGIS map canvas.
4.10.1 File and Class Structure of the Project
Since this project involves quite a bit of code, we have tried to cleanly organize it into different class definitions and multiple files. We don’t expect you to type in the code yourself in this walkthrough but rather study the files carefully and use the explanations provided in this text to make sure you understand how everything plays together. Here is an overview on what each of the involved files contains:
core_classes.py – This file contains most of the basic classes for our project that are not derived from other classes.
- class Timepoint: a Timepoint in this project will represent a point in space and time and is therefore defined by latitude and longitude properties which are both instance variables of type float and a time property that is an instance of the class datetime from the datetime module of the Python standard library (that you worked with in homework assignment 3). We will use Timepoints to represent the bus observations from the GPS data as well as events happening at a particular location at a particular time.
- class Bus: the class Bus represents a single vehicle appearing in the GPS data and its GPS points extracted from the input data. It is defined by its vehicle ID, the line it belongs to, and a list of chronologically-ordered Timepoints representing the GPS observation points read from the input data.
- class BusTracker: this class represents the current status of an individual bus vehicle during the analysis and event detection process. A BusTracker object will be maintained for each bus vehicle. It links to the corresponding object of class Bus and, in addition, is used to keep track of whether the vehicle’s status is currently “driving”, “stopped”, or “in depot”, of its current speed estimate, of the last Timepoint that has already been processed for this bus, and of some other information.
- class Observation: in the analysis stage of our program, we will maintain a priority queue (Section 4.2.3) in which we store the next observations for each bus. These observations need to be processed in order of their time of occurrence. The objects we are storing in this queue will be of class Observation that combines the BusTracker for the bus this observation is about, the Timepoint of this observation, and the index of that Timepoint in the list of Timepoints of the bus. Please note that the class has to define its own __lt__(...) method for the < comparison operator to achieve that the Obervation objects in the priority queue will be ordered based on their time attribute of the Timepoint object they contain.
- class Depot: the class Depot is used to represent a single bus depot, simply defined by its name and bounding box which is represented as a 4-tuple of floats as in the original input data in file dublin_depots.csv.
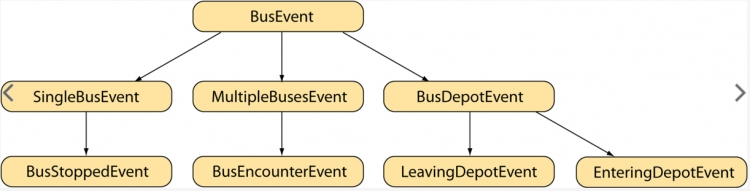
bus_events.py - This file defines the hierarchy of bus events starting with the abstract root class BusEvent from which we derive three more specialized (but still abstract) classes SingleBusEvent, MultipleBusesEvent, and BusDepotEvent. The classes for the events that we are actually trying to detect in the data are derived from these three intermediate classes. The overall bus event hierarchy is depicted in the figure below. We are keeping things somewhat simple here. One could certainly imagine other kinds of events that could be of interest and easily added to this hierarchy.
- class BusEvent: each bus event has an associated Timepoint. Therefore, the instance variable for this Timepoint object is already introduced in the abstract root class BusEvent. In addition, each bus event should have a method description() to produce a string with a brief description of the event suitable to be stored in an attribute table of a feature class, and a class function (Section 4.8) called detect(…) that takes an object of class Observation and checks whether the respective event occurs at this observation point and if so, creates and returns one or multiple event objects of that event class. We define templates for both these functions in BusEvent but they need to be overwritten by the derived subclasses.
- class SingleBusEvent: this class is intended as a superclass for all events involving just a single bus, so those that are entirely based on properties of the bus and its GPS data. The class adds an instance variable to refer to the Bus object this event is about.
- class MultipleBusesEvent: this class is the superclass for all bus events that involve two or more buses (like bus encounter events). It adds an instance variable for storing a list of Bus objects, namely those involved in the particular event.
- class BusDepotEvent: all event classes that involve a single bus and a bus depot are supposed to be derived from this intermediate class. It adds instance variables for the involved bus (class Bus) and involved depot (class Depot).
- class BusStoppedEvent: this is the first instantiable class in our hierarchy and it is derived from the SingleBusEvent class because it is only about the properties of an individual bus: when the given Timepoint on the bus doesn’t move more than 3 meters for at least a minute, we consider the bus to be stopped, generate an event of this class, and update the status of the BusTracker for this bus accordingly. This all happens in the function detect(…) that is overwritten in the definition of class BusStoppedEvent. This class adds another instance variable called duration for keeping track of how long the bus remained stopped.
- class BusEncounterEvent: this event derived from class MultipleBusesEvent represents situations in which two buses encounter each other along their routes. The detect(…) function overwritten in the class definition creates an event of this class if the given bus is observed within 20 meters of the last accounted position of another bus while both buses are “driving” (so not stopped and not currently in a depot).
- class LeavingDepotEvent: this class is derived from BusDepotEvent and an event of this class will be generated (again by the overwritten function detect(…)) if the bus still has the status “in depot” but for the given observation now is located outside any depot. The status of the corresponding BusTracker will be changed from “in depot” to “driving”.
- class EnteringDepotEvent: this is the counter part to LeavingDepotEvent for when a bus that still has the status “driving” now for the current observation is located inside one of the depots.
bus_track_analyzer.py – This file contains just a single class definition, the definition of class BusTrackAnalyzer that is our main class for performing the analysis and event detection over the data read in from the two input files. Its constructor takes two input parameters: a dictionary that maps a bus vehicle ID to the corresponding object of class Bus (created from the data from the GPS input file) and a list of Depot objects (created from the data in the depot input file). While its code could also have become the main program for this project, it is advantageous to have this all encapsulated into a class definition with methods for performing a single step of the analysis, resetting the analysis to start from the beginning, and for producing output vector data sets of the bus tracks created and the events detected so far. This way we can use this analyzer differently in different contexts and have full control over when and in which order the individual analysis steps and other actions will be performed. When we turn the project into a QGIS plugin in Section 4.12, we will make use of this by linking the methods of this class to a media player like control GUI with buttons for starting, pausing, and resetting the analysis. We will explain how this main class of the project works in more detail in a moment.
bus_tracker_widget.py – This file also defines just a single class, BusTrackerWidget, which is for visualizing the current status of the buses during the analysis and, therefore, is a bit of an optional component in this project to practice what you learned about drawing on a widget some more in this lesson. A BusTrackerWidget object is directly linked to a BusTrackAnalyzer object that is given to it as a parameter to the constructor. Whenever the content is supposed to be drawn, it accesses the analyzer object and, in particular, the list of BusTracker objects maintained there and depicts the status of the different buses as shown in the image below with each line representing one of the buses:
The class uses the three images from the files status_driving.png, status_indepot.png, and status_stopped.png to show the current status as an icon in the leftmost column of each row. This is followed by a colored circle depicting the vehicles current estimated speed using red for speeds below 15 mph, orange below 25 mph, yellow below 40 mph, and green for speeds larger than 40 mph. Then it displays the bus ID and line information followed by a short text description providing more details on the status like the exact speed estimate or the name of the depot the bus is currently located in. The widget also shows the time of the last processed observation in green at the top. We will discuss how this class has been implemented in more detail later in this section.
main.py – Lastly, this file contains the main program for this project in which we put everything together. Since most of the analysis functionality is implemented in class BusTrackAnalyzer and the detect(…) functions of the different bus event classes, this main program is comparatively compact. It reads in the data from the two input files, creates a BusTrackAnalyzer for the resulting Bus and Depot objects, and sets up a QWidget for a window that hosts an instance of the BusTrackerWidget class. When the main button in this QWidget is pressed, the run method is executed and processes the data step-by-step by iteratively calling the nextStep() method of the analyzer object until all observations have been processed. The method also makes sure that the BusTrackerWidget is repainted after each step so that we can see what is happening during the analysis. Finally, it saves the detected events and bus tracks as vector data sets on the disk.
4.10.2 Implementation Details
Now that you have a broad overview of the classes and files involved, let’s look at the code in more detail. The code is too long to explain every line and there are parts that should be easy to understand with the knowledge you have now and the comments included in the source code, so we will only be picking out the main points. Nevertheless, please make sure to study carefully the class definitions and how they work together, and if something is unclear, please ask on the forums.
4.10.2.1 Reading the Input Data
To study the interplay between the classes and implementation details, let us approach things in the order in which things happen when the main program in main.py is executed. After the main input variables like the paths for the two input files and a dictionary for the indices of the columns in the GPS input file have been defined in lines 15 to 21 of main.py, the first thing that happens is that the data is read in and used to produce objects of classes Bus and Depot for each bus vehicle and depot mentioned in the two input files.
The reading of the input data happens in lines 24 and 25 of main.py.
depotData = Depot.readFromCSV(depotFile)
busData = Bus.readFromCSV(busFile, busFileColumnIndices)
Both classes Bus and Depot provide class functions called readFromCSV(...) that given a filename read in the data from the respective input file and produce corresponding objects. For class Depot this happens in lines 112 to 120 of core_classes.py and the return value is a simple list of Depot objects created in line 119 with given name string and 4-tuple of numbers for the bounding box.
def readFromCSV(fileName):
         """reads comma-separated text file with each row representing a depot and returns list of created Depot objects.
            The order of columns in the file is expected to match the order of parameters and bounding box elements of the Depot class."""
         depots = []
         with open(os.path.join(os.path.dirname(__file__), fileName), "r") as depotFile:
             csvReader = csv.reader(depotFile, delimiter=',')
             for row in csvReader:                 # go through rows in input file
                 depots.append(Depot(row[0], (float(row[1]),float(row[2]),float(row[3]),float(row[4]))))  # add new Depot object for current row to Depot list
         return depots
For class Bus, this happens in lines 20 to 49 of core_classes.py and is slightly more involved. It works somewhat similarly to the code from the rhino/race car project in lesson 4 of GEOG485 in that it uses a dictionary to create Timepoint lists for each individual bus vehicle occurring in the data.
def readFromCSV(fileName, columnIndices):
        """reads comma-separated text file with each row representing a GPS point for a bus with timestamp and returns dictionary mapping
           bus id to created Bus objects. The column indices for the important info ('lat', 'lon', 'time', 'busID', 'line') need to be
           provided in dictionary columnIndices."""
        buses = {}

        with open(os.path.join(os.path.dirname(__file__), fileName), "r") as trackFile:
            csvReader = csv.reader(trackFile, delimiter=',')
            for row in csvReader:
                # read required info from current row
                busId = row[columnIndices['busId']]
                lat = row[columnIndices['lat']]
                lon = row[columnIndices['lon']]
                time = row[columnIndices['time']]
                line = row[columnIndices['line']]

                # create datetime object from time; we here assume that time in the csv file is given in microseconds since January 1, 1970
                dt = datetime.datetime(1970, 1, 1) + datetime.timedelta(microseconds=int(time))

                # create and add new Bus object if this is the first point for this bus id, else take Bus object from the dictionary
                if not busId in buses:
                    bus = Bus(busId, line)
                    buses[busId] = bus
                else:
                    bus = buses[busId]

                # create Timepoint object for this row and add it to the bus's Timepoint list
                bus.timepoints.append(Timepoint(dt,float(lat),float(lon)))

        	return buses  # return dictionary with Bus objects created
For each row in the csv file processed by the main for-loop in lines 28 to 47, we extract the content of the cells we are interested in, create a new datetime object based on the timestamp in that row, and then, if no bus with that ID is already contained in the dictionary we are maintaining in variable buses, meaning that this is the first GPS point for this bus ID in the file, we create a new Bus object and put it into the dictionary using the bus ID as the key. Else we keep working with the Bus object we have already stored under that ID in the dictionary. In both cases, we then add a new Timepoint object for the data in that row to the list of Timepoints kept in the Bus object (line 47). The dictionary of Bus objects is returned as the return value of the function. Having all Timepoints for a bus nicely stored as a list inside the corresponding Bus object will make it easy for us to look ahead and back in time to determine things like current estimated speed and whether the bus is stopped or driving at a particular point in time.
4.10.2.2 Setting up the BusTrackAnalyzer
Next, we create the BusTrackAnalyzer object to be used for the event detection in line 28 of main.py providing the bus dictionary and depot list as parameters to the constructor together with a list of class names for the bus event classes that we want the analyzer to detect. This list is defined in line 17 of main.py.
eventClasses = [ LeavingDepotEvent, EnteringDepotEvent, BusStoppedEvent, BusEncounterEvent ] # list of event classes to detect

...


# create main BusTrackAnalyzer object
analyzer = BusTrackAnalyzer(busData, depotData, eventClasses)
If you look at lines 12 to 21 of bus_track_analyzer.py, you will see that the constructor takes these parameters and stores them in its own instance variables for performing analysis steps later on (lines 16, 17 and 19).
def __init__(self, busData, depotData, eventClasses):
         self.allBusTrackers = []            # list of BusTracker objects for all buses currently being processed
         self.allEvents = []                 # used for storing all Event objects created during an analysis run
         self.lastProcessedTimepoint = None  # Timepoint of the last Observation that has been processed
         self._busData = busData             # dictionary mapping bus Id strings to Bus objects with GPS data
         self._depotData = depotData         # list of Depot objects used for Event detection
         self._observationQueue = []         # priority queue of next Observation objects to be processed for each bus
         self._eventClasses = eventClasses   # list of instantiable subclasses of BusEvent that should be detected

         self.reset()   # initialize variables for new analysis run
In addition, the constructor sets up some more instance variables that will be needed when the analysis is run: a list of bus trackers (one for each bus) in variable allBusTrackers, a list of events detected in variable allEvents, a variable lastProcessedTimepoint for the Timepoint of the last observation processed, and a list in variable _observationQueue that will serve as the priority queue of Observation objects to be processed next. Then in the last line, we call the method reset() of BusTrackAnalyzer defined in lines 23 to 40 whose purpose is to reset the value of these instance variables to what they need to be before the first analysis step is performed, allowing the analysis to be reset and repeated at any time.
def reset(self):
         """reset current analysis run and reinitialize everything for a new run"""
         self.allBusTrackers = []
         self.allEvents = []
         self.lastProcessedTimepoint = None
         self._observationQueue = []

         for busId, bus in self._busData.items():  # go through all buses in the data
             busTracker = BusTracker(bus)          # create new BusTracker object for bus

             # set initial BusTracker status to "IN DEPOT" if bus is inside bounding box of one of the depots
             isInDepot, depot = Depot.inDepot(bus.timepoints[0].lat, bus.timepoints[0].lon, self._depotData)
             if isInDepot:
                 busTracker.status = BusTracker.STATUS_INDEPOT
                 busTracker.depot = depot

             self.allBusTrackers.append(busTracker) # add new BusTracker to list of all BusTrackers
             heapq.heappush(self._observationQueue, Observation(busTracker, 0)) # create Observation for first Timepoint of this bus
                                                                                # and add to Observation priority queue
The main thing the method does is go through the dictionary with all the Bus objects and, for each, create a new BusTracker object that will be placed in the allBusTrackers list, set the initial status of that BusTracker to STATUS_INDEPOT if the first Timepoint for that bus is inside one of the depots (else the status will be the default value STATUS_DRIVING), and create an Observation object with that BusTracker for the first Timepoint from the Timepoint list of the corresponding bus that will be put into the observation priority queue via the call of the heapq.headpush(…) function (line 40). The image below illustrates how the main instance variables of the BusTrackAnalyzer object may look after this initialization for an imaginary input data set.
The buses with IDs 5, 2145, and 270 are the ones with earliest GPS observations in our imaginary data but there can be more busses that we are not showing in the diagram. We are also not showing all instance variables for each object, just the most important ones. Furthermore, Timepoint objects are shown as simple date + time values in the diagram not as objects of class Timepoint. The arrows indicate which objects the different instance variables contain starting with the _observationQueue, allBusTrackers, and allEvents instance variables of the single BusTrackAnalyzer object that we have.
The Bus objects at the top that contain the GPS data read from the input file will not change anymore and we are not showing here that these are actually maintained in a dictionary. The list of BusTracker objects (one for each Bus object) will also not change anymore but the properties of the individual BusTracker objects in it will change during the analysis. The observation queue list is the one that will change the most during the analysis because it will always contain the Observation objects to be processed ordered by the time point information. The event list is still empty because we have not detected any events yet.
4.10.2.3 Running the Analysis
The method nextStep() defined in lines 47 to 71 of bus_track_analyzer.py is where the main work of running a single step in the analysis, meaning processing a single observation, happens. In addition, the class provides a method isFinished() for checking if the analysis has been completed, meaning there are no more observations to be processed in the observation priority queue. Let us first look at how we are calling nextStep() from our main program:
    def run(self):
        """performs only a single analysis step of the BusTrackAnalyzer but starts a timer after each step to call the function again after a
           brief delay until the analzzer has finished. Then saves events and bus tracks to GeoPackage output files."""
        mainWidget.button.setEnabled(False) # disable button so that it can't be run again
        if not analyzer.isFinished():       # if the analyzer hasn't finished yet, perform next step, update widget, and start timer
                                            # to call this function again
            analyzer.nextStep()
            mainWidget.busTrackerWidget.updateContent()
            timer = QTimer()
            timer.singleShot(delay, self.run)
        else:                               # when the analyzer has finished write events and bus tracks to new GeoPackage files
            analyzer.saveBusTrackPolylineFile("dublin_bus_tracks.gpkg", "GPKG")
            analyzer.saveEventPointFile("dublin_bus_events.gpkg",  "GPKG")

            # reset analyzer and enable button again
            analyzer.reset()
            mainWidget.button.setEnabled(True)
The method run() in lines 47 to 63 of main.py is called when the “Run” button of our main window for the program is clicked. This connection is done in line 45 of main.py:
self.button.clicked.connect(self.run)
The idea of this method is that unless the analysis has already been completed, it calls nextStep() of the analyzer object to perform the next step (line 53) and then in lines 55 and 56 it starts a QT timer that will invoke run() again once the timer expires. That means run() will be called and executed again and again until all observations have been processed but with small delays between the steps whose length is controlled by variable delay defined in line 21. This gives us some control over how quickly the analysis is run allowing us to observe the changes in the BusTrackerWidget in more detail by increasing the delay value. To make this approach safe, the method first disables the Run button so that the timer is the only way the function can be invoked again.
Now let’s look at the code of nextStep() in more detail (lines 47 to 71 of bus_track_analyzer.py):
	def nextStep(self):
         """performs next step by processing Observation at the front of the Observations priority queue"""
         observation = heapq.heappop(self._observationQueue)           # get Observation that is at front of queue

         # go through list of BusEvent subclasses and invoke their detect() method; then collect the events produced
         # and add them to the allEvents lists
         for evClass in self._eventClasses:
             eventsProduced = evClass.detect(observation, self._depotData, self.allBusTrackers) # invoke event detection method
             self.allEvents.extend(eventsProduced)  # add resulting events to event list

         # update BusTracker of Observation that was just processed
         observation.busTracker.lastProcessedIndex += 1
         observation.busTracker.updateSpeed()

         if observation.busTracker.status == BusTracker.STATUS_STOPPED: # if  duration of a stopped event has just expired, change status to "DRIVING"
             if observation.timepoint.time > observation.busTracker.statusEvent.timepoint.time + observation.busTracker.statusEvent.duration:
                 observation.busTracker.status = BusTracker.STATUS_DRIVING
                 observation.busTracker.statusEvent = None

         # if this was not the last GPS Timepoint of this bus, create new Observation for the next point and add it to the Observation queue
         if observation.timepointIndex < len(observation.busTracker.bus.timepoints) - 1:  # not last point
             heapq.heappush(self._observationQueue, Observation(observation.busTracker, observation.timepointIndex + 1)  )

         # update analyzer status
         self.lastProcessedTimepoint = observation.timepoint
The code is actually simpler than one might think because the actual event detection is done in the bus event classes. The method does the following things in this order:
- Take next observation from queue: it takes the Observation object at the front of the _observationQueue priority queue out of the queue (line 49). This is the observation with the earliest timestamp that still needs to be processed. Remember that the Observation object consists of a BusTracker object and the observation Timepoint and its index.
- Call detect() function for all event classes: the method then goes through the list of event classes that contains the names of the four event classes making up the bottom level in our bus event hierarchy (see Figure 4.23 from Section 4.10.1 [5]) and for each calls the corresponding detect(…) class function (line 54) passing the Observation object as well as the list of depots and the list of all BusTracker objects as parameters, so that the event detection has all the information needed to decide whether an event of this kind is occurring for this observation. The event objects produced and returned as a list from calling detect(…) are then added to the list in allEvent (line 55).
- Update BusTracker: next, the BusTracker object for the current observation is updated to reflect that this Timepoint has been processed and we call its updateSpeed(…) method to compute a new speed estimate based on the current, previous, and next Timepoints for that bus. The code for this method can be found in lines 67 to 81 of core_classes.py and it uses the geopy function great_circle(…) to compute the distance between two WGS84 points. Since our bus event hierarchy does not include an event for when a stopped bus starts to move again, we need some place to change its BusTracker status to STATUS_DRIVING when this happens. This is done in lines 61 to 64 of this method.
- Put next Observation for this bus into queue: unless this observation was for the last Timepoint from the list of Timepoints for that bus, we now generate a new Observation object with the same BusTracker but for the next Timepoint from the Timepoints list and put this Observation into the priority queue (line 68). Since the queue is always kept sorted by observation time, it is guaranteed that all bus observation will be processed in the correct chronological order.
- Update analyzer status: finally, the lastProcessedTimepoint variable of the analyzer itself is updated to always provide the Timepoint of the last Observation processed (line 71).
To illustrate this process, let’s imagine we run the first analysis step for the initial situation from Section 4.10.2.2 with a bus that is not in one of the depots but is nevertheless stopped at the moment. The first Obervation object taken from the queue in step (1) then contains the BusTracker for the bus with ID 2145 and the Timepoint 2013/1/30 23:45:00.
In step(2), we first invoke the detect(…) function of the LeavingDepotEvent class because that is the first class appearing in the list. The code for this function can be found in lines 122 to 140 of bus_events.py.
def detect(observation, depots, activeBusTrackers):
        """process observation and checks whether this event occurs at the given observation. If yes, one or more instances of
           this Event class are created and returned as a list."""
        producedEvents = [] # initialize list of newly created events to be returned by this function

        if observation.busTracker.status == BusTracker.STATUS_INDEPOT:
            isInDepot, depot = Depot.inDepot(observation.timepoint.lat, observation.timepoint.lon, depots)  # test whether bus is still in a depot
            if not isInDepot: # bus not in depot anymore, so leaving depot event will be created and added to result list
                event =  LeavingDepotEvent(observation.timepoint, observation.busTracker.bus, observation.busTracker.depot)
                producedEvents.append(event)
                observation.busTracker.status = BusTracker.STATUS_DRIVING  # update BusTracker object to reflect detected new status
                observation.busTracker.statusEvent = None
                observation.busTracker.depot = None
                print("Event produced:", str(event))

        else:
            pass # nothing to do if bus is not in depot

        return producedEvents
The first thing tested there is whether or not the current status of the BusTracker is STATUS_INDEPOT which is not the case. Hence, we immediately return from that function with an empty list as the return value. If instead the condition would have been true, the code of this function would have checked whether or not the bus is currenctly still in a depot by calling the Depot.inDepot(...) function (line 128). If that would not be the case, an event object of this class would be created by calling the LeavingDepotEvent(...) constructor (line 130) and the status information in the corresponding BusTracker object would be updated accordingly (lines 132-135). The created LeavingDepotEvent object would be added to the list in variable producedEvents (line 131) that is returned when the end of the function is reached.
Next, this step is repeated with the detect(…) function from EnteringDepotEvent defined in lines 152 to 170 of bus_events.py. The condition that the bus should currently be driving is satisfied, so the code next checks whether or not the current position of the bus given by observation.timepoint.lat and observation.timepoint.lon (line 158) is inside one of the depots by calling the function inDepot(…) defined as part of the class definition of class Depot in lines 104 to 110 of core_classes.py. This is not the case, so again an empty event list is returned.
Next, detect(…) of the class BusStoppedEvent is called. This is most likely the most difficult to understand version of the detect(…) functions and it can be found in lines 35 to 65 of bus_events.py:
def detect(observation, depots, activeBusTrackers):
         """process observation and checks whether this event occurs at the given observation. If yes, one or more instances of
            this Event class are created and returned as a list."""
         producedEvents = []  # initialize list of newly created events to be returned by this function

         if observation.busTracker.status == BusTracker.STATUS_DRIVING:
             # look ahead until bus has moved at least 3 meters or the end of the Timepoint list is reached
             timeNotMoving = datetime.timedelta(seconds=0) # for keeping track of time the bus hasn't moved more than 3 meters
             distance = 0 # for keeping track of distance to original location
             c = 1 # counter variable for looking ahead
             while distance < 3 and observation.timepointIndex  + c < len(observation.busTracker.bus.timepoints):
                 nextTimepoint =  observation.busTracker.bus.timepoints[observation.timepointIndex  + c] # next Timepoint while looking ahead
                 distance = great_circle( (nextTimepoint.lat, nextTimepoint.lon), (observation.timepoint.lat, observation.timepoint.lon) ).m # distance to next Timepoint

                 if distance < 3:  # if still below 3 meters, update timeNotMoving
                     timeNotMoving = nextTimepoint.time - observation.timepoint.time

                 c += 1

             # check whether bus didn't move for at least 60 seconds and if so generate event
             if timeNotMoving.total_seconds() >= 60:
                 event =  BusStoppedEvent(observation.timepoint, observation.busTracker.bus, timeNotMoving)    # create stopped event
                 producedEvents.append(event)     # add new event to result list
                 observation.busTracker.status = BusTracker.STATUS_STOPPED    # update BusTracker object to reflect detected stopped status
                 observation.busTracker.statusEvent = event
                 print("Event produced: ", str(event))

         else:
             pass # no stop event will be created while bus status is "IN DEPOT" or "DRIVING"

         return producedEvents
The condition is again that the current BusTracker status is “driving” which is satisfied. The code will then run a while-loop that looks at the next Timepoints in the list of Timepoints for this bus until the distance to the current position gets larger than 3 meters. In this case, this only happens for the fifth Timepoint following the current Timepoint. The code then looks at the time difference between these two Timepoints (line 55) and if its more than 60 second, like in this case, creates a new object of class BusStoppedEvent (line 56) using the current Timepoint, Bus object from the BusTracker, and time difference to set the instance variables of the newly created event object. This event object is put into the event list that will be returned by the detect(…) function (line 57). Finally, the status of the BusTracker object involved will be changed to “stopped” (line 58) and we also store the event object inside the BusTracker to be able to change the status back to “driving” when the duration of the event is over (line 59). When we return from the detect(…) function, the produced BusStoppedEvent will be added to the allEvents list of the analyzer (line 55 of bus_track_analyzer.py).
Finally, detect(…) of BusEncounterEvent will be called, the last event class from the list. If you look at lines 83 to 102 of bus_events.py, you will see that a requirement for this event is that the bus is currently “driving”. Since we just changed the status of the BusTracker to “stopped” this is not the case and no events will be generated and returned from this function call. Just to emphasize this again, the details of how the different detect(...) functions work are less important here; the important thing to understand is that we are using the detect(...) functions defined in each of the bottom level bus event classes to test whether or not one (or even multiple) event(s) of that type occurred and if so generate an event object of that class with information describing that event by calling the constructor of the class (e.g., BusStoppedEvent(...)). Each created event object is added to the list that the detect(...) function returns to the calling nextStep(...) function. In the lesson's homework assignment you will have to use a similar approach but within a much less complicated project.
Now steps (3) –(6) are performed with the result that the lastProcessedIndex of the BusTracker is increased by one (to 1), a new estimated speed is computed for it, a new observation is created for bus 2145 and added to the queue, now for time point 2013/1/30 23:45:03. Since the first observation for bus 270 only has a timestamp of 23:45:05, the new Observation is inserted into the queue in second place after the first Observation for the bus with busId 5. Finally, the lastProcessedTimepoint of the analyzer is changed to 2013/1/30 23:45:00. The resulting constellation after this first run of nextStep() is shown in the image below.
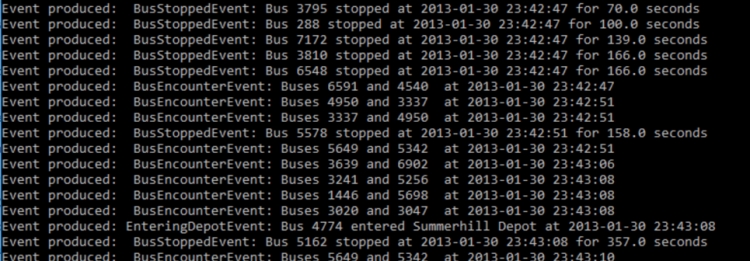
We have intentionally placed some print statements inside the bus event classes from bus_events.py whenever a new event of that class is detected and a corresponding object is created. Normally you wouldn’t do that but here we want to keep track of the events produced when running the main program. So test out the program by executing main.py (e.g., from the OSGeo4W shell after running the commands for setting the environment variables as described in Section 4.4.1) and just look at the output produced in the console, while still ignoring the graphical output in the window for a moment.
The produced output will start like this but list quite a few more bus events detected during the analysis:
4.10.2.4 Producing the output GPGK files
Remember that we said that the code from main.py will also produce output vector data sets of the bus tracks and events in the end. This happens in lines 57 to 63 of main.py which are only executed when analyzer.isFinished() returns True, so when the analysis has processed all observations:
        else:                               # when the analyzer has finished write events and bus tracks to new GeoPackage files
            analyzer.saveBusTrackPolylineFile("dublin_bus_tracks.gpkg", "GPKG")
            analyzer.saveEventPointFile("dublin_bus_events.gpkg",  "GPKG")

            # reset analyzer and enable button again
            analyzer.reset()
            mainWidget.button.setEnabled(True)
This code assumes that the QGIS environment has already been set up which happens in lines 69 to 73 of main.py; this code should look familiar from Section 4.5.3. The code for creating the output files can be found in the two methods saveBusTrackPolylineFile(…) and saveEventPointFile(…) of BusTrackAnalyzer in lines 73 to 114 of bus_track_analyzer.py.
def saveBusTrackPolylineFile(self, filename, fileFormat):
         """save event list as a WGS84 point vector dataset using qgis under the provided filename and using the given format. It is
            expected that qgis has been initalized before calling this method"""
         # create layer for polylines in EPSG:4326 and an integer field BUS_ID for storing the bus id for each track
         layer = qgis.core.QgsVectorLayer('LineString?crs=EPSG:4326&field=BUS_ID:integer', 'tracks' , 'memory')
         prov = layer.dataProvider()

         # create polyline features
         features = []
         for busId, bus in self._busData.items():
             # use list comprehension to produce list of QgsPoinXY objects from bus's Timepoints
             points = [ qgis.core.QgsPointXY(tp.lon,tp.lat) for tp in bus.timepoints ]
             feat = qgis.core.QgsFeature()
             lineGeometry = qgis.core.QgsGeometry.fromPolylineXY(points)
             feat.setGeometry(lineGeometry)
             feat.setAttributes([int(busId)])
             features.append(feat)

         # add features to layer and write layer to file
         prov.addFeatures(features)
         qgis.core.QgsVectorFileWriter.writeAsVectorFormat( layer, filename, "utf-8", layer.crs(), fileFormat)
saveBusTrackPolylineFile(…) creates a list of QgsPointXY objects from the Timepoints of each Bus object (line 105) and then creates a Polyline geometry from it (line 107) which is further turned into a feature with an attribute for the ID of the bus, and then added to the created layer in line 113. Finally, the layer is written to a new file using the name and format given as parameter to the function. We here use the GeoPackage format “GPKG” but this can easily be changed in main.py to produce, for instance, a shapefile instead.
	def saveEventPointFile(self, filename, fileFormat):
         """save event list as a WGS84 point vector dataset using qgis under the provided filename and using the given format. It is
            expected that qgis has been initalized before calling this method"""
         # create layer for points in EPSG:4326 and with two string fields called TYPE and INFO
         layer = qgis.core.QgsVectorLayer('Point?crs=EPSG:4326&field=TYPE:string(50)&field=INFO:string(255)', 'events' , 'memory')
         prov = layer.dataProvider()

         # create point features for all events from self.allEvents and use their Event class name
         # and string provided by description() method for the TYPE and INFO attribute columns
         features = []
         for event in self.allEvents:
             p =  qgis.core.QgsPointXY(event.timepoint.lon, event.timepoint.lat)
             feat = qgis.core.QgsFeature()
             feat.setGeometry(qgis.core.QgsGeometry.fromPointXY(p))
             feat.setAttributes([type(event).__name__, event.description()])
             features.append(feat)

         # add features to layer and write layer to file
         prov.addFeatures(features)
         qgis.core.QgsVectorFileWriter.writeAsVectorFormat( layer, filename, "utf-8", layer.crs(), fileFormat)
saveEventPointFile(…) works in the same way but produces QgsPointXY point features with the attribute fields TYPE and INFO for each event in the allEvents list. The TYPE field will contain the name of the event class this event is from, and the INFO field will contain the short description produced by calling the description() method of the event. Notice this just needs a single line (line 87) because of our event class hierarchy and polymorphism. When opening the two produced files in QGIS, adding a basemap, and adapting the symbology a bit, the result looks like this:
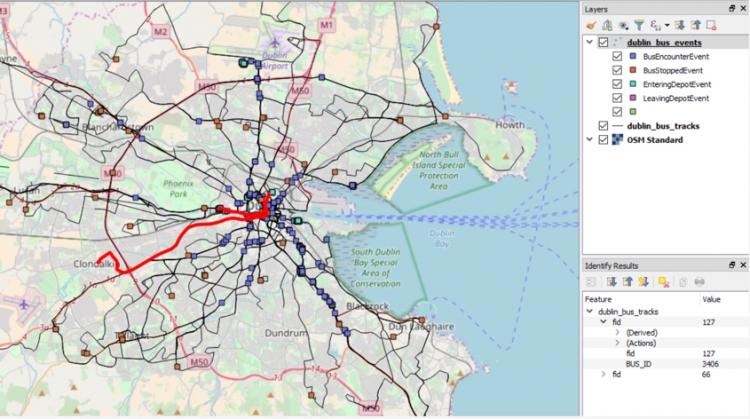
We hope the way this program works got clear from this explanation with (a) the BusTrackAnalyzer being the central class for running the event detection in a step-wise fashion, (b) the Observation objects maintained in a priority queue being used to process the GPS observation in chronological order, (c) the BusTracker objects being used to keep track of the current status of a bus during the analysis, and (d) the different bus event classes all providing their own function to detect whether or not an event of that type has occurred. The program is definitely quite complex but this is the last lesson so it is getting time to see some larger projects and learn to read the source code. As the final step, let's look at the BusTrackerWidget class that provides a visualization of event detection while the analysis process is running.
4.10.2.5 The Bus Tracker Widget for visualizing the analysis process
As we explained before, we also wanted to set up a QT widget that shows the status of each bus tracker while the data is being processed and we implemented the class BusTrackerWidget in bus_tracker_widget.py derived from QWidget for this purpose. In lines 30 to 44 of main.py we are creating the main window for this program and in line 41 we add an instance of BusTrackerWidget to the QScrollArea in the center of that window:
class MainWidget(QWidget):
     """main window for this application containing a button to start the analysis and a scroll area for the BusTrackerWidget"""
     def __init__(self, analyzer):
         super(MainWidget,self).__init__()
         self.resize(300,500)
         grid = QGridLayout(self)
         self.button = QPushButton("Run")
         grid.addWidget(self.button,0,0)
         self.busTrackerWidget = BusTrackerWidget(analyzer) # place BusTrackerWidget for our BusTrackAnalyzer in scroll area
         scroll = QScrollArea()
         scroll.setWidgetResizable(True)
         scroll.setWidget(self.busTrackerWidget)
         grid.addWidget(scroll, 1, 0)

         self.button.clicked.connect(self.run) # when button is clicked call run() function
We are embedding the widget in a QScrollArea to make sure that vertical and horizontal scrollbars will automatically appear when the content becomes too large to be displayed. For this to work, we only have to set the minimum width and height properties of the BusTrackerWidget object accordingly. Please note that in line 53 of main.py we are calling the method updateContent() of BusTrackerWidget so that the widget and its content will be repainted whenever another analysis step has been performed.
Looking at the definition of class BusTrackerWidget in bus_tracker_widget.py, the important things happen in its paintEvent(…) method in lines 24 to 85. Remember that this is the method that will be called whenever QT creates a paint event for this widget, so not only when we force this by calling the repaint() method but also when the parent widget has been resized, for example.
def paintEvent(self, event):
         """draws content with bus status information"""
         # set minimum dimensions basd on number of buses
         self.setMinimumHeight(len(self.analyzer.allBusTrackers) * 23 + 50)
         self.setMinimumWidth(425)

         # create QPainter and start drawing
         qp = QtGui.QPainter()
         qp.begin(self)

         normalFont = qp.font()
         boldFont = qp.font()
         boldFont.setBold(True)

         # draw time of last processed Timepoint at the top
         qp.setPen(Qt.darkGreen)
         qp.setFont(boldFont)
         if self.analyzer.lastProcessedTimepoint:
             qp.drawText(5,10,"Time: {0}".format(self.analyzer.lastProcessedTimepoint.time))
         qp.setPen(Qt.black)

         …
The first thing that happens in this code is that we set the minimum height property of our widget based on the number of BusTracker objects that we need to provide status information for (line 27). For the minimum width, we can instead use a fixed value that is large enough to display the rows. Next, we create the QPainter object needed for drawing (line 31 and 32) and draw the time of the last Timepoint processed by the analyzer to the top of the window (line 42) unless its value is still None.
	# loop through all BusTrackers in the BusTrackAnalyzer
        for index, tracker in enumerate(self.analyzer.allBusTrackers):
          ...
In the main for-loop starting in line 46, we go through the list of BusTracker objects in the associated BusTrackAnalyzer object and produce one row for each of them. All drawing operations in the loop body compute the y coordinate as the product of the index of the current BusTracker in the list available in variable index and the constant 23 for the height of a single row (e.g., 20 +23 * index in line 49 for drawing the bus status icon).
             # draw icon reflecting bus status
    	     qp.drawPixmap(5,20 + 23 * index,self._busIcons[tracker.status])

             # draw speed circles
             color = Qt.transparent
             if tracker.speedEstimate:
                 if tracker.speedEstimate < 15:
                     color = Qt.red
                 elif tracker.speedEstimate < 25:
                     color = QtGui.QColor(244, 176, 66)
                 elif tracker.speedEstimate < 40:
                     color = Qt.yellow
                 else:
                     color = Qt.green
             qp.setBrush(color)
             qp.drawEllipse(80, 23 + 23 * index, 7, 7)
             …
The bus status icon is drawn in line 49 using the drawPixmap(…) method with the QPixmap icon from the _busIcons dictionary for the given status of the bus tracker. Next, the small colored circle for the speed has to be drawn which happens in line 53. The color is determined by the if-elif construct in lines 53 to 61.
             # draw bus id and line text
             qp.setFont(boldFont)
             qp.drawText(100, 32 + 23 * index, tracker.bus.busId + "  [line "+tracker.bus.line+"]")

             # draw status and speed text
             qp.setFont(normalFont)
             statusText = "currently " + tracker.status
             if tracker.status == BusTracker.STATUS_INDEPOT:
                 statusText += " " + tracker.depot.name
             elif tracker.status == BusTracker.STATUS_DRIVING:
                 if not tracker.speedEstimate:
                     speedText = "???"
                 else:
                     speedText  = "{0:.2f} mph".format(tracker.speedEstimate)
                 statusText += " with " + speedText

             qp.drawText(200, 32 + 23 * index, statusText )
Next the bus ID and bus line number are drawn (line 66 and 67). This is followed by the code for creating the status information that contains some case distinctions to construct the string that should be displayed in line 81 in variable statusText based on the current status of the bus.
Now run the program, make the main window as large as possible and observe how the status information in the bus tracker widget is constantly updated like in the brief video below. Keep in mind that you can change the speed this all runs in by increasing the value of variable delay defined in line 21 of main.py. Refresher for running python scripts from the OSGeo4W Shell, you can use python-qgis-ltr, so e.g.
python-qgis-ltr main.py
The video has been recorded with a value of 5. [NOTE: This video (:58) does NOT contain sound.]
After developing the Bus Track Analyzer code as a standalone QGIS based application, we will now turn to the (optional) topic of creating QGIS plugins and how our analyzer code can be turned into a plugin that, as an extension, displays the bus trajectories and detected event live on the QGIS map canvas while the anaylsis is performed.