ARCHIVED - 2017.08.02
Overview
So far, you've learned how to create various types of web map layers and overlay them using OpenLayers. Simple mashups with "dots on a map" and a few popups may be all you need in many situations. In fact, some managers are thrilled to see these basic web maps if they have never visualized their data in geographic form before; however, as a student of GIS you'll want to be aware of additional possibilities to make the map layers more interactive or informative.
This lesson introduces you to a variety of "extra" things you can do to enrich the interactivity and information exposed by your web maps. Some of these features cannot be covered in full detail in this course; however, the concepts are introduced here in case you ever encounter them or need to use them in the workplace. During the lesson assignment, you'll have the opportunity to choose one of these techniques (or other FOSS of your choice) and explore it more fully.
A word of caution is necessary here: Just because you can do something doesn't mean that you should. Many of the best web maps are effective because they are focused and uncluttered. You'll see in this lesson that OpenLayers makes it easy to add all kinds of controls to your web maps, but before doing this, pause and determine whether the extra features are really needed. The same applies to WFS, WPS, widgets provided by web display frameworks, and other features mentioned in this lesson.
Objectives
- Implement techniques for data filtering and classification using OpenLayers.
- Describe OGC specifications for vector data editing (WFS) and geoprocessing (WPS) in web maps.
- Implement the layer switcher and other controls from OpenLayers according to application needs.
- Choose a web presentation framework such as Bootstrap and apply it to your OpenLayers applications.
- Query and display geographic attributes (including links to images and web pages) in your web map application.
- Learn and critically evaluate a new piece of FOSS GIS.
Checklist
- Read the Lesson 8 materials on this page.
- Complete the walkthrough.
- Complete the Lesson 8 assignment.
Symbolizing layers based on attribute values
Choropleth maps, proportional symbols maps, and on-the-fly feature filtering all provide alternative functionality to the typical "dots on a map" mashup. How can you achieve these things with OpenLayers? In this section of the lesson, we'll talk about how to create OpenLayers symbols based on attributes in your data. You can then apply these symbols to vectors to get various types of maps, such as choropleth maps based on class breaks.
First, it's important to be clear that symbolizing layers on the client using OpenLayers code is not the only way to achieve choropleth maps, proportional symbols, etc., on the web. Earlier in this course, you became familiar with dynamically drawn WMS maps defined by SLD styling, and tiled maps defined by CartoCSS. In these approaches, you do the cartography on the server rather than the client. Server-side maps are most appropriate for advanced cartographic effects. They may also result in better performance when hundreds or thousands of features are in play.
Why, then, are we discussing making our specialized maps with OpenLayers styles when so many other cartographic tools lie within reach? The reason is that defining symbols on the client opens the door to flexibility and interactivity.
- The flexibility comes because the data is separated from the styling; thus, you don't have to set up multiple web services in order to get multiple types of styling in your apps. Each app can define different styling rules in its client side code while utilizing the same source data.
- The interactivity comes from the ability to do re-classification and symbolization on the fly by invoking client-side code functions. For example, you could allow the user to switch from an equal interval classification to a quantile classification, or adjust the maximum size of a proportional symbol, all without making a return trip to the server or setting up additional web services.
Reading attributes in OpenLayers
In order to create a styling rule based on some attribute value, it's first necessary to read the attribute. How do you do this in OpenLayers?
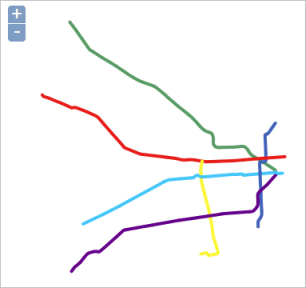
Let's consider a dataset that I downloaded from the Buenos Aires open data portal showing subway ("subte") lines. Each subway line is composed of many polyline segments. Each polyline segment has an attribute stating which subway line it belongs to (e.g., "LINEA B"). I've created a GeoJSON file out of this and I want to display it in a web map using unique colors for each subway line, like this:
First, let's take the easy case where the color value is directly coded into the attribute table. Notice the COLOR field below which contains color hex values for each line segment:
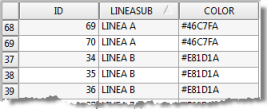
If you are fortunate enough to have this setup and the colors work for you, then you can apply them directly to a style map. In OpenLayers, you can use a special syntax "${<fieldName>}" to read an attribute value from a field named <fieldName>. Notice the code in bold below:
var geojson_layer = new OpenLayers.Layer.Vector("GeoJSON", {
   projection: new OpenLayers.Projection("EPSG:900913"),
   strategies: [new OpenLayers.Strategy.Fixed()],
   protocol: new OpenLayers.Protocol.HTTP({
      url: "red_de_subte.geojson",
      format: new OpenLayers.Format.GeoJSON()
   }),
   styleMap: new OpenLayers.StyleMap({
     'strokeWidth': 4,
     'strokeColor': '${COLOR}'
    })
	});
The above code creates a vector layer from the red_de_subte.geojson file (where "red" is the Spanish word for network, not the color red). To style the layer, the code reads the hex value from the COLOR field and inserts it in the style map for the strokeColor property. Notice how the syntax '${COLOR}' is utilized to read the color value.
Symbols for unique nominal attributes
Although the above technique is convenient, it's not always practical. What if the colors provided in the file aren't appropriate for your map? Fortunately, in our scenario, you could work around this by providing color values in your JavaScript (i.e., your client-side) code based on the name of the subway line.
Let's look at how you'd apply some style rules on the client side using OpenLayers. Examine the following variation on the code we viewed previously. This code produces the exact same map:
var subteStyleMap = new OpenLayers.StyleMap({
    'strokeWidth': 4
	});

	var lookup = {
      "LINEA A": {strokeColor: "#46C7FA"},
	  "LINEA B": {strokeColor: "#E81D1A"},
	  "LINEA C": {strokeColor: "#4161BA"},
	  "LINEA D": {strokeColor: "#599C65"},
	  "LINEA E": {strokeColor: "#65018A"},
	  "LINEA H": {strokeColor: "#FAF739"}
	}

	subteStyleMap.addUniqueValueRules("default", "LINEASUB", lookup);

	var geojson_layer = new OpenLayers.Layer.Vector("GeoJSON", {
	   projection: new OpenLayers.Projection("EPSG:900913"),
	   strategies: [new OpenLayers.Strategy.Fixed()],
	   protocol: new OpenLayers.Protocol.HTTP({
	      url: "red_de_subte.geojson",
	      format: new OpenLayers.Format.GeoJSON()
	   }),
	   styleMap: subteStyleMap
	});
The above example creates a basic style map defining a stroke width. Then it creates a simple JavaScript object called lookup to provide mappings between each subway line and its desired color. The important method addUniqueValueRules connects this lookup object with the style map. Notice that we're required to provide the name of the attribute we're looking up ("LINEASUB") as the second parameter of this method, but we don't have to use the ${<fieldName>} syntax anywhere.
Proportional symbols based on numeric attributes
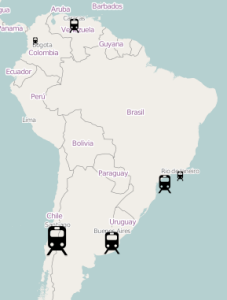
If you have a field with some numeric attribute, such as the length of a subway line or the number of riders per day, you may want to size the symbols proportionally so that big values are represented with a bigger symbol. Let's consider an example where we have a GeoJSON dataset showing statistics for some of South America's largest metro rail systems. You'll get more familiar with this dataset in the lesson walkthrough, but here's the basic attribute table and map:
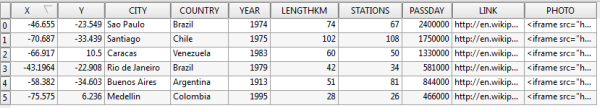
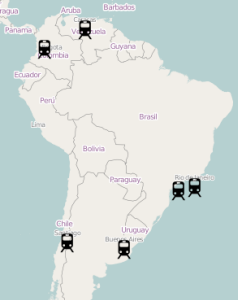
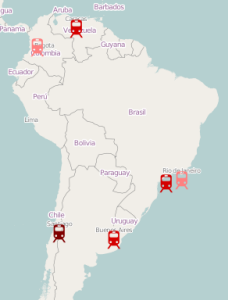
In the above image, the metro systems are all drawn using the same symbol. But let's suppose that you wanted to proportionally size the symbols so that the more stations in a metro system, the larger the map symbol. Notice the STATIONS attribute contains this information. The desired map would look something like the following:
Accomplishing the proportional symbols in OpenLayers requires you to define some mathematical function that will size each symbol based on each feature's attribute value for STATIONS. The syntax below is somewhat advanced, but pay attention to the line in bold which reads the value for STATIONS, divides it by 80, and multiplies it by 30 to derive the width and height in pixels for any given metro system symbol. These numbers signify that a metro system with 80 stations will have a symbol 30 pixels wide, a metro system with fewer stations will be less than 30 pixels, and a metro system with more stations will be greater than 30 pixels (the numbers 80 and 30, of course, are entirely arbitrary and could be adjusted to fit your own data):
var context = {
	   getSize: function(feature) {
	      return feature.attributes.STATIONS/80 * 30;
	   }
	};

	var template = {
	   externalGraphic: 'metro.svg',
	   graphicWidth: '${getSize}', // using context.getSize(feature)
	   graphicHeight: '${getSize}', // using context.getSize(feature)
	   graphicYOffset: 0
	};

	var metroStyle = new OpenLayers.Style(template, {context: context});
	var metroStyleMap = new OpenLayers.StyleMap({'default': metroStyle});

	// Define the metros GeoJSON layer
	var metroLayer = new OpenLayers.Layer.Vector("Metro lines", {
	   projection: toProjection,
	   strategies: [new OpenLayers.Strategy.Fixed()],
	   protocol: new OpenLayers.Protocol.HTTP({
	      url: "metro.geojson",
	      format: new OpenLayers.Format.GeoJSON()
	   }),
	   styleMap: metroStyleMap
	});
The other thing that's new to you here is the use of a template and a context when defining an OpenLayers style. This approach is useful if some of the characteristics of the feature will be determined on a case-by-base basis (in our situation, it is the graphicWidth and graphicHeight being defined this way). Our variable context contains a function getSize that reads an attribute value (STATIONS) from the current feature. This function is called at the time that the graphicWidth and graphicHeight are defined.
I derived the above example from a rather basic OpenLayers developer example for proportional symbols. Please take a look at the source code for that example to see how the above principles are applied in a slightly different situation.
Symbols for data classes based on numeric attributes
In some situations, it may be more appropriate to break up your numerical data into various classifications that are symbolized by graduated colors or some similar approach. This is especially true for line and polygon datasets that are sometimes harder to conceptualize using proportional symbols. The boundaries for your classes (in Esri software you may have heard these referred to as "class breaks") could be determined based on equal interval, quantile, Jenks, or some other arbitrary scheme.
For example, in the image below, metro systems with over 100 stations are symbolized using dark red. Systems with 50 to 100 stations are symbolized with red. Systems with fewer than 50 stations are symbolized with pink:
To symbolize data classes in OpenLayers, you define an OpenLayers.Rule for each class. Within each rule, you define filters that specify the upper and lower bounds of the class. The code can get complicated, because the OpenLayers rule system can be used for other kinds of queries. The code below defines the three classes used in our metro rail example. Each class references a different SVG symbol with its unique hue of red:
var metroStyle = new OpenLayers.Style(
	   // the first argument is a base symbolizer
	   // all other symbolizers in rules will extend this one
	   {
	      graphicWidth: 25,
	      graphicHeight: 25,
	      graphicYOffset: 0, // shift graphic up 28 pixels
	   },
	    // the second argument is the set of rules
	   {
	   rules: [
	      new OpenLayers.Rule(
	         {
	           filter: new OpenLayers.Filter.Comparison({
	            type: OpenLayers.Filter.Comparison.GREATER_THAN_OR_EQUAL_TO,
	            property: "STATIONS",
	            value: 100 }),
	            symbolizer: {"Point": {externalGraphic: 'metro_high.svg'}}
	         }),

	      new OpenLayers.Rule({filter: new OpenLayers.Filter.Logical({
	         type: OpenLayers.Filter.Logical.AND,
	         filters: [
	            new OpenLayers.Filter.Comparison({
	               type: OpenLayers.Filter.Comparison.LESS_THAN,
	               property: "STATIONS",
	               value: 100
	            }),
	            new OpenLayers.Filter.Comparison({
	               type: OpenLayers.Filter.Comparison.GREATER_THAN_OR_EQUAL_TO,
	               property: "STATIONS",
	               value: 50
	            })
	         ]
	         }),
	         symbolizer: {"Point": {externalGraphic: 'metro_medium.svg'}}
	      }),

	      new OpenLayers.Rule({filter: new OpenLayers.Filter.Comparison({
	         type: OpenLayers.Filter.Comparison.LESS_THAN,
	         property: "STATIONS",
	         value: 50
	         }),
	         symbolizer: {"Point": {externalGraphic: 'metro_low.svg'}}
	      }),
	      new OpenLayers.Rule({
	         // apply this rule if no others apply
	         elseFilter: true,
	         symbolizer: {
	            externalGraphic: "metro.svg"
	         }
	      })
	   ]
	   }
	);

	var metroStyleMap = new OpenLayers.StyleMap({'default': metroStyle});

	   // Define the metros GeoJSON layer
	var metroLayer = new OpenLayers.Layer.Vector("Metro lines", {
	   projection: toProjection,
	   strategies: [new OpenLayers.Strategy.Fixed()],
	   protocol: new OpenLayers.Protocol.HTTP({
	      url: "metro.geojson",
	      format: new OpenLayers.Format.GeoJSON()
	   }),
	   styleMap: metroStyleMap
	});
Although the above may look like a lot of code, notice that it is just following the pattern of defining and adding rules to the OpenLayers style. Notice that the rule for the middle classification (between 50 and 100 stations) has the most complex syntax because an upper and a lower bound must be defined. To accomplish this, two comparison filters are combined to make a logical filter.
If you intend to use a classification system such as Jenks, equal interval, quantile, etc., you must calculate the break values yourself (or find a library that does it) before defining the rules. You can either do this by hand or add more JavaScript code to calculate the values on the fly.
I derived the above code from two examples whose source code may also be of use to you:
- Internet Usage by Country, 2005 from crschmidt.net (Interestingly this map no longer appears on the page, but the still-useful code is there if you view the page source)
- OpenLayers developer example for rule-based styles
Ways to limit feature visibility based on attributes
In some situations, you may want to display only a subset of the features in a dataset, based on some attribute value or combination of values. (If you're familiar with Esri ArcMap, this is called a "definition query".) The OpenLayers.Rule classes that you learned about above come in handy for this.
Suppose you wanted to show only the metro systems whose COUNTRY attribute was coded as "Brazil":
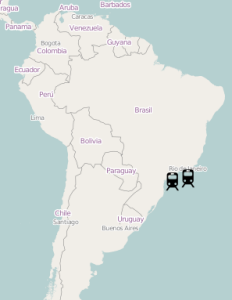
An OpenLayers rule for this, and its associated style, might look like the following:
var metroStyle = new OpenLayers.Style(
	   // the first argument is a base symbolizer
	   // all other symbolizers in rules will extend this one
	   {
	      graphicWidth: 25,
	      graphicHeight: 25,
	      graphicYOffset: 0, // shift graphic up 28 pixels
	   },
	    // the second argument is the set of rules
	   {
	   rules: [
	      new OpenLayers.Rule(
	         {
	           filter: new OpenLayers.Filter.Comparison({
	            type: OpenLayers.Filter.Comparison.EQUAL_TO,
	            property: "COUNTRY",
	            value: "Brazil" }),
	            symbolizer: {"Point": {externalGraphic: 'metro.svg'}}
	         })
	   ]
	   }
	);

	var metroStyleMap = new OpenLayers.StyleMap({'default': metroStyle});
The lines in bold are looking for features where the COUNTRY property is EQUAL_TO "Brazil". Note that the above example simply reads an attribute, it does not do a spatial query to find the bounds of Brazil, etc. (although OpenLayers does offer some spatial filters that are not covered in this course).
Now, let's look at a scenario with a numeric attribute. Suppose we wanted to show only the metro systems with over 75 stations:
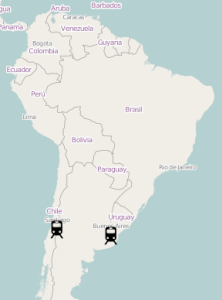
This could be accomplished with the following rule:
var metroStyle = new OpenLayers.Style(
	   // the first argument is a base symbolizer
	   // all other symbolizers in rules will extend this one
	   {
	      graphicWidth: 25,
	      graphicHeight: 25,
	      graphicYOffset: 0, // shift graphic up 28 pixels
	   },
	    // the second argument is the set of rules
	   {
	   rules: [
	      new OpenLayers.Rule(
	         {
	           filter: new OpenLayers.Filter.Comparison({
	            type: OpenLayers.Filter.Comparison.GREATER_THAN_OR_EQUAL_TO,
	            property: "STATIONS",
	            value: 75 }),
	            symbolizer: {"Point": {externalGraphic: 'metro.svg'}}
	         })
	   ]
	   }
	);
var metroStyleMap = new OpenLayers.StyleMap({'default': metroStyle});
Again, scrutinize the lines in bold to see a query for a STATIONS value that is GREATER_THAN_OR_EQUAL_TO 75.
Conclusion
OpenLayers offers a variety of options for symbolizing data on the client side based on attribute values. You should not feel limited to using the default symbology or a single symbol type for the entire layer.
Creating OpenLayers rules and styles can require some trial and error, along with some skillful debugging. You'll have more success if you start with a working example and tweak it piece by piece, frequently stopping to test your alterations. This section of the lesson is deliberately code-heavy so that you will have many examples available to get you started.
Spicing up your map with OpenLayers controls
Although OpenLayers does not offer a point-and-click interface for building a web application, it does give you many pre-coded "controls" that you can add to the map with just a line or two of code. These include a scale bar, overview map, layer switcher, pan and zoom buttons, geographic coordinates, and so on. The controls framework is extensible so you may even decide to pull in controls developed by others or, if you're feeling ambitious, code your own.
Take a look at the Map Controls Example page to get an idea of what some of these controls look like. I have expanded the layer switcher and the overview map in the image below, so you can get an idea of their appearance.
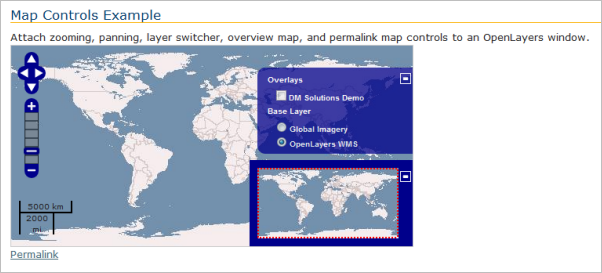
When you create an OpenLayers map, an invisible control is already included that allows you to do basic map navigation with the mouse (OpenLayers.Control.Navigation). If you want to change the set of controls, pass in a list of the desired controls when you instantiate the map object. All the controls in the example above were added using this code:
map = new OpenLayers.Map('map', {
	   controls: [
	      new OpenLayers.Control.Navigation(),
	      new OpenLayers.Control.PanZoomBar(),
	      new OpenLayers.Control.LayerSwitcher({'ascending':false}),
	      new OpenLayers.Control.Permalink(),
	      new OpenLayers.Control.ScaleLine(),
	      new OpenLayers.Control.Permalink('permalink'),
	      new OpenLayers.Control.MousePosition(),
	      new OpenLayers.Control.OverviewMap(),
	      new OpenLayers.Control.KeyboardDefaults()
	   ],
	   numZoomLevels: 6

	});
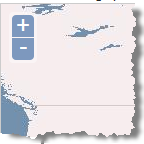
In your own maps, just use the list above as a starting point and add or remove the controls you want. Note that a control not listed above is OpenLayers.Control.Zoom(), which gives you some simple + and - buttons for zooming that look nice and are particularly suitable for mobile apps.
Although customizing the out-of-the-box OpenLayers controls is beyond the scope of this course, you should be aware that controls have a stylesheet you can tweak. Also, controls with images can be customized by substituting your own image. Examining the OpenLayers stylesheets and example stylesheets may help you understand which CSS properties to override when applying your customizations.
There is some useful further reading about controls in the OpenLayers documentation and Erik Hazzard's blog tutorial (although the example pages do not work). The best way to learn about controls is to experiment with them yourself and expand your functionality, bit by bit, using existing examples, documentation, and some trial and error.
In other web mapping APIs, controls may be called "widgets," "plugins," or other names. One reason OpenLayers was selected for use in Geog 585 was its mature offering of controls when compared to other FOSS frameworks.
WFS and editing vector data on the web
In Lesson 7, you saw some ways that vector data can be drawn by the web browser or client. The lesson focused on standalone KML and GeoJSON files, yet it is also possible for a web service to send the data to the client on request. The data can be in any format as long as both the server and the client are following the same specification. To standardize the process of sending vector data through web services, the Open Geospatial Consortium (OGC) has produced the Web Feature Service (WFS) specification.
You've already seen a related service, the WMS in previous lessons. How is WMS different from WFS? WMS involves the server sending a single map image, whereas WFS involves the server sending vector data as text to be drawn by the client. In simple terms, a WMS map is drawn by the server and a WFS map is drawn by the client.
WFS request and response formats
Like a WMS, a WFS supports a set of operations that typically take in parameters directly within the URL. These operations include GetCapabilities, DescribeFeatureType, and GetFeature. The GetFeature operation is the one that actually retrieves features.
Below is an example GetFeatures WFS request for the US state of Colorado (I picked something with a simple geometry). I adapted this from the Boundless WFS tutorial, which I highly recommend reading. See if you can guess what each parameters signifies, then click the link and view the response.
By examining the above URL parameters, you can see that a feature is requested from the WFS using version 1.1.0 of the WFS specification. The service is being hosted on GeoServer in a layer named states in the USA workspace. The feature with index 23 is returned.
A WFS returns data using Geography Markup Language (GML), a specification for expressing GIS data using XML. GML can contain both geometry and attribute information. Because it is based on XML and is designed to be flexible enough to handle many geographic feature types, GML is much more verbose (takes more text) than GeoJSON. Deep down in the GML for Colorado, you can find the geometry:
<gml:posList>37.48468400000007 -109.04348799999995 38.164690000000064 -109.04176199999989 38.27548899999999 -109.06006199999996 41.0006590000001 -109.05007599999999 41.00235900000007 -102.051717 36.993015999999955 -102.04208899999992 36.99908400000004 -109.0452229999999 37.48468400000007 -109.04348799999995</gml:posList>
You can also find attributes like this:
<usa:NAME10>Colorado</usa:NAME10>
The same type of request could be made to one of your own services running on GeoServer. Here's how I made a request for a Philadelphia neighborhood using one of the layers we published earlier in this course:
http://localhost:8080/geoserver/wfs?service=wfs&version=1.1.0&request=GetFeature&typename=geog585:Neighborhoods&featureid=Neighborhoods.12
The response looks like this and contains geometry and attributes for the Olney neighborhood:
<wfs:FeatureCollection numberOfFeatures="1" timeStamp="2014-03-03T15:07:31.822Z" xsi:schemaLocation="http://localhost:8080/geoserver/geog585 http://localhost:8080/geoserver/wfs?service=WFS&version=1.1.0&request=DescribeFeatureType&typeName=geog585%3ANeighborhoods http://www.opengis.net/wfs http://localhost:8080/geoserver/schemas/wfs/1.1.0/wfs.xsd"><gml:featureMembers><geog585:Neighborhoods gml:id="Neighborhoods.12"><geog585:the_geom><gml:MultiSurface srsDimension="2" srsName="urn:x-ogc:def:crs:EPSG:3857"><gml:surfaceMember><gml:Polygon srsDimension="2"><gml:exterior><gml:LinearRing srsDimension="2"><gml:posList>-8363968.786751106 4869301.13520122 -8363706.077778376 4871057.31164155 -8363880.846283749 4871132.918517317 -8363697.377540309 4872031.511981935 -8363780.660729433 4872179.806916264 -8363847.448310932 4872208.890548547 -8363802.926044645 4872557.878939522 -8363802.44449278 4872626.491915396 -8363025.915000884 4872530.247301338 -8361543.138729884 4872310.6731403675 -8361453.88028348 4872223.294811407 -8361493.045963939 4872015.489274301 -8361627.94355705 4871826.7318475135 -8361690.687270048 4871673.398417745 -8361627.94355705 4871403.748827802 -8361286.901117077 4870791.777211798 -8361326.368936536 4870458.7113405885 -8361498.408149585 4869986.8871721085 -8361555.111808623 4869831.380121785 -8362695.297708079 4869623.850560427 -8363168.406381819 4869548.2551895585 -8363968.786751106 4869301.13520122</gml:posList></gml:LinearRing></gml:exterior></gml:Polygon></gml:surfaceMember></gml:MultiSurface></geog585:the_geom><geog585:STATE>PA</geog585:STATE><geog585:COUNTY>Philadelphia</geog585:COUNTY><geog585:CITY>Philadelphia</geog585:CITY><geog585:NAME>Olney</geog585:NAME><geog585:REGIONID>214146.0</geog585:REGIONID></geog585:Neighborhoods></gml:featureMembers></wfs:FeatureCollection>
WFS servers and clients
Although the syntax for WFS requests and responses may look intimidating, you will rarely have to worry about composing this yourself. Various FOSS and proprietary software packages include support for viewing and serving WFS.
WFS servers
As shown in the above examples, GeoServer can expose your layers through WFS. This is enabled by default and requires no configuration on your part. Other FOSS GIS servers such as Map Server and Deegree support the creation of WFS web services.
In the proprietary realm, Esri ArcGIS for Server gives users the option to expose their web services through WFS; however, Esri has developed its own "feature service" that works through REST and accomplishes many of the same things as a WFS. Be aware that the Esri web mapping APIs and editing widgets are designed to work with the feature service rather than WFS. The communication patterns of the feature service are openly documented in the GeoServices REST Specification.
WFS clients
WFS is supported as a layer in some FOSS web mapping APIs including OpenLayers. For example, the OpenLayers site has examples for both viewing and editing using WFS. To add a WFS, you use the same OpenLayers.Layer.Vector class that you used in the previous lesson to add KML and GeoJSON. Only the protocol is different. The same Style and StyleMap classes are used for specifying the symbol for the features.
// Define a style
	styleMap = new OpenLayers.StyleMap({
	   strokeColor: "black",
	   strokeWidth: 2,
	   strokeOpacity: 0.5,
	   fillOpacity: 0.2
	});
// Create the layer
	var wfs = new OpenLayers.Layer.Vector("States", {
	   strategies: [new OpenLayers.Strategy.BBOX()],
	   protocol: new OpenLayers.Protocol.WFS({
	      version: "1.0.0",
	      srsName: "EPSG:4326",
	      url:  "http://demo.opengeo.org/geoserver/wfs",
	      featureType: "states",
	      featureNS: "http://www.openplans.org/topp"
	   }),
	   styleMap: styleMap
	});
	map.addLayer(wfs);
WFS support is not natively available in Leaflet and many other lightweight FOSS web mapping APIs. As mentioned above, Esri web mapping APIs are designed to work with the REST feature service rather than WFS.
On the desktop side, QGIS supports viewing and editing WFS. (Note: I got errors when trying to edit a WFS in QGIS, but I did not have a database or proxy host behind the layer.) Other FOSS clients such as uDig also recognize the WFS format. In Esri ArcMap, you use the Data Interoperability Extension to add WFS layers to the map (see "Connecting to a WFS Service").
Transactional WFS (WFS-T) and web-based editing
The WFS specification also defines rules for feature editing, opening the door to building clients that can edit geographic data over the web. A WFS enabled for editing is known as a transactional WFS, or WFS-T. Beyond the standard WFS operations such as GetFeature, WFS-T supports an additional operation called Transaction, and may also support operations for locking features to prevent concurrent edits.
Creating web editing applications requires both a server that can handle the incoming transactions and a client that provides visual support for the edit sketching, vertex manipulation, attribute entrance into text boxes, and so forth. Unless you're ready to write a lot of JavaScript, it's best to start with existing samples, widgets, or web controls. OpenLayers offers some basic buttons for sketching, modifying, deleting, and saving features. You can see them in action in this developer example.
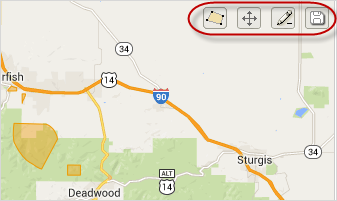
Take a look at the snippet below to see how these buttons are instantiated in the code:
var panel = new OpenLayers.Control.Panel({
	   displayClass: 'customEditingToolbar',
	   allowDepress: true
	});

	var draw = new OpenLayers.Control.DrawFeature(
	   wfs, OpenLayers.Handler.Polygon,
	   {
	      title: "Draw Feature",
	      displayClass: "olControlDrawFeaturePolygon",
	      multi: true
	   }
	);

	var edit = new OpenLayers.Control.ModifyFeature(wfs, {
	   title: "Modify Feature",
	   displayClass: "olControlModifyFeature"
	});

	var del = new DeleteFeature(wfs, {title: "Delete Feature"});

	var save = new OpenLayers.Control.Button({
	   title: "Save Changes",
	   trigger: function() {
	      if(edit.feature) {
	         edit.selectControl.unselectAll();
	      }
	      saveStrategy.save();
	   },
	&   displayClass: "olControlSaveFeatures"
	});

	panel.addControls([save, del, edit, draw]);
	map.addControl(panel);
Before you expose any dataset for editing over the web, you should carefully think through your quality control and data storage architectures. For example, perhaps you want to expose a copy of your database for web editing, then have an analyst review any changes before they are pushed to your master GIS database. If in-house editors are making changes to the master database, you'll also need a way to periodically push those to your web copy. In other cases, you may check incoming edits with a script to make sure they comply with certain topology rules or attribute schema requirements.
WPS and spatial data processing on the web
Both FOSS and proprietary GIS software offer spatial data processing functions such as buffer, union, contour, interpolate, and so on. You invoked some of these using QGIS and GDAL in earlier lessons. But what if you wanted to allow people to run these functions from a web browser? For example, suppose you wanted to allow users of your web map to draw a polygon and then see a calculation of the total population and number of health clinics within that polygon. You'd be able to expose the GIS to many people while only having to install GIS software and perform the spatial data processing on one machine: the server.
OGC has released a specification for invoking spatial data processing through web services. It's called the Web Processing Service (WPS) specification. Like the other OGC services you've learned about, it offers a set list of operations you can call. These are: GetCapabilities, DescribeProcess, and Execute. Of course, the Execute operation is the one that launches the request to actually perform the processing. The server's response contains the result. GML may be used to transfer information about vector features in either the request or the response.
As you are probably aware from running GDAL and ArcToolbox tools, spatial data processing functions can sometimes require many input parameters. For example, a buffer process might require you to specify the width of the buffer, whether it will be applied to both sides of the feature, whether the ends should be capped or rounded, etc. Each tool has its own set of parameters and syntax for describing them. Because the inputs can be so long and complex (especially if geometry is included), sometimes you can put the inputs in their own XML file and POST them to the server, rather than putting all the parameters into the URL as a GET request like you have seen with WMS and WFS in previous lessons. Some servers and browsers impost limits on the length of an HTTP GET request, whereas HTTP POST requests can typically be much longer.
The WPS spec itself doesn't say which types of spatial data processing operations a WPS must support; that's up to whoever builds and administers the service. There are hundreds of potential operations that can be included. When you first use a WPS, you can invoke the GetCapabilities operation to find out which processes are available.
WPS servers
GeoServer offers a WPS extension that exposes a set of spatial processes from the FOSS JTS Topology Suite, as well as some other processes developed specifically by GeoServer. We will not install this extension in this course, but I encourage you to browse through the documentation if you think that you may use it in your workplace or other academic work.
The Zoo Open WPS Platform and PyWPS are other examples of FOSS WPS implementations. In the proprietary realm, Esri ArcGIS for Server can serve a WPS from a ModelBuilder model that you create from ArcToolbox tools or scripts.
WPS clients
A few GUI-based WPS clients are available that allow you to select tools and supply their parameters in text boxes or dropdown lists. QGIS has a WPS plugin that works this way, allowing you to call a WPS from the desktop.
When it comes to invoking a WPS directly from a web application, some web map APIs offer helper classes or libraries that can help you. For example, to work with WPS in OpenLayers you use OpenLayers.WPSClient. When you instantiate this object, you supply the URL of the WPS server. You then set up JavaScript objects containing all the parameters of the process you want to invoke. Finally, you execute the process and specify what should be done with the results.
There are various ways of accomplishing these steps but below is a simple example that performs an intersection of two feature sets named "features" and "geometry". I adapted this from a more complex OpenLayers developer example available online.
// Create the WPSClient and supply the server URL
client = new OpenLayers.WPSClient({
	   servers: {
	      opengeo: 'http://demo.opengeo.org/geoserver/wps'
	   }
	});

	// Set up the required input parameters for the intersect
var features = [new OpenLayers.Feature.Vector(OpenLayers.Geometry.fromWKT(
	        'LINESTRING(117 22,112 18,118 13, 115 8)'
	    ))];
var geometry = OpenLayers.Geometry.fromWKT(
	   'POLYGON((110 20,120 20,120 10,110 10,110 20),(112 17,118 18,118 16,112 15,112 17))'
	);

	// Execute the process and add the results to the map
client.execute({
	   server: "opengeo",
	   process: "JTS:intersection",
	   // spatial input can be a feature or a geometry or an array of
	   // features or geometries
	   inputs: {
	      a: features,
	      b: geometry
	   },
	    success: function(outputs) {
	      // outputs.result is a feature or an array of features for spatial
	      // processes.
	      map.baseLayer.addFeatures(outputs.result);
	   }
	});
Even when you use a WPS client plugin, library, or object, you still need to be familiar with the process and its documentation, so that you can supply the correct syntax for the parameters. One mistake in syntax can derail the entire processing operation. Furthermore, WPS servers and clients are often either in the early stages or maturity or are designed for power users who are comfortable with a lack of a GUI and extensive documentation. Unless you already have some previous exposure to WPS, I do not recommend integrating it into your term project given the short amount of time that remains in the course.
JavaScript libraries and web presentation frameworks
Working with web pages is not always easy, especially when it's not your main area of expertise. Code for laying out the page, iterating through elements, toggling classes, etc., can get clunky and bloated in a hurry. Browsers can interpret the same pieces of HTML and JavaScript differently, and debugging the pages can be a mysterious process involving multiple code files and complex hierarchies of stylesheets and overrides.
There is no magic solution for these challenges; however, there are some JavaScript helper libraries that can simplify your life and your code if you make the effort to learn them. Your pages will probably also become more functional and attractive. Some of these libraries offer mainly back-end functions, others specialize in front-end elements, and others offer both.
JavaScript libraries
Many web developers like to use special JavaScript libraries that have been developed to simplify common functions and abstract away some of the idiosyncrasies between web browsers.
For example, if you select a few web pages at random and look at the source code, chances are pretty good that you'll see someone using the jQuery library. jQuery provides functions to simplify navigating and manipulating the DOM elements on your page. For example, using jQuery you can populate a dropdown list or change the CSS class of an HTML element on the fly without writing a bunch of HTML markup.
Similar alternatives to jQuery are Prototype and the Dojo toolkit, although the latter also offers some UI elements such as menus, buttons, and charts. All these libraries are build with the goal of simplifying JavaScript coding and reducing the work for you to handle differences between browsers.
Web presentation frameworks
In the previous lesson examples, you've learned how to embed your map in a web page. In the Lesson 7 walkthrough, you also briefly saw how to use the innerHtml property to manipulate a DOM element and thereby change a label on a page. But how do you craft a nice looking page around your map without devoting hundreds of hours to web design study? This is where a web presentation framework can come in handy.
Web presentation frameworks consist of JavaScript libraries, stylesheets, and "widgets" that work together to give you some convenient building blocks for nice looking pages. Some of these goodies include headers, buttons, calendar date pickers, menus, etc.
Web development frameworks are typically engineered so that your page works in a similar manner across browsers. They may also give you head start with making your page easily localizable (i.e., flexible enough to be offered in various languages such as Spanish, Arabic, Chinese, etc.).
Examples
An example of a popular web presentation framework is Bootstrap, distributed by the Twitter development team under an open source license. In the Lesson 8 walkthrough, you'll use Bootstrap to put a nice header on your application and divide your page into sections. You'll also get the benefit of the Bootstrap stylesheets.
Similar frameworks to Bootstrap include Groundwork, Zurb's Foundation, and Yahoo's Pure. The latter used to be called YUI (yoo'-ee) and this name is still often seen in the web world. Take a few minutes and follow some of the above links to see the different styles offered by these frameworks.
Some JavaScript libraries such as the Dojo toolkit and Ext JS also offer layout elements that serve a web design function. The project jQuery UI has some user interface elements such as buttons, menus, date pickers, etc., that are intended to complement the jQuery library.
You should be aware that web presentation frameworks sometimes require and use jQuery or other libraries to accomplish their functions.
Choosing a framework
When evaluating a web presentation framework for your project, you might consider:
- How easy is it to get started with the framework?
- How many online examples are available on the framework and is there an active community posting to forums, etc.?
- How easy is it to customize the framework if I don't like the default choices or examples?
- Is the framework hosted on a CDN or do I have to host it myself? Hosting yourself is often required anyway if you want to customize or slim down any portion of the framework, but it does take more work.
- What are the terms of use for this framework, including attribution and licensing requirements? Just like other kinds of software, there are FOSS frameworks and proprietary ones.
A web presentation framework can help produce a nicer end product than you might be able to concoct on your own; however, a framework also introduces another level of complexity. You may have to override some of the framework's stylesheets in order to get other libraries (like OpenLayers) to behave in the expected way. As an example, I have still not figured out how to get OpenLayers framed cloud popups to appear correctly in Bootstrap. Debugging such issues often involves multiple levels of stylesheets and a lot of time in the weeds. If you just need a very simple app, you might leave the framework aside and create your own stylesheet, or at least try to select the most simple framework available for the functionality you need.
Walkthrough: Thematic map with OpenLayers controls and Bootstrap framework
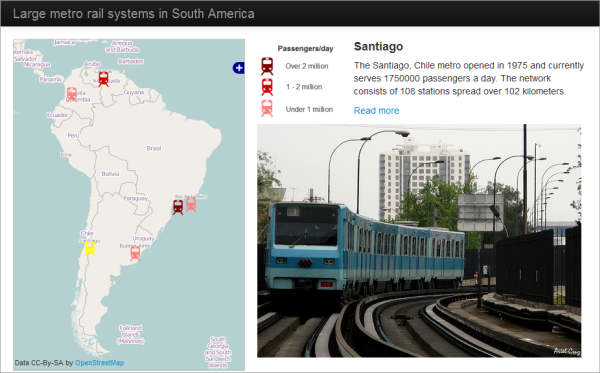
In this walkthrough, you'll put together some of the things you've learned in this lesson to make a well-rounded informational map containing thematic styling and OpenLayers controls. The map will use the Bootstrap web presentation framework so that it can be extended with supplementary content in an aesthetically pleasing way. You will construct some of this content on the fly by reading the attributes of selected map features.
For this exercise, we'll stick with the metro data from South America. The final application will allow users to click any metro and see some informational text and an image from Flickr. A static legend image is also brought into the layout.
Although this lesson is called "Going beyond 'dots on a map," I have deliberately chosen point data for this walkthrough so that you can appreciate the possibilities offered through OpenLayers, especially when tied together with other frameworks. Although you may not feel like a JavaScript guru at this point, you should at least know that you don't have to settle for the 'red teardrop and popup' mashups that you see all over the Internet.
Downloading the data and examining the layout
- Download the Lesson 8 walkthrough data and unzip it anywhere. If you like, you could place the files in your Jetty home folder, but the walkthrough does not use GeoServer and this is not required. The files include a legend image, the metro SVG images, and a GeoJSON file of metro locations and attributes. Also note that in a departure from previous walkthroughs, I've already supplied an HTML file containing the basic layout markup. We will examine some of the key pieces of the markup in the steps below. You'll also add some JavaScript to give this app some life.
- Open lesson8_walkthrough.html in a web browser and take a look. You should see the empty shell of the app with no map yet.
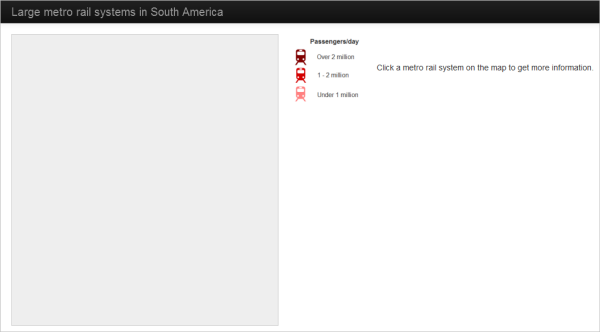 Figure 8.13.
 - Open lesson8_walkthrough.html in your favorite text editor and look over the HTML markup. The layout is based on this OpenLayers and Bootstrap example.
Before you add JavaScript, I will just point out a few things that are important in the layout. First, notice how Bootstrap is brought into the application through a reference to a JavaScript file (.js) and a CSS file (.css) in the bolded lines below. We are referencing the files from a CDN, but you could alternatively download and host (and tweak) them yourself.
<script src="http://code.jquery.com/jquery-latest.js"></script>
<script src="https://maxcdn.bootstrapcdn.com/bootstrap/2.2.1/js/bootstrap.min.js"></script>
<script src="http://cdnjs.cloudflare.com/ajax/libs/openlayers/2.12/OpenLayers.js"></script>
<link rel="stylesheet" href="https://maxcdn.bootstrapcdn.com/bootstrap/2.2.1/css/bootstrap.min.css">
Also take note of the stylesheet overrides in the <style> tag. If you don't like something about the Bootstrap (or OpenLayers) default styles, this is where you can apply a change. The override for olTiledImage is required for getting tiled maps to work with Bootstrap.
img.olTileImage {
	max-width: none;
}
In the page body, observe how classes are used to organize the page into navigation bars (navbar-*), containers (container-fluid), and spans. The span5 and span7 classes divide the page vertically so that consistent proportions of the page area are devoted to the map (on the left) and the supplementary material (on the right). Don't worry about understanding all these classes at this point. Just be aware that web development frameworks like Bootstrap, Dojo, etc., may give you CSS classes for organizing page elements in a way that should behave consistently across browsers.
Finally, note that the legend image and the "Click a metro..." text are organized into an HTML table to keep them flush. The table borders are invisible by design.
<table>
	<tr>
		<td><img src="metro_legend.png"/></td>
		<td id = 'summaryLabel'><p>Click a metro rail system on the map to get more information.</p></td>
	</tr>
</table>
A div awaits for a Flickr image, but this won't appear until someone clicks a metro symbol on the map.
<div id="metroImage"></div>
Now let's breathe some life into this app by adding some JavaScript code.
Adding the JavaScript logic
You'll use JavaScript to do three main things in this application: add the map, define the symbols, and handle the click events. Let's address these in order.
-
In your lesson8_walkthrough.html, find the script tags. You'll put all your code immediately after: <script type="text/javascript">. Unless otherwise stated, just paste all these blocks of code immediately after the previous one.
-
Add the following lines of code to create the map and controls:
var fromProjection = new OpenLayers.Projection('EPSG:4326'); // transform from WGS 1984
var toProjection = new OpenLayers.Projection('EPSG:900913'); // to Spherical Mercator Projection
var map;

function init() {

  // Create map and add controls
  map = new OpenLayers.Map('map', {
    projection:toProjection,
    controls:[
      new OpenLayers.Control.Navigation(),
      new OpenLayers.Control.LayerSwitcher({'ascending':false}),
      new OpenLayers.Control.Attribution()
    ]
  });
Notice that we're adding a layer switcher control that will allow the user to toggle layers on and off, as well as an attribution control which will show copyright text. Because we started defining a list of controls, we also have to explicitly list the navigation control, even though this one typically comes by default. The navigation is not the zoom bar and pan buttons; it's just the ability to navigate the map. -
Add the following lines of code to add some basemap options:
// Add the available basemaps. Only one will appear at a time.
// Basic OSM from Mapnik renderer
map.addLayer(new OpenLayers.Layer.OSM('Mapnik'));

// Stamen toner style
map.addLayer(new OpenLayers.Layer.OSM('Stamen toner',
  ['http://tile.stamen.com/toner/${z}/${x}/${y}.png'],
  {attribution: "© <a href='http://www.openstreetmap.org/'>OpenStreetMap</a> and contributors, under an <a href='http://www.openstreetmap.org/copyright' title='ODbL'>open license</a>. Toner style by <a href='http://stamen.com'>Stamen Design</a>",
  "tileOptions": { "crossOriginKeyword": null }}));
Although you're defining all these layers, OpenLayers knows that they're OpenStreetMap base maps, so it will just display one at a time. The layer switcher control will detect these and allow users to toggle between the base maps.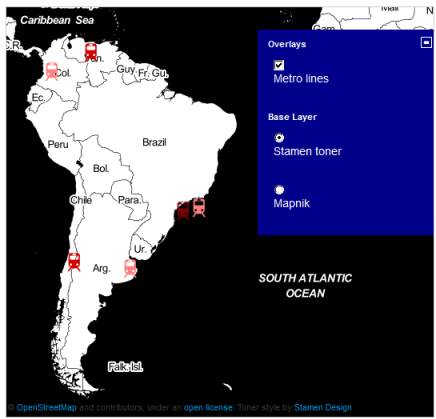 Figure 8.14.
The above code looks intimidating, but examine it for a minute and you will see that it's just defining URLs where the tiles can be retrieved, as well as the attribution text to display below the map. I derived this from Harry Wood's example which has a few other map options of interest (some don't seem to work any more).
-
Add the following code to style the metro symbols based on number of passengers served per day.
// Set up classified style rules for metro symbols
  var metroStyle = new OpenLayers.Style({
    graphicWidth: 25,
    graphicHeight: 25,
    graphicYOffset: 0,
  },
  {
    rules: [
      // Rule for over 2000000 passengers a day
      new OpenLayers.Rule({
        filter: new OpenLayers.Filter.Comparison({
        type: OpenLayers.Filter.Comparison.GREATER_THAN_OR_EQUAL_TO,
        property: 'PASSDAY',
        value: 2000000 }),
        symbolizer: {'Point': {externalGraphic: 'metro_high.svg'}}
      }),

      // Rule for 1000000 - 2000000 passengers a day
      new OpenLayers.Rule({filter: new OpenLayers.Filter.Logical({
        type: OpenLayers.Filter.Logical.AND,
        filters: [
        new OpenLayers.Filter.Comparison({
          type: OpenLayers.Filter.Comparison.LESS_THAN,
          property: 'PASSDAY',
          value: 2000000
            }),
            new OpenLayers.Filter.Comparison({
              type: OpenLayers.Filter.Comparison.GREATER_THAN_OR_EQUAL_TO,
              property: 'PASSDAY',
              value: 1000000
              })
            ]
          }),
        symbolizer: {'Point': {externalGraphic: 'metro_medium.svg'}}
      }),

      // Rule for under 1000000 passengers a day
      new OpenLayers.Rule({filter: new OpenLayers.Filter.Comparison({
          type: OpenLayers.Filter.Comparison.LESS_THAN,
          property: 'PASSDAY',
          value: 1000000
        }),
        symbolizer: {'Point': {externalGraphic: 'metro_low.svg'}}
      }),

      // Rule for catching errors only. Applied if no other rules apply.
      new OpenLayers.Rule({
        elseFilter: true,
        symbolizer: {
            externalGraphic: 'metro.svg'
        }
    })]
  });
This code is very similar to code that you saw earlier in the lesson. It uses OpenLayers filters to define three classes, then places the feature into one of those classes based on the attribute value it reads for PASSDAY. A different colored SVG file is used for each class. -
Add the following code to define the selection symbol and complete the style map:
// Yellow symbol for selected metros
  var selectedMetroStyle = new OpenLayers.Style({
    externalGraphic: 'metro_selected.svg',
      graphicWidth: 25,
      graphicHeight: 25,
      graphicYOffset: 0
  });

  var metroStyleMap = new OpenLayers.StyleMap({'default': metroStyle, 'select': selectedMetroStyle});
This code sets a yellow graphic metro_selected.svg as the style to use when the metro layer is clicked. It then assembles the default metro style and the selection style into a single stylemap called metroStyleMap. -
Add the following code to create the metro vector layer and add it to the map:
// Define the metros GeoJSON layer
  var metroLayer = new OpenLayers.Layer.Vector('Metro lines', {
    projection: toProjection,
    strategies: [new OpenLayers.Strategy.Fixed()],
    protocol: new OpenLayers.Protocol.HTTP({
        url: 'metro.geojson',
        format: new OpenLayers.Format.GeoJSON()
    }),
    styleMap:metroStyleMap
  });

  // Add the metro layer and center the map
  map.addLayer(metroLayer);
  map.setCenter(new OpenLayers.LonLat(-60, -25).transform(fromProjection,toProjection), 3);
You should be familiar with this code from from other sections in this lesson and Lesson 7. Note the reference to metro.geojson and the use of the metroStyleMap. -
Add the following code to place the selection control in the application:
// Listen for feature selection and unselection events.
  selectControl = new OpenLayers.Control.SelectFeature([metroLayer], {
    onSelect: onFeatureSelect,
    onUnselect: onFeatureUnselect
  });

  map.addControl(selectControl);
  selectControl.activate();
The selection control just gives you a head start if you want to change a symbol or perform some event when a feature is clicked. You won't have to write any special code listening for click events or toggling symbols, because this control will do it for you. You just have to write a couple of functions defining what will happen when selection and unselection occur. These functions are supplied in the next two steps. -
Add the following code to handle the feature selection event. This is what constructs the HTML on the right hand side of the page, including bringing in the Flickr image:
// Handle the feature selection event by reading attributes and constructing HTML
  function onFeatureSelect(feature){
    // Read the feature's attributes and set fallback text if no attribute is returned
    var featureName = feature.attributes.CITY || 'Unnamed feature';
    var country = feature.attributes.COUNTRY || '(Unknown)';
    var year = feature.attributes.YEAR || '(Unknown)';
    var passengers = feature.attributes.PASSDAY || '(Unknown)';
    var stations = feature.attributes.STATIONS || '(Unknown)';
    var length = feature.attributes.LENGTHKM || '(Unknown)';
    var link = feature.attributes.LINK || 'http://www.wikipedia.org';

    // Using attributes, construct some HTML to write into the page
    var photoHtml = feature.attributes.PHOTO || '<P>Photo not available</P>';
    var titleHtml = '<p style="font-size:18px"><b>' + featureName + '</b></p>';
    var descripHtml = '<p>The ' + featureName + ', ' + country + ' metro opened in ' + year + ' and currently serves ' + passengers + ' passengers a day. The network consists of ' + stations + ' stations spread over ' + length + ' kilometers.</p>';
    var readmoreHtml = '<p><a href="' + link + '">Read more</a></p>';
    document.getElementById('summaryLabel').innerHTML = titleHtml + descripHtml + readmoreHtml;
    document.getElementById('metroImage').innerHTML = photoHtml;
  }
The function starts out by reading a bunch of attributes from the metro.geojson file for the selected feature. Recall that the attribute table looks like this:
Figure 8.15.You should notice many of these attribute field names referenced in the code above. The field value is retrieved, using some special syntax | | to set a fallback value in case no attribute comes back. The rest of the function constructs some HTML strings, inserting the attributes where appropriate. After the HTML strings are constructed, the innerHTML is updated for the elements "summaryLabel" and "metroImage." This causes the new text and the photo to appear on the right side of the page. The PHOTO field deserves some additional discussion here. Anticipating that this field would be used to embed a photo in an app, the entire iframe HTML code is placed in this field as a long string. Where do you get this code if you want to make a dataset like this? Right from the Flickr embed functionality:
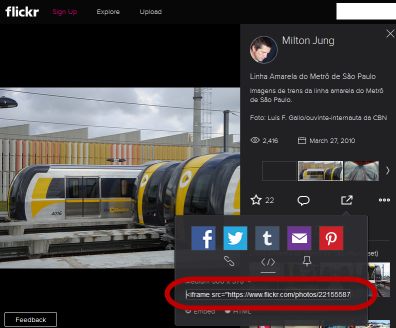 Figure 8.16.
 -
Add the following code to handle the feature unselection event:
  // Handle the feature unselection event
			  function onFeatureUnselect(feature){
			    // Set the HTML back to what it was before
			    document.getElementById('summaryLabel').innerHTML = '<p>Click a metro rail system on the map to get more information.</p>';
			    document.getElementById('metroImage').innerHTML = ''
			  }
}
This code just clears out the HTML from the right-hand side of the page in anticipation that the user will make a different selection. -
Test the application by opening lesson8_walkthrough.html in a web browser. (If you're just opening the HTML file directly from the file system, I recommend using Firefox to test. This is because the cross-origin request security implementations in Chrome and Internet Explorer only allow the GeoJSON to load if you're hosting both the HTML and GeoJSON files on a web server.)
You should be able to switch between different base layers (note that the Map Quest open layer shown below is no longer available). Click a metro icon to see the highlighted symbol, the Flickr image, and the descriptive text.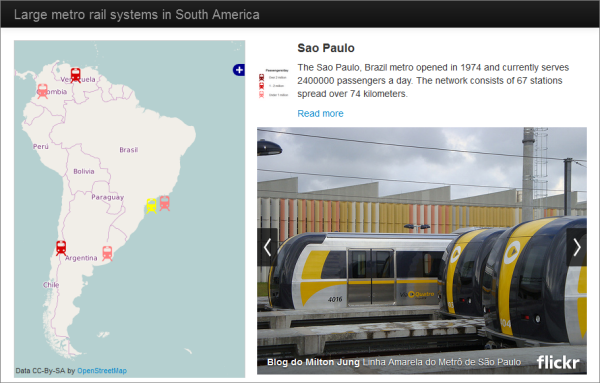 Figure 8.17.
Final code for the walkthrough
If the walkthrough does not function, check to ensure you are connected to the Internet and that your code matches the code below:
<!DOCTYPE html>
<html>
  <head>
    <meta http-equiv="Content-Type" content="text/html; charset=utf-8">
    <meta name="viewport" content="width=device-width, initial-scale=1.0, maximum-scale=1.0, user-scalable=0">
    <meta name="apple-mobile-web-app-capable" content="yes">
    <title>Large metro rail systems in South America</title>
    <script src="http://code.jquery.com/jquery-latest.js"></script>
    <script src="https://maxcdn.bootstrapcdn.com/bootstrap/2.2.1/js/bootstrap.min.js"></script>
    <script src="http://cdnjs.cloudflare.com/ajax/libs/openlayers/2.12/OpenLayers.js"></script>
    <link rel="stylesheet" href="https://maxcdn.bootstrapcdn.com/bootstrap/2.2.1/css/bootstrap.min.css">
    <style>
        body {
            padding-top: 60px;
            padding-bottom: 40px;
        }
        #map {
            height: 512px;
            background-color: #eee;
            border: 1px solid #CCCCCC;
        }
        img.olTileImage {
            max-width: none;
        }
        div.olControlAttribution {
          left:2px;
          bottom:2px;
        }
    </style>
    <script type="text/javascript">

      var fromProjection = new OpenLayers.Projection('EPSG:4326'); // transform from WGS 1984
      var toProjection = new OpenLayers.Projection('EPSG:900913'); // to Spherical Mercator Projection
      var map;

      function init() {
         // Create map and add controls
         map = new OpenLayers.Map('map', {
            projection:toProjection,
            controls:[
               new OpenLayers.Control.Navigation(),
               new OpenLayers.Control.LayerSwitcher({'ascending':false}),
               new OpenLayers.Control.Attribution()
            ]
         });

         // Add the available basemaps. Only one will appear at a time.
         // Basic OSM from Mapnik renderer
         map.addLayer(new OpenLayers.Layer.OSM('Mapnik'));

         // Stamen toner style
         map.addLayer(new OpenLayers.Layer.OSM('Stamen toner',
           ['http://tile.stamen.com/toner/${z}/${x}/${y}.png'],
            {attribution: "© <a href='http://www.openstreetmap.org/'>OpenStreetMap</a> and contributors, under an <a href='http://www.openstreetmap.org/copyright' title='ODbL'>open license</a>. Toner style by <a href='http://stamen.com'>Stamen Design</a>",
            "tileOptions": { "crossOriginKeyword": null }}));

         // Set up classified style rules for metro symbols
         var metroStyle = new OpenLayers.Style({
           graphicWidth: 25,
           graphicHeight: 25,
           graphicYOffset: 0,
         },
         {
           rules: [
             // Rule for over 2000000 passengers a day
             new OpenLayers.Rule({
               filter: new OpenLayers.Filter.Comparison({
               type: OpenLayers.Filter.Comparison.GREATER_THAN_OR_EQUAL_TO,
               property: 'PASSDAY',
               value: 2000000 }),
               symbolizer: {'Point': {externalGraphic: 'metro_high.svg'}}
             }),

             // Rule for 1000000 - 2000000 passengers a day
             new OpenLayers.Rule({filter: new OpenLayers.Filter.Logical({
                 type: OpenLayers.Filter.Logical.AND,
                 filters: [
                   new OpenLayers.Filter.Comparison({
                     type: OpenLayers.Filter.Comparison.LESS_THAN,
                       property: 'PASSDAY',
                       value: 2000000
                   }),
                   new OpenLayers.Filter.Comparison({
                     type: OpenLayers.Filter.Comparison.GREATER_THAN_OR_EQUAL_TO,
                       property: 'PASSDAY',
                       value: 1000000
                   })
                 ]
               }),
               symbolizer: {'Point': {externalGraphic: 'metro_medium.svg'}}
             }),

             // Rule for under 1000000 passengers a day
             new OpenLayers.Rule({filter: new OpenLayers.Filter.Comparison({
                 type: OpenLayers.Filter.Comparison.LESS_THAN,
                 property: 'PASSDAY',
                 value: 1000000
               }),
               symbolizer: {'Point': {externalGraphic: 'metro_low.svg'}}
             }),

             // Rule for catching errors only. Applied if no other rules apply.
             new OpenLayers.Rule({
               elseFilter: true,
               symbolizer: {
                   externalGraphic: 'metro.svg'
               }
           })]
         });

         // Yellow symbol for selected metros
         var selectedMetroStyle = new OpenLayers.Style({
           externalGraphic: 'metro_selected.svg',
             graphicWidth: 25,
             graphicHeight: 25,
             graphicYOffset: 0
         });

         var metroStyleMap = new OpenLayers.StyleMap({'default': metroStyle, 'select': selectedMetroStyle});

         // Define the metros GeoJSON layer
         var metroLayer = new OpenLayers.Layer.Vector('Metro lines', {
           projection: toProjection,
           strategies: [new OpenLayers.Strategy.Fixed()],
           protocol: new OpenLayers.Protocol.HTTP({
               url: 'metro.geojson',
               format: new OpenLayers.Format.GeoJSON()
           }),
           styleMap:metroStyleMap
         });

         // Add the metro layer and center the map
         map.addLayer(metroLayer);
         map.setCenter(new OpenLayers.LonLat(-60, -25).transform(fromProjection,toProjection), 3);

         // Listen for feature selection and unselection events.
         selectControl = new OpenLayers.Control.SelectFeature([metroLayer], {
           onSelect: onFeatureSelect,
           onUnselect: onFeatureUnselect
         });

         map.addControl(selectControl);
         selectControl.activate();

         // Handle the feature selection event by reading attributes and constructing HTML
         function onFeatureSelect(feature){
           // Read the feature's attributes and set fallback text if no attribute is returned
           var featureName = feature.attributes.CITY || 'Unnamed feature';
           var country = feature.attributes.COUNTRY || '(Unknown)';
           var year = feature.attributes.YEAR || '(Unknown)';
           var passengers = feature.attributes.PASSDAY || '(Unknown)';
           var stations = feature.attributes.STATIONS || '(Unknown)';
           var length = feature.attributes.LENGTHKM || '(Unknown)';
           var link = feature.attributes.LINK || 'http://www.wikipedia.org';

           // Using attributes, construct some HTML to write into the page
           var photoHtml = feature.attributes.PHOTO || '<P>Photo not available</P>';
           var titleHtml = '<p style="font-size:18px"><b>' + featureName + '</b></p>';
           var descripHtml = '<p>The ' + featureName + ', ' + country + ' metro opened in ' + year + ' and currently serves ' + passengers + ' passengers a day. The network consists of ' + stations + ' stations spread over ' + length + ' kilometers.</p>';
           var readmoreHtml = '<p><a href="' + link + '">Read more</a></p>';
           document.getElementById('summaryLabel').innerHTML = titleHtml + descripHtml + readmoreHtml;
           document.getElementById('metroImage').innerHTML = photoHtml;
         }

         // Handle the feature unselection event
         function onFeatureUnselect(feature){
           // Set the HTML back to what it was before
           document.getElementById('summaryLabel').innerHTML = '<p>Click a metro rail system on the map to get more information.</p>';
           document.getElementById('metroImage').innerHTML = ''
         }
      }

    </script>
    </head>
  <body onload="init()">
    <div class="navbar navbar-inverse navbar-fixed-top">
        <div class="navbar-inner">
            <div class="container-fluid">
                <a class="brand" href="/">Large metro rail systems in South America</a>
            </div>
        </div>
    </div>
    <div class="container-fluid">
        <div class="row-fluid">
            <div class="span5">
                <div id="map">
                </div>
            </div>
            <div class="span7">
                <div>
                  <table>
                    <tr>
                      <td><img src="metro_legend.png"/></td>
                      <td id = 'summaryLabel'><p>Click a metro rail system on the map to get more information.</p></td>
                    </tr>
                  </table>
                <div id="metroImage"></div>
              </div>
            </div>
        </div>
    </div>
  </body>
</html>
Lesson 8 assignment: Independent exploration of FOSS
If the amount of JavaScript in the walkthrough was intimidating, don't worry. You don't have to write that kind of code in the lesson assignment, although I hope some of it comes in handy in your term project.
For this week's assignment, we're going to do something a bit different. You will identify and report on some GIS FOSS that interests you. Your typical encounter with FOSS in the "real world" will be open ended with little direction other than what you can find online. Therefore, this assignment is designed to give you an experience of independent exploration.
Reading
First, read this article to get an idea of the many different FOSS products used with GIS, some of which we have not covered in this course. I have placed this article in the Lesson 8 module in Canvas:
- Steiniger, S., & Hunter, A. J. (2013). The 2012 free and open source GIS software map–A guide to facilitate research, development, and adoption. Computers, Environment and Urban Systems, 39, 136-150.
With its many acronyms, this article approaches alphabet soup at times, but I think you are far enough along in this course that you will recognize some of them and have enough frame of reference to process the ones you don't know. Obviously this article is several years old, but will help get you up to date on the major players in FOSS GIS. I am not aware of a more recent article as thorough as this.
Experimentation
Identify a FOSS solution for GIS that we have not covered in this course, download it (if applicable), and briefly experiment with it. Then use the software to accomplish something useful.
In fulfilling this requirement, keep in mind the following:
- This should ideally be some software that will be helpful in your term project, although this is not required.
- APIs, such as Leaflet and D3, are okay for this requirement.
- If you select a cloud-based service, be sure that it contains some open source element.
Use the Steiniger and Hunter article, as well as the Ramsey video from Lesson 1, if you need ideas about what to review.
Deliverable
Write a report of around 1000 words describing the following:
- What software you chose, who makes it, and why.
- How it relates to web mapping.
- What useful function you accomplished with it. Provide screenshots.
- What documentation you found and used in accomplishing the above things. Provide links. Please also comment on its quality.
- How this software could possibly complement or extend the projects you have completed in this course.
If you reviewed a cloud based service or a FOSS product created by a for-profit entity, please delineate which elements of the software are FOSS and which are not. Also describe how the FOSS portion fits into the business model of the provider.
Remember that free software and APIs are not always open source. The software you review for this assignment must have some portion where the source code is openly shared and can be reused or modified.
You should submit your report into the Lesson 8 assignment drop box on Canvas.