Lesson 2: Business Modeling and Market Segmentation
2.0 Introduction to Lesson 2
It is important to remember that the marketing function in an organization is charged with the following responsibilities:
- Capture prospective customer needs, wants, desires and values (commonly known as the voice of the customer or the voice of the market).
- Create a product/service (something of value) that satisfies (meets or exceeds) the prospective customer’s expectations.
- Collect payment for product/service delivery (sell).
It also important to remember that a customer is a person/organization who not only has needs, wants, desires, and values but is willing to spend her/his money to fulfill those needs, wants, desires, and values (i.e., there is an exchange of value).
Raffi Amit, Wharton School of Business, and Christoph Zott, University of Navarra IESE Business School in Spain, were recently interviewed to discuss business modeling and changes the COVID-19 pandemic causes in an economy.
The COVID-19 pandemic triggered a severe, multifaceted global crisis--both a health crisis and an economic crisis. The shocks to the economy were both on the demand side as well as on the supply side. A catastrophic pandemic such as COVID-19 is very likely to alter the preferences, habits, and risk attitudes of consumers, in part because of the long stays at home and the social distancing measures that were applied. What seems very likely is that many companies--both large and small, both private and public, bothe for-profit and not-for-profit--will be prompted to reimagine themselves, to reinvent themselves, in order to survive and prosper in the future.
The way they engage with their customers might change dramatically. For the last almost year, we didn't go to malls. We didn't go shopping. We did everything online. If you are a mall owner, you will ask yourself, "Will consumers come back to malls? Will they need the mall? Will they need to go when they are so used to shopping online today?
There are profound behavioral changes that might occur as a result of this pandemic. Companies need to look at themselves and say, "Should we find new ways to interact wiht our partners, with our customers?" Therefore, "Do we need to design a new business model?" There is no doubt that the pandemic has prompted companies to reimagine and redesign their business models. I think that we don't really know how the new normal will evolve. That's work in progress, right? There are so many things that are happening, both politically, socially, and otherwise, and there is a record level of uncertainty as a result. That, for sure, will affect how companies will decide to engage with their stakeholders. Raffi Amit
Knowledge@Wharton. (2021). Business Model Innovation Matters More Than Ever. Podcast. 15 Feb 2021. https://knowledge.wharton.upenn.edu/article/business-model-innovation-ma... [1]
Learning Objectives
At the successful completion of Lesson 2, you should be able to:
- discuss how location relates to consumer behavior;
- discuss market segmentation;
- define segment, cluster, variable, and attribute;
- discuss Census geographies, demography, and the origins of market segmentation;
- locate and enumerate demographic (and psychographic) attributes of a given zip code;
- list the attributes for a selected segment and compare segments based upon variables; and,
- define demographic and psychographic profiling: and
- brainstorm ideas for a Term-long Project relating to location intelligence;
What is due for Lesson 2?
Lesson 2 will take us one week to complete. There are a number of required activities in this lesson, listed below. For assignment details, refer to the lesson page noted.
Note: Please refer to the Calendar in Canvas for specific time frames and due dates.
| 2.1 Business Modeling | ||
|---|---|---|
| Requirements | Details | Access / Directions |
| Read | Read the course content. | Use the Lessons menu or the links below to continue moving through the lesson material. |
| Moreno, “Location Intelligence: Mapping the Opportunities in Data Landscape” | Registered students can access the reading in Canvas on the Lesson 2 Readings page. | |
| Deliverable | No Deliverable | N/A |
| 2.2 Census Geography, Demographics, and Attributes | ||
|---|---|---|
| Requirements | Details | Access / Directions |
| Read | Read the course content. | Use the Lessons menu or the links below to continue moving through the lesson material. |
| Do | US Census geographies and population data activity | The activity is on the Lesson 2.2 Census Geography and Attributes course content page. |
| Deliverable | No Deliverable is required for this activity. | N/A |
| 2.3 Market Segmentation and Clustering in the U.S. | ||
|---|---|---|
| Requirements | Details | Access / Directions |
| Read | Read the course content. | Use the Lessons menu or the links below to continue moving through the lesson material. |
| NetMBA “Market Segmentation” | Registered students can access the reading in Canvas on the Lesson 2 Readings page. | |
| Mashable.com The End of Demographics” | Registered students can access the reading in Canvas on the Lesson 2 Readings page. | |
| Andrade-Walz, “Geodemographic Segmentation: The People Behind the Coordinates” | Registered students can access the reading in Canvas on the Lesson 2 Readings page. | |
| Optional Reading | Links to other examples of segmentation | Links to the readings are on the Lesson 2.3 Market Segmentation and Clustering in the U.S. course content page. |
| Do | Claritas "My Best Segments"part I, PRIZM | The activity is on the Lesson 2.3 Market Segmentation and Clustering in the U.S. course content page. |
| Deliverable | Presentation, Due Tuesday. | Submit in Canvas to the Lesson 2.3 Activity: PRIZM "My Best Segments" drop box |
| 2.4 Comparing Segmentation Systems | ||
|---|---|---|
| Requirements | Details | Access / Directions |
| Read | Read the course content. | Use the Lessons menu or the links below to continue moving through the lesson material. |
| Mosaic USA, Experian | Registered students can access the reading in Canvas on the Lesson 2 Readings page. | |
| Experian Business Strategies, Mosaic USA | Registered students can access the reading in Canvas on the Lesson 2 Readings page. | |
| Do | "My Best Segments" part II, P$YCLE and ConneXions * | The activity is on the Lesson 2.4 Comparing Segmentation Systems course content page. |
| Comparison with Experian Mosaic and CACI ACORN systems | The activity is on the Lesson 2.4 Comparing Segmentation Systems course content page. | |
| Deliverable | Quiz 1: Geography, Location Intelligence, and Segmentation due Tuesday. |
Registered students can access the quiz in Canvas in the Lesson 2 module. |
| 2.5 Term Project Brainstorm Project Ideas | ||
|---|---|---|
| Requirements | Details | Access / Directions |
| Read | Read the course content. | Use the Lessons menu or the links below to continue moving through the lesson material. |
| Deliverable | Post Term Project - Topic Idea, Due Tuesday. | Post in Canvas to the Lesson 2.5 Term Project – Topic Idea forum. |
2.1 Business Modeling
Business Modeling
This is not a business course; I encourage you to continue your research and consider other graduate courses to understand business fundamentals. In Location Intelligence for Business, we’re examining methods of geospatial analysis that develop location intelligence for business decision makers.
Through geospatial analysis, location intelligence provides a way to reveal relationships between data sets to arrive at actionable insights. Throughout the course, you may build a list of advantages a business gains from effective location intelligence projects or studies.
- Exploit data to create competitive advantage.
- Make better, more actionable business decisions.
- Link datasets to reveal relationships.
A business organizes departments, staffs, and roles to understand customer needs, create valuable products, market thier products or services, and distribute their product to the most likely locations for profitable sales. This is complicated, organized, established over years, risky, and often rewarding. An efficient organization performs business development, marketing, management, and reporting; constantly evaluating their performance to business elements, principles, and objectives. Analyzing data and situations with location intelligence to achieve business goals requires a connection to marketing SWOT analysis, needs assessments, risk and crisis management policies, and decision-making.
Examples of how this process benefits companies and customers include:
- reducing direct marketing costs through address verification;
- improving customer experiences with in-store location technology;
- enhancing civic & community engagement with targeted messaging for local events;
- modeling risk assessments to anticipate opportunities and threats; location intelligence is linked to SWOT analysis and needs assessments.
Business Advantage
A business promotes its products through marketing campaigns, alliances with partner businesses, and highlighting the advantages its products or services offer over competitors. Significant marketing effort is designed to transform consumers to customers. Sam Walton focused on consumers and relates in Sam Walton: Made in America that a company may need to redesign the entire business model with an understanding that "the whole thing is driven by the consumer, who are free to choose where to shop."
Competitive businesses in the digital age focus effort to fulfill two strategic goals for the organization and customers:
- The business wants to deliver Personalized Consumer Experiences, offered via digital marketing.
- Consumers desire customized products available through multiple channels, delivered in a simpler experience.
As an example, Amazon provides a standard for personalized marketing with:
- personalized Amazon page;
- chat connection for each experience; and
- recommendations based on previous purchases and preferences.
Digital transformation of marketing operations requires more data sources, relevant information, and geospatial connections to effectively segment markets and consumers. A buyer makes individual choices on the products or services needed; global businesses group buyers into collective segments to understand needs, preferences, purchasing behaviors, locations, and economic characteristics.
Business Metrics and Sales Reporting
One of the key accounting reports for a company is the Income Statement that reports the amount of revenue earned minus expenses paid for a given period of time (e.g. month, quarter, calendar year, or fiscal year). Another significant report is the company's periodic Statement of Cash Flows which reports the operating, investing, or financing activities during that time period. [These activities and reports are pertinent to Anti-Money Laundering/Counter Terror Finance investigations.]
- Operating expenses refer to the activities related to running the company to generate a profit.
- Investing activities include purchasing investments, lending resources, or buying long-term productive resources (e.g. purchasing large pizza ovens for a restaurant, earth moving equipment and trucks for a quarry).
- Financing refers to borrowing from institutions, receiving shareholder contributions, or paying dividends.
Resources owned by a company are Assets. In basic financial accounting, the Assets a company owns must equal what the company owes to creditors (Liabilities) and Equity (or Shareholders' Equity), as seen in (1). Creditors are anyone or any institution to whom money is owed. Typical creditors are banks, suppliers for the company, or finance companies. Depending on the type of business and how it is organized in its Articles of Incorporation, shareholders own shares in a company's stock. Limited Liability Company (LLC's) are formed with Articles of Organization; but do not have shareholders. LLC members share in the profits of the business.
Assets = Liabilities + Equity (1)
As a company sells its products or services, it generates or receives Revenue. For a company to be profitable, its revenues must exceed its expenses, as seen in (2). Profit is also called Net Income; and a company's profits accumulate as Retained Earnings (RE). When a company distributes RE to shareholders, this is called a Dividend. Dividends are not an expense for the company, they are a distribution of earnings.
Net Income = Revenue - Expenses (2)
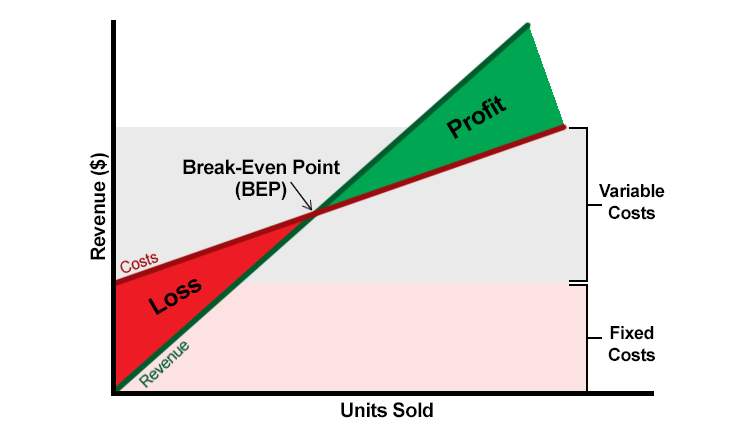
To maximize profits and minimize losses, a business aligns its structure, costs, and production. Profit and Loss formulas are calculated based on costs (fixed and variable) and sales forecasts (unit volume and revenue) (Figure 2.1). The inflection point in a company's profit and loss chart, where costs (expenses) and revenue (sales) meet, is referred to as the Break-Even Point (BEP). Revenue is calculated as the number of units sold times the product's unit price. Revenue = Units sold x Unit price, (ex. $280.00 = 80 units x $3.50/unit). Any point in the graph that is below the BEP is a loss and any number above the BEP shows a profit.
Customers vary in their needs and ability - or willingness - to pay for a product or service. Human behavior studies provide information for marketing managers while determining a product's introductory market cost; as well as statistical modeling, competitive research, and historical sales data. At the base level, business leaders perform profit and loss calculations to determine their requirements for capital, marketing budgets, payroll and operational costs, and manufacturing requirements. "To turn a profit, our company must sell x Products A and y Products B. How many potential customers must we reach?"
Company earns a Profit:
Revenue > Variable Costs + Fixed Costs
At Break-Even Point:
Revenue = Variable Costs + Fixed Costs
Company experiences a Loss:
Revenue < Variable Costs + Fixed Costs
Business Location Analysis
Business owners conduct Location Analysis or Site Selection to determine where to locate their stores, factories, distribution hubs, or offices. This is not just about finding a commercial property with the cheapest rent and insurance costs. With a focus on customers, where is a business selling products to their customers?
- At a physical site, an address where business will take place
- Through e-Commerce, as an Online business with a website domain, web hosting services, and presence in search results (IP address rather than a brick-and-mortar site)
Online location is definable in a digital sense as having the right domain name with online advertising. This enhances search engine optimization (SEO) so prospects can find that business and successfully consider purchasing products or services.
Ryerson, et. al., in Why Where Matters, Sections 6.1 and 6.4, describe how companies use geospatial data to gain a Geo-Advantage over competitors.
As previously noted, the GeoEconomy has come about, in part, as a relatively rapid evolution of our societal information infrastructure. In many respects this evolution is akin to the introduction of computers in the 1960s and 1970s. During that period governments, financial services, and some businesses rapidly adopted the technology - and some didn't. Some implemented the technology in effective and creative ways that catapulted them ahead of their competition. Some started off poorly and then reinvented themselves. Some didn't understand that computerization was not an option but an imperative, and when they failed to adopt the technology quickly enough they failed and disappeared. The history of the introduction of computers also tells us that among the suppliers of the technology there were some hugely successful long-term survivors and myriad small players (and a few large ones) that disappeared. Those who benefited the most were the ones who discovered how to use it before others caught on.
The GeoEconomy is no different. Those who first figure out (or who have already figured out) how to create and use geo-information will do better in the GeoEconomy than those who don't. ... In all cases it starts with one simple question: where?
In grappling with the explosion of Big Data in volume and velocity, companies perform geospatial analysis to leverage location data and location intelligence for business decision makers. Current examples include smartphone penetration; location infrastructure of cell towers, beacons, global positioning system (GPS), radio-frequency identification (RFID); distribution networks of 5G cellular connectivity; and the Internet of Things (IoT) with connected sensors.
Market Targeting
Market targeting; traditional, multi-channel, and digital channel selection.....strategic audience decisioning ... consumer experience.
Marketing principles
Why omni-channel marketing is optimal for some business.
How customer engagement and location intelligence tools assist.
Site Selection
In the remainder of this lesson, we focus on Site Selection at the physical address where business will take place, raising the questions that Moreno (2017) highlights:
- Why here?
- How can I succeed here?
As a response to the 2020 Covid-19 pandemic and to reduce exposure risks to the public, elected officials closed businesses, enacted regulations on food service and beverage sales, and emplaced bans on significant commercial activity. Contemporary studies will highlight the effects on small businesses, regional vs. global commerce, supply chains, and large retailers (e.g. Costco, Whole Foods - Amazon, Walmart).
Read:
- Moreno, Hugo. 2017. Location Intelligence: Mapping the Opportunities in the Data Landscape [3]. Forbes Insights, Thought Leaders. 19 Jan 2017.
Note: Readings can be found in Canvas in the Lesson 2 module, organized by topic.
First, let’s establish our base understanding of census geography, regions, and geographic terms.
2.2 Census Geography, Demographics, and Attributes
Activity: US Census Geographies and population data. Create and compare reference maps of various Census geographies of your hometown/neighborhood
Let’s start with the geographic coverage or the “where” of a problem. People have many ways of describing their environment, hometown, and surroundings. Terminology ranges from colloquial references to specific definitions in gazatteers.
- Regions, designated areas, tracts
- Census geography – neighborhoods, blocks
- Hot spots, corridors, areas of influence
The U.S. Census Bureau establishes a hierarchy of geography in the main Census website (www.census.gov [4]) and advanced search methods of census data:

Figure 2.2.1 - Advanced Search, US Census data. Credit: US Census Bureau website (https://data.census.gov [5])
U.S. Census Entities and Descriptions - understanding geography.
Urbanized Area - A continuously built-up area with a population of 50,000 or more. Urbanized areas are defined as densely developed territory to provide a better separation of urban and rural territory.
Census Tract - A statistical subdivision of counties; serves as framework for assigning census block numbers. Small, relatively permanent subdivision of a county or equivalent entity (e.g., district, parish, canton). Generally has a population size between 1,200 - 8,000 people.
Block Group - A statistical division of census tracts, generally containing 600 - 3,000 people. These are used to present data and control block numbering. Block groups consist of clusters of blocks within the same census tract that have the same first digit in their 4-digit census block number.
Blocks or Census Blocks - The smallest Census Bureau geographic entity. Generally bounded by visible features such as streets, streams, railroad tracks, legal or statistical entities. Census blocks nest within all other geographic entities; serve as the basis for all tablulated data.
Note:
If you're feeling a little "rusty" with regard to Census geography, here are some resources:
- You may want to look up the definition for each of the boundary features in step 3 below—use the US Census "2010 Geographic Terms and Concepts [6]" resource.
- In 2020, the U.S. Census Bureau decomissioned it's American FactFinder statistics and information search engine. The new site to explore Census data is found at data.census.gov [5] where citizens and researchers can still find: American Community Survey, Decennial Census results, population and housing unit estimates.
- For a more in-depth study of boundary features, refer to Chapter 2 of the "Geographic Areas Reference Manual (GARM) — 1990 Census [7]." It is a bit dated, and you'll find that some definitions differ from those currently used for the 2010 Census, but the GARM does a nice job of contextualizing Census geography. The diagram on pages 2-9 of Chapter 2 provides a nice visual understanding of how small-level boundaries nest.
- There is a wealth of other resources at the "Resources for Understanding Census Bureau Geography. [8]" I've linked to some of these resources in the Lesson 2.2 Readings - Census Geography and Attributes page in Canvas.
Step 1. Exploring Census Data.
Remember that the U.S. census has been conducted every 10 years since 1790 as required by the U.S. Constitution. In addition to that data, the Census Bureau conducts a number of surveys annually that pull together a great deal of information about the nation that is vital for government programs, policies, and decision making. Census data is available in a number of formats such as: thematic maps, reference maps, shapefiles, KML's, table data, as well as other types. We will begin by walking you through a simple data search in order to get you more familiar with the process of finding census data. As you are working with the site, pay close attention to the datasets and formats that could assist you in a particular interest or future project.
a. Navigate to the Explore Census Data [9] at the US Census Bureau's website (data.census.gov).

This search bar works best using keywords: geography, places, data table ID, NAICS code.
Enter: Centre County, PA
b. The next page starts with All Results: tables, maps, pages (along the top banner).

c. Click in the Blue Box "Explore Data Centre County, Pennsylvania Profile".

You can see the image is zoomed to the area of interest. This is a great place to start for popular information in one snapshot.
d. Scroll down in the data entries for Centre County.
Left Menu - Topics of Interest Right Menu - Data and Table ID's
(pause while the page is loading, give it time to complete)
Select: Income and Poverty > Scroll down on the right to Employment and Labor Force Status
Note that this is Table DP03 (Data Profile 3)
Step 2. Selecting the Data Table.
a. To go back to the United States Census Bureau [9] landing page, click the logo at the top left > Explore Census Data.

Enter: DP03 > click DP03: SELECTED ECONOMIC CHARACTERISTICS (TableID DP03 is the "Data Profile 3")
b. Select the Tables tab and Tables on the left menu. By default, data is for the entire United States.
Step 3. Drill Down in Geography.
a. To drill down in Geography and compare data in a hierarchy of geographic entities, select Filter (in Table Results) of the left menu. Use the check boxes for specific geography selections.
Geography > County > Pennsylvania > check Centre County, Pennsylvania
also select
Geography > State > check Pennsylvania
also select
Geography > Zip Code Tabulation Area (ZBTA) > 16802 (State College, PA) for demographic information at the zip code level
b. Done with geography selections, click the chevron at the top right to hide the Geography topic menu

Step 4. Selecting a Census Product.
a. The American Community Survey (ACS) 1-Year Estimates provide data on a selected geography with a population >= 65,000 people. For more information on the ACS, reference Understanding and Using American Community Survey Data [10] (US Census Bureau, 2020).
b. The ACS 5-Year Estimates cover all geography in the United States and Territories.
select 2019: ACS 5-Year Estimates Data Profiles
c. Examine the data you have selected (perform Exploratory Data Analysis - EDA)
select Customizable Table button, then
Columns of Estimated totals, Percent of Population, and Margin of Error by geography (PA, Centre County, Zip 16802, State College)

d. This table is customizable:
Turn off Margin of Error, click +/- Margin of Error
Use Hide to unclick columns, e.g. you could unselect Estimate and leave Percent checked to view a percent of the Population rather than estimated totals.
Click the > symbol before Topics to expand or collapse information
Change the width of columns to your choice of layout or style
Export to CSV, Excel, or PDF; Print first page of data and/or table notes
Your result may look like :

Step 5. Analyze Demographic Data by ACS Topic and Geography.
a. Comparing statistics between Pennsylvania, Centre County, and State College
| Topic | Criteria | Pennsylvania | State College |
| Employment Status | Population >= 16 | 6,199,456 | 21,927 est. |
| Occupation | Service Occupations | 17.3% of workforce | 16.1% |
| Industry | Education, Health Care | 25.9% of workforce | 46.4% |
| Class of Worker | Government | 10.4% of workforce | 17.3% |
b. You could also add other zip codes in State College or the surrouding area to examine differences in economic data and factors. Changing the Employment Status and age groups introduces perspectives on demographics, citizens, sources of tax revenue, and possibly commuting patterns. A closer examination of the Industry criteria adds statistics of sectors of the economy, data on retail vs. University employment, and can be matched to other economic features.
Concluding Thoughts.
As you create maps, pay close attention to the actual geography these boundary features represent. We'll delve into this topic more thoroughly later in the course, but consider:
- Which boundary best represents what I think of as my "neighborhood"? Which boundary best represents what I think of as my "region"?
- Choose one boundary feature and consider, with attribute data captured at that level, for what purpose might it be useful? For example, what level of detail might I want to consider if I were planning to open a store?
- What considerations might I have to take into account when using data from a particular boundary feature?
- Consider the differences in what people think of and what geographic entities are available in the US Census database when you are showing a "neighborhood," a "region," "trade area," or "sales territory," etc. Keep in mind, we'll come back to geographies and scale throughout the course, and you'll likely refine your understanding.
Jot some notes as you work through these questions.
There is no Deliverable required for this Census activity.
2.3 Market Segmentation and Clustering in the U.S.
Market segmentation is a business strategy that involves dividing prospects (potential customers) into subsets or segments that have common needs, wants, desires, values, and priorities. Market segmentation enables organizations (organizations ranging from for-profit to not-for-profit) to target different categories of prospects who perceive the full value of certain products and services differently from one another.
Targeting or target marketing then entails deciding which potential customer segments the organization will focus on. Marketing segmentation always comes before targeting so an organization can be more selective marketing their products. It is assumed that by aggregating prospects into segments that have common characteristics and requirements, they will respond similarly to a marketing and selling action.
Business location analysis directly relates to other geospatial sciences and studies:
- Demographics and Geodemographics
- Psychographics (consumer behavior)
- Census data and segmentation
- Other geospatial information, e.g., physical geography, human geography, transportation networks, internet access, or infrastructure
Designing an effective Market Segmentation relates to business requirements and situation—a challenge or opportunity—which the business faces. How does the problem relate to market, location, consumers, customers, products, business operations, or supply chain distribution?
Customers have different needs and, for market segmentation to be practical, market segments should be evaluated against defined criteria or requirements. Early in my pharmaceutical sales career, a VP of Sales encouraged us to monitor our sales daily and understand the metrics used by the company to evaluate its performance. The VP added, "If something you're doing isn't measurable, it's a hobby." In the NetMBA reading, several criteria for segmenting customers, markets, or products include the following characteristics:
- Identifiable
- Accessible
- Substantial
- Unique Needs
- Durable
Elements of the segmentation may include business reporting, transforming consumers to customers, expanding current customer product choices, and reevaluating business goals. Analysts often need more data sources for marketing segmentation. Consider ideas on creating customized consumer experiences through omni-channel marketing:
- Asking questions: intelligent, pertinent, relevant
- Enrich data into useable, valuable georeferenced information
- Segmentation
- Data – location data
- Areas of interest – areas of influence
- Demographics
- Geography – relative or applicable regions of geographic relevance
- Consumer-driven commerce
- Digital economy
In Section 2.1, Moreno described applications of location data for enriching, analyzing, and visualizing georeferenced data. That’s important for an organization’s business development, marketing, and management departments. Current combinations of marketing and business principles establish market targeting as traditional, multi-channel, digital channel or omni-channel; improving a business strategic audience decision making and customer experiences.
Many economic sectors are grappling with the explosion of data from multiple sources and formats. We will examine the value of location data & location intelligence which geospatial analysis provides business decision makers, e.g., through Smartphone penetration, location infrastructure (cell towers, beacons, RFID, GPS), and the Internet of Things (IoT). Throughout the lessons, consider methods of enriching, analyzing, and visualizing location data.
Read:
- NetMBA's primer on "Market Segmentation [11]."
- Jamie Beckland's Mashable.com post "The End of Demographics: How Marketers Are Going Deeper With Personal Data [12]."
- Alex Andrade-Walz. 2018. Geodemographic Segmentation: The People Behind the Coordinates. Spatially. 7 Mar. 2018. Blog.
(Registered students can access the Andrade-Walz reading in Canvas on the Lesson 2 Readings page.)
Optional Reading:
- If these topics interest you, you may wish to bookmark the Center for Spatially Integrated Social Science: CSISS Classics [13].
- Patchwork Nation website [14] and associated work is often cited on PBS, in the Christian Science Monitor, and by other media outlets. Patchwork Nation "divides America's 3,141 counties into 12 community types based characteristics, such as income level, racial composition, employment and religion. It also breaks the nation’s 435 congressional districts into nine categories, using the same data points and clustering techniques."
The Claritas segmentation data is sourced from third-party national online surveys collecting population, financial, insurance, technology, and energy track data. Varied audiences or customers seek different data for understanding consumer preferences, market and geographic trends, and relationships in data to demographics. Claritas produces PRIZM Premier, P$YCLE Premier, ConneXions products for commercial customers.
- PRIZM Premier provides insights on demographics, household lifestyle and media preferences, shopping behaviors, and technology usage in 68 segments, 11 LifeStage Groups, and 14 Social Groups.
- P$YCLE Premier is built for financial marketing services connecting data on financial needs and behaviors of US households.
- ConneXions is designed for the technology and telecommunications industry to relate technology behaviors of connected consumers and adoption rates of new technology.
Activity: Explore Claritas PRIZM "My Best Segments."
This lesson is an introduction to demographic segmentation. You may or may not be familiar with Nielson Claritas segment information tool from previous courses. Claritas Zip code look-up tool lets you view your neighborhood's household segments by zip code. This data includes quick facts such as: population, median age, median income, and consumer spending in addition to the information shown nationally by segments within the segmentation system.
For this lesson, we will access the ZIP code look-up page and begin an overview of Claritas' segmentation. Please scroll to the bottom of the MyBestSegments [15] page where there is a grey box. Under the header "Tools", select "Segment Details" for information on segments or "ZIP Code Look-up."
(Note: you may have to launch the Segment Details and ZIP Code Look-up webpages using the links found inside the grey box shown in Figure 2.6 below. At times, a Stripmenu will appear for navigation so you will not have to use the links at the bottom of the page. It depends upon how you are redirected to MyBestSegments when you first launch the webpage. Additionally, if the site does not launch, try using a different browser.)
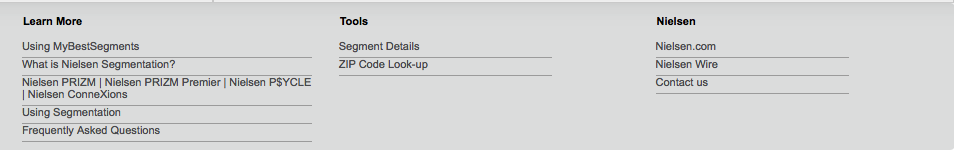
MyBestSegments Bottom Navigation Menu
- Learn More
- Using MyBestSegments
- What is Nielsen Segmentation?
- Claritas PRIZM | PSYCLE | ConneXions
- Using Segmentation
- Frequently Asked Questions
- Tools
- Segment Details
- ZIP Code Look-up
- More Info
- Nielsen.com
- Claritas360.claritas.com
You can practice by following the steps below:
- Go to MyBestSegments Zip Code Look-up.
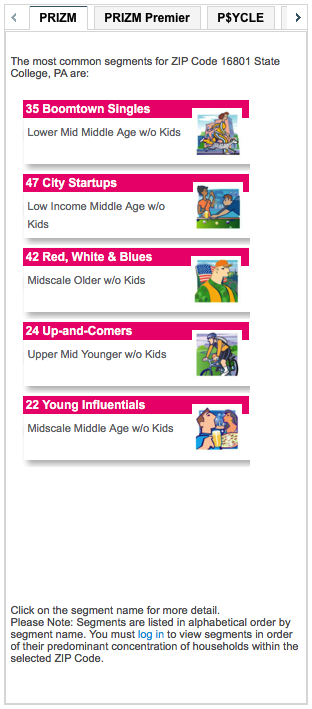
- In Figure 2.7 below, the State College ZIP Code 16801 has been used for a sample Look-up (State College actually covers 4 ZIP Codes: 16801, 16803, 16804 & 16805).
- Now try a 5-digit ZIP code of a place with which you are familiar.
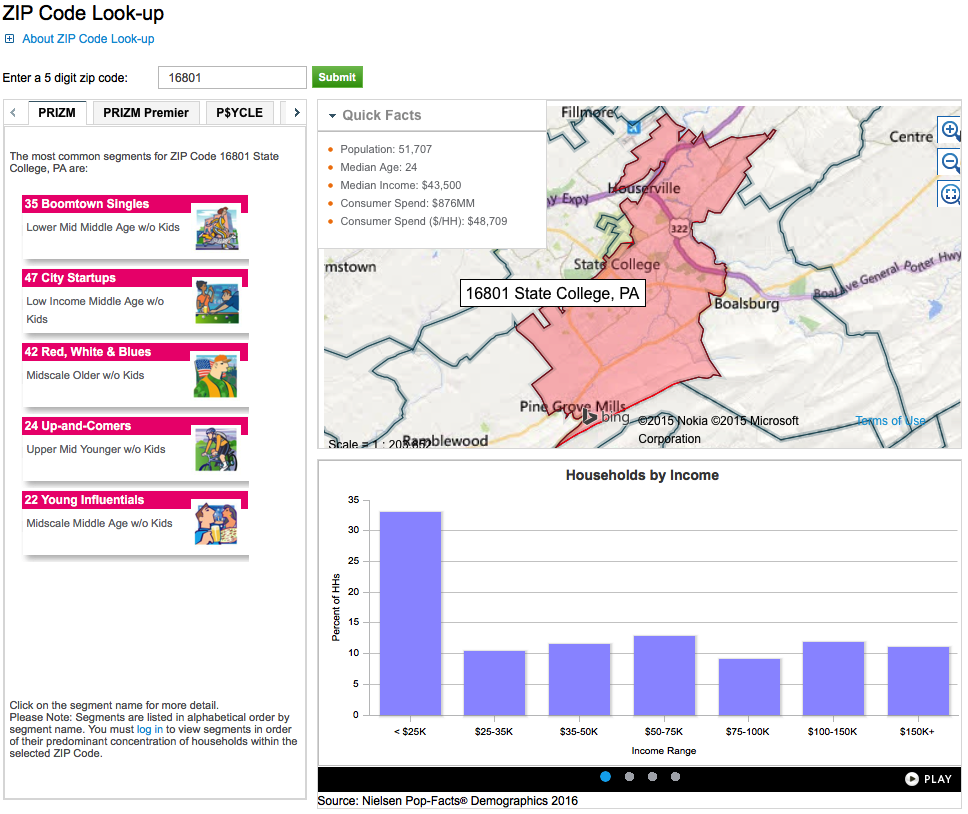
ZIP Code Lookup for 16801
- Quick Facts
- Population: 51,707
- Median Age: 24
- Median Income: 43,500
- Consumer Spend: $876MM
- Consumer Spend ($/HH): $48,709
- Common Segments for ZIP Code 16801 State College, PA
- 35 Boomtown Singles (Lower Mid Middle Age w/o Kids)
- 47 City Startups (Low Income Middle Age w/o Kids)
- 42 Red, White & Blues (Midscale Older w/o Kids)
- 24 Up-and-Comers (Upper Mid Younger w/o Kids)
- 22 Young Influentials (Midscale Middle Age w/o Kids)
- Households by income
Income Range Percent of HHs <$25K 33% $25K-35K 10% $35K-50K 12% $50K-75K 13% $75K-100K 9% $100-150K 12% $150K+ 11%
You will notice that there are some help links and tutorials in the top portion of the zip code look up page that may be beneficial for new users.
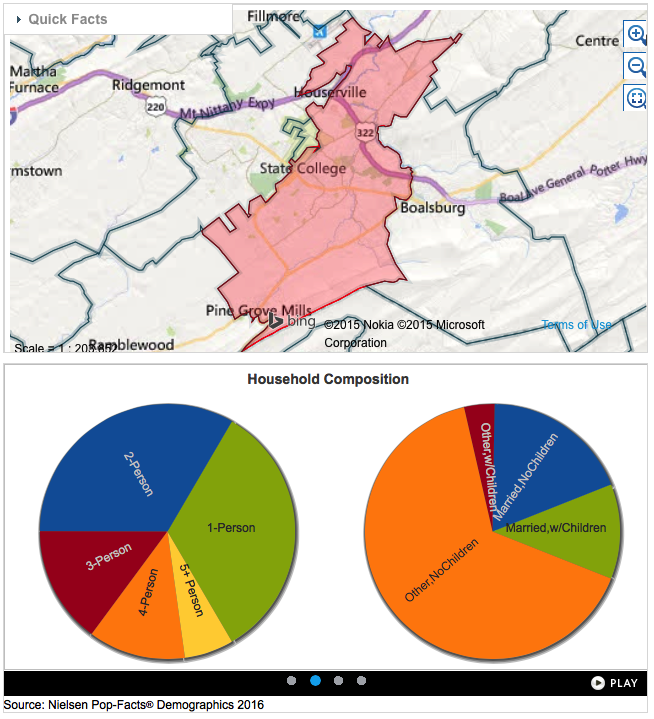
ZIP Code Data
The right side of the page (the portion that includes the map and the graphs below the map) contains information specific to the ZIP Code that was entered in the search field (see Figure 2.8). Below the map are four different graphs that display the data for the ZIP Code. These graphs can be manually scrolled from left to right by clicking on one of the four dots at the bottom of that section, or allowed to be scrolled through using the play-pause feature.
National Data Segments within the PRIZM Segmentation System
The left side of the page contains four segmentation system tabs: PRIZM, PRIZM Premier, P$ycle, and ConneXions. These tabs contain nationally based data that can be used in comparison to the local data (see Figure 2.9). Notice how the PRIZM tab data segments demographic collections which are the "most common" data segments for that particular zip code.
Select one of the PRIZM segment collections to view additional information. This will open a new web page with additional information. Keep in mind that the information contained in the tabs (PRIZM, P$ycle, and ConneXions) is national. You will notice a brief explanation of the segmentation with some clarification. Although there are a number of tabs, the free version of the zip code look-up site only displays data on the "snapshot" tab.
Your PRIZM Segment - Your Household
Review the segment page (Boomtown Singles, Country Squires, Traditional Times, Suburban Sprawl, etc.) within the PRIZM segmentation tab to find what segment best represents you or your household (see sample in Figure 2.10). Ask yourself the questions:
- What are the similarities and parallels between the data and how it relates to you or your neighborhood?
- What are the characteristics of the segment (that you chose) that relate to you?
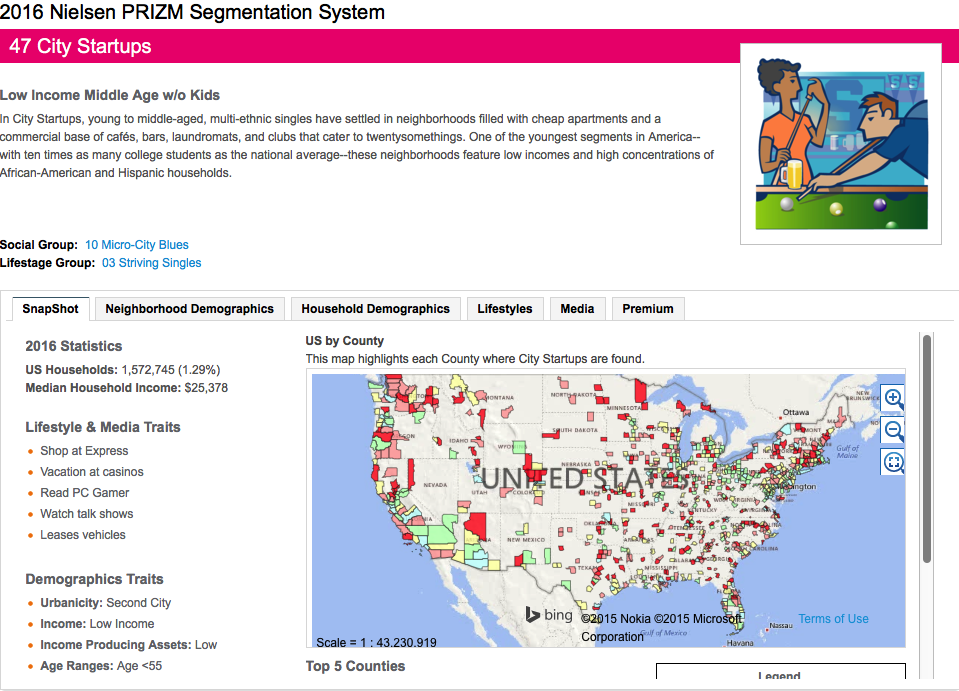
Snapshot of 47 City Startups
2016 Statistics
US Households: 1,572,745 (1.29%)
Median Household Income: $25,378
Lifestyle & Media Traits
- Shop at Express
- Vacation at casinos
- Read PC Gamer
- Watch talk shows
- Leases vehicles
Demographics Traits
- Urbanicity: Second City
- Income: Low Income
- Income Producing Assets: Low
- Age Ranges: Age <55
Social and Lifestage Groups:
Open the social group link for the segment that you have chosen. The link is located about a third of the way down on the segment page. This social group is an aggregation of multiple segments that have a common element. Consider what it is that these groups have in common to involve this segment. These groups are a coarser representation, grouping by factors that they have in common with the segment. Think about what is distinguishing the social and lifestage groups for your presentation. As we aggregate segments into a social or lifestage grouping, what patterns are we noticing that are in common?
It is also important to consider your Weiss readings and your work thus far the answer to the question, "What is different about Social and Lifestage groups? Do you see patterns, similarities, differences?"
This was a quick introduction to PRIZM. There will be additional exercises where you will be required to gather information from Claritas and PRIZM so be sure to practice with it and explore all of the features to become a little more familiar with it.
Important Note:
The "My Best Segments" search tool does NOT return all segment matches for your ZIP code. This free search tool provided by Nielsen/Claritas returns only the most common segments for each ZIP code, and these are NOT ranked--rather, they are listed alphabetically.
There could be more segments present in any given ZIP code--in coming weeks, we'll work with a different data, Esri Tapestry, for which we have full access, allowing us up to the top 20 segments. Again, for demonstration purposes here, if you don't find a segment which you feel adequately describes your household, choose one segment which you can clearly see present in your ZIP code.
Additional Help:
You may wish to refer to the Claritas 360: "Helping Companies Find Customers" Learn More [16]. You can also search for individual segments at the "Segment Look-Up" if you need to refer back after you've closed the search tool.
Deliverable Lesson 2.3 Activity: PRIZM "My Best Segments"
Using your screen captures from above, create a Word report or presentation with images to show your results to the class. Please submit your file in Canvas to the Lesson 2.3 Drop Box Presentation. The Drop Box is set so you will be able to see all submissions.
Slide one should show your ZIP code's list of PRIZM segments OR the single segment you felt best matched. On this slide comment on:
- which segment(s) best profile(s) your household (or which is clearly present in your ZIP code);
- your perception of the accuracy of at least one demographic variable and one psychographic trait/characteristic.
Slides two and three should show the "Social" Group and "Lifestage" groups which contain your chosen segment. (You may choose to include both groups on one slide, but please comment on each, in which case you will only have two slides total.) On each of these, comment on:
- any patterns you notice in the group (across all segments);
- what is different about Social versus Lifestage groups? (What characteristics is each grouping methodology focused on?)
Due Tuesday 11:59 pm (Eastern Time)
2.4 Comparing Segmentation Systems
2.4a. "My Best Segments"—Explore Nielsen/Claritas PRIZM, P$YCLE, and ConneXions.
Unfortunately, you cannot repeat your ZIP code search in "My Best Segments" and choose the "P$YCLE" tab from the three segmentation system choices to gain the actual segments in order unless you are a subscriber. Fortunately, the Segment Details page provides an interactive tool that lets you examine the four segment groups which belong to a "Lifestage Group."
- Determine the Nielsen PRIZM segment that best matches your household.
- Determine the Nielsen PRIZM Premier segment that best matches your household.
- Determine the Nielsen P$YCLE segment that best matches your household.
- Determine the Nielsen ConneXions segment that best matches your household.
Compare your findings across all four segmentation systems. The names for the like/similar segments won't be the same—they're different segmentation systems—but, if you chose carefully, you should see some consistency across the descriptions.
- What is different in the descriptions?
- Pay close attention to the "psychographic"/"behavioral" descriptions in each of your three segments.
2.4b. Introduce Claritas PRIZM with other market segmentation systems, e.g. MosaicUSA and CACI's ACORN.
Step 1.
Review your PRIZM segment, Lifestage Group, and Social Group.
Step 2.
Access the 2006 MosaicUSA Group and Type Descriptions [17] pdf. Review the MosaicUSA group structure, noting that there is only a single spectrum.
- Using the attributes which describe your PRIZM group(s), see if you can determine which MosaicUSA group compares to one of your PRIZM groups.
Step 3.
Once you've identified a corresponding MosaicUSA group, examine your previously used geography.
Step 4.
Access the MosaicUSA marketing brochure [18] and turn to page 5. Note the graphic for MosaicGlobal in the upper right corner. The two primary demographic dimensions (urban vs. rural and level of affluence) should now be quite familiar.
- Using your MosaicUSA selections and the graphic, identify which of the 10 MosaicGlobal groups your household likely falls within.
Step 5.
Now access CACI's ACORN [19] system which is used in the United Kingdom. Review page 3 of the PDF to get an understanding of the group structure in this system.
- Again, see if you can match your PRIZM group(s) to a specific group in ACORN. Also, see if you can match your PRIZM segment to a specific ACORN segment.
No Deliverable required for this activity
There are no deliverables for 2.4 Comparing Segmentation Systems. However, you must complete Quiz 1 as part of this week's assignments. (See Deliverable below.)
Deliverable:
Quiz 1: Geography, Location Intelligence, and Segmentation
Before moving on to this week's information about the term project, please remember to return to Lesson 2 module in Canvas to take the Quiz 1: Geography, Location Intelligence, and Segmentation
Due Tuesday night, 11:59 pm (Eastern Time). Check the calendar in Canvas for specific time frames and due dates.
2.5 Term Project – Brainstorm Project Ideas
In addition to the weekly activity, it is also time to start to think about your term project.
- Brainstorm a few ideas you have for your Term Project and share them with your classmates. For your idea or ideas, simply state in a sentence what location intelligence problem you would study.
- Respond to several classmates' ideas. I hope you also gain some insights to select and expand the goals of your personal topic.
Deliverable:
Post topic ideas to the 'Term Project — Project Topic Discussion Forum'. One new topic for each student, please! Even at this early stage, if you have constructive suggestions to make, then by all means make them by posting comments in reply to their topic.
Due Tuesday 11:59 pm (Eastern Time)
Note: Please refer to the Calendar in Canvas for specific time frames and due dates.
Questions? Please use the General Issues discussion forum to ask any questions now or at any point during this project. You'll find this forum listed under 'Term Project Discussion Forums' in the 'Modules' section in Canvas.