3.2 Orientation to Esri Business Analyst Online (BAO)
Read:
Miller, Getting to Know Esri Business Analyst, "Part I: Trade area analysis and site reporting with Esri Business Analyst Online" (pp. 2-6)
Registered students can access the reading in Canvas on the Lesson 3 Readings page.
The above reading is the introduction to a scenario from Miller's text which you can use to orient yourself to Esri's Business Analyst Online.
In this lesson, we provide a brief overview of Esri's Business Analyst Online (BAO). BAO includes Esri's most current business, demographic, and lifestyle data:
- Business Data: Refreshed data for the United States and Canada from Dun and Bradstreet.
- Esri's 2020/2025 US Updated Demographics: Accurate, current-year estimates and five-year projections capture changes to the US population such as growth and decline; increased diversity; aging; and changes to household types, home values, employment, and income.
- 2019/2024 US American Community Survey (ACS): Updated survey data from the Census Bureau. Variables include households with/without a disabled person and households using food stamps.
- Esri's 2020 Tapestry Segmentation: Tapestry reflects changes in the US population such as increased diversity, changing households, aging, and nontraditional families.
You will be receiving an email from the instructor with directions to access the Penn State licensed Esri Business Analyst Online, using your PSU username and password. The email provides access to the BAO system and class group work, so please be sure to check your Penn State email. Once logged into the site, you will notice that additional help documentation is available as well as instructional videos on the website.
- Log into Esri's BAO.
- Select the "Maps" tab.
- Choose "Define Areas for Reports."
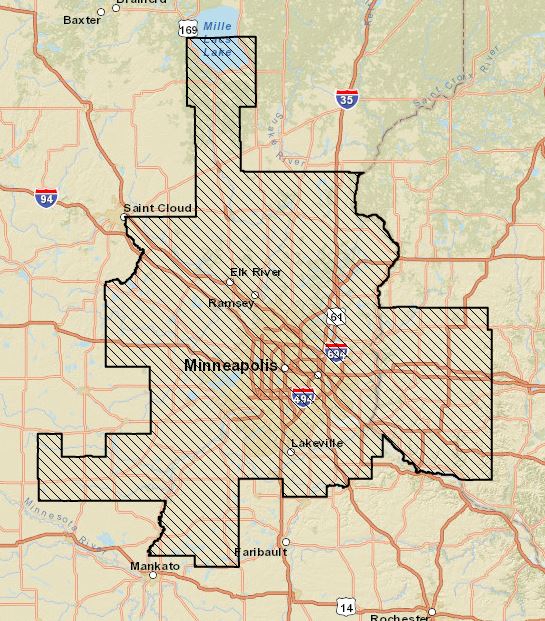
- Select "Geography," search for your geography, enter ("Minneapolis, MN"), Go.
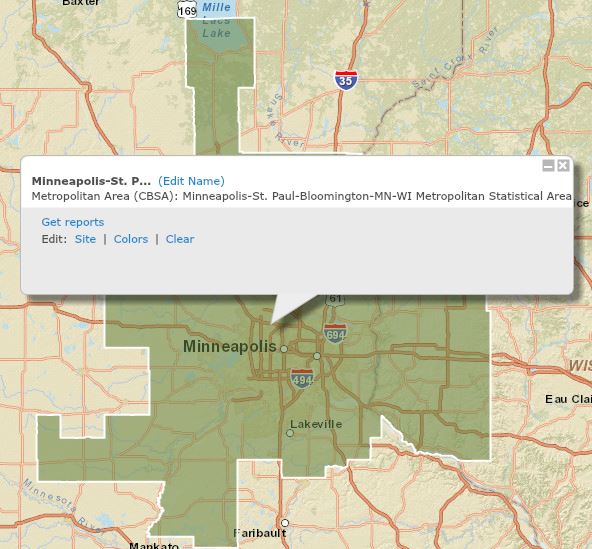
- Select the radio button for "Metropolitan Areas (CBSAs)," check Minneapolis-St. Paul, Click "Next."
- You should now have a polygon on the map around Minneapolis MN (see Figure 3.1).
You can practice and improve your business analysis of a geographical area using Esri's BAO.
Upcoming assignments will involve creating choropleth maps and using Esri's Tapestry data on BAO. Familiarize yourself with those two topics by utilizing Esri's documentation and instructional videos to help you better understand how to display the information.
There are many techniques for statistically segmenting populations and geographies, each based on the collected or calculated data, scientific methodology, standards, and purpose of the segmentation. Esri builds their Tapestry market segmentation system from demographic and socioeconomic variables; identifying and labeling unique consumer markets throughout the U.S. (Esri Demographics, 2022). The Tapestry includes 67 market segments which are then summarized in 14 LifeMode and 6 Urbanization groups. Esri describes these where "LifeMode groups share similar demographic characteristics and consumer behavior patterns while Urbanization groups are based on the segment's geographic and physical features".
Tapestry Segmentation from the Esri website, Esri Demographics [1]:
LifeMode Groups
LifeMode groups represent markets that share a common experience-born in the same generation or immigration from another country, for example—or a significant demographic trait, such as affluence. Tapestry segments are classified into 14 LifeMode groups:
- LifeMode 1 Affluennt Estates
- LifeMode 2 Upscale Avenues
- LifeMode 3 Uptown Individuals
- LifeMode 4 Family Landscapes
- LifeMode 5 GenXurban
- LifeMode 6 Cozy Country Living
- LifeMode 7 Sprouting Explorers
- LifeMode 8 Middle Ground
- LifeMode 9 Senior Styles
- LifeMode 10 Rustic Outposts
- LifeMode 11 Midtown Singles
- LifeMode 12 Hometown
- LifeMode 13 Next Wave
- LifeMode 14 Scholars and Patriots
Urbanization Groups
Tapestry groups are also available as Urbanization summary groups, in which markets share similar locales, from the urban canyons of the largest cities to the rural lanes of villages or farms. Tapestry segments are classified into six JUIrbanization groups:
- Principal Urban Centers
- Urban Periphery
- Metro Cities
- Suburban Periphery
- Semirural
- Rural
There are open resources for learning Esri's Business Analyst Online:
- Be sure to visit the Esri site which offers a tutorial on the basics of creating a color-coded map that reviews all segments of the search without the specific search criteria [2].
- This one page will direct you to just about every feature in BAO. [3]
- See a demonstration of a few of the capabilities of BAO software as a service for small business for site-based location analysis. [4]
- A great video for GIS-trained people interested in how Business Analyst Online can integrate with ArcGIS Desktop. [5]
Note:
We will only complete the first part of this activity this week (Exploring Your Own Market, Part 1), continuing on with site selection next week.
Read
- Murphy, Geography: Why It Matters, Chapter 3 "Places" excerpt (pp. 75-86)
- Church/Murray, Business Site Selection, Location Analysis, and GIS, Chapter 1 (pp. 1-16)
- Buckner, Site Selection, Chapter 6 "Prioritizing Markets" (pp. 74-84)
- Esri. 2019. Tapestry Life Mode Reference Tables [6]. Tapestry Segmentation. Esri.
The Geography: Why it Matters reading is from the required textbook for this course.
Registered students can access the other readings in Canvas on the Lesson 3 Readings page.
Optional Readings
- Spaeder, Karen. E. 2019. How to Find the Best Location: A guide to scouting out a location for your food or retail business, sizing up demographics and getting the help you need [7]. Entrepreneur.
- Kerski, Joseph & Clark, Jill. 2019. GIS Guide to Public Domain Data. Esri Press.
- ArcGIS Hub open data portal. Esri. www.arcgisonline.com [8]
Registered students can access the reading in Canvas on the Lesson 3 Readings page.
Deliverable:
There are no deliverables for 3.2.