Lesson 8: Sector Applications of Location Intelligence, Part 2
8.0 Introduction to Lesson 8
Location intelligence provides customer and situational insights when linked to indoor location analytics and connected sensors (IoT)—two exciting components of Omni-channel marketing. In the modern global economy, a company has both a physical and virtual market presence. Some business types rely on optimizing site locations and providing their product or service directly to meet customer needs. Other businesses deliver their products or services through eCommerce, thus requiring a different output of location intelligence.
Lessons 8 and 9 introduce applications of location intelligence technology to:
- analyze and leverage location data gathered in venue;
- make customer experience enjoyable and personalized;
- optimize the use of building and manufacturing spaces;
- create smart infrastructure that may sense activity in a location, interactively report the occurrence, and direct responses that mitigate a situation for safety, efficiency, or recommending corrections.
Consider how business decisions are made. Your understanding of a decision making process impacts this lesson’s activity, your GEOG 850 Term Project, and possibly interactions with your employer. What are presentation methods you can employ to support decision makers? What are they looking for to weigh recommendations and take action?
- Information/data
- Geospatial analysis
- Visualization and presentation
- Synthesizing observations and patterns for courses of action and decision making
Learning Objectives
At the successful completion of Lesson 8, you should be able to:
- classify location intelligence tools with functions of sectors of an economy;
- recognize secondary relationships of industries that make products and provide services;
- compare location intelligence companies and platforms using criteria you develop;
- evaluate current location intelligence tools to recommend one for a current business;
- describe the integrated network of IoT technologies (connected sensors) to support location intelligence in retail business; and
- create a Term Project presentation with audio to update the class on your project.
What is due for Lesson 8?
Lesson 8 will take us one week to complete. There are a number of required activities in this lesson listed below. For assignment details, refer to the lesson page noted.
Note: Please refer to the Calendar in Canvas for specific time frames and due dates.| 8.1 Indoor Location Analytics | ||
|---|---|---|
| Requirements | Details | Access / Directions |
| Read | Read the lesson content. | Use the Lessons menu or the links below to continue moving through the lesson material. |
| Deliverable | No Deliverable for 8.1 | N/A |
| 8.2 Internet of Things (IoT) and Connected Sensors | ||
|---|---|---|
| Requirements | Details | Access / Directions |
| Read | Read the lesson content. | Use the Lessons menu or the links below to continue moving through the lesson material. |
| Deliverable | Post a personal comment on decision making roles you have had relating to Location Intelligence, due Tuesday. | Post your comment in Canvas to the Lesson 8.2 - Geospatial Analyst Role in Decision Making forum. |
| 8.3 Selecting Location Intelligence for Your Business | ||
|---|---|---|
| Requirements | Details | Access / Directions |
| Read | Read the lesson content. | Use the Lessons menu or the links below to continue moving through the lesson material. |
| Selected white papers, company materials, and market studies on Location Intelligence Products | Registered students can access the reading in Canvas on the Lesson 8 Readings page. | |
| Do | Activity - Selecting Location Intelligence Providers and Platforms for Your Business. | Directions are provided in the course text. |
| Deliverable | Submit your presentation with recommended Location Intelligence platform, due Tuesday. | Submit your presentation in Canvas to the Lesson 8.3 - Selecting Location Intelligence System drop box. |
| 8.4 Term Project - Progress Update Presentation | ||
|---|---|---|
| Requirements | Details | Access / Directions |
| Read | Read the lesson content. | Use the Lessons menu or the links below to continue moving through the lesson material. |
| Deliverable | Post your Term Project – Progress Update Presentation, due Tuesday. | Submit your presentation in Canvas to the Term Project: Project Update Presentation with Audio drop box. |
| 8.5 (Optional) Additional Readings – Penn State Geo Vista Center | ||
|---|---|---|
| Requirements | Details | Access / Directions |
| Read | (Optional) read the lesson content about Penn State's Geo Vista Center. | Use the Lessons menu or the links below to continue moving through the lesson material. |
| Deliverable | No Deliverable for 8.5 | N/A |
8.1 Indoor Location Analytics
Indoor Analytics locates mobile devices inside and outside buildings. Retailers, for example, establish geofencing boundaries to detect customer smartphones and map their movement into a store, along aisles, measuring time spent near products of interest. Location intelligence derived from indoor geospatial analytics, consumer demographics, and proprietary business information assists a company to optimize the use of resources; e.g., marketing, sphere of influence, product shelving and layouts.
Digital mapping, visualized in 2D and 3D, enables indoor positioning, navigation, and direction mapping. Location intelligence from indoor analytics benefits a business to better understand how customers relate to zones in a store, visualizing time and motion patterns on dynamic maps. Marketing managers compare patterns of customer behavior inside and outside to marketing campaigns and optimizing store layouts. They use proximity campaign analytics with connected sensors to analyze relationships with customer movement, technology, and demographics. While this process benefits the success of a company, it also offers shoppers a personalized customer experience (objectively to meet their needs).
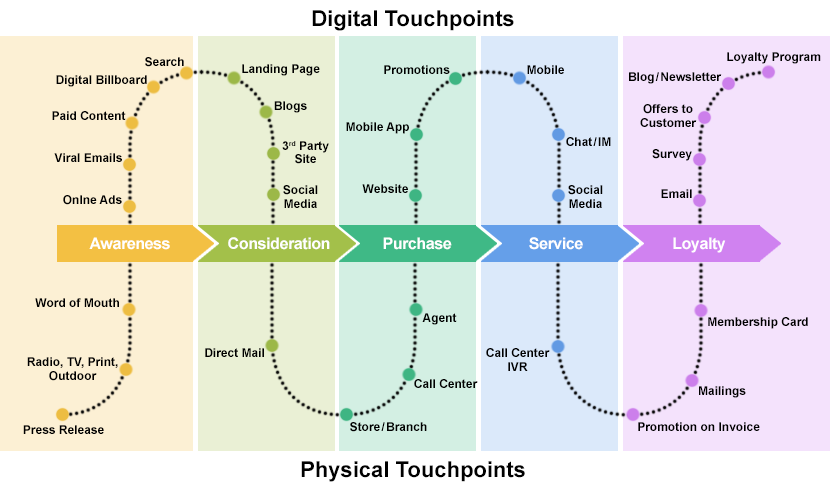
Large food vendors can enhance profitability by leveraging location intelligence and their marketing touchpoints (digital and physical) in large venues, e.g., shopping centers, exhibition centers, airports) with the use of (Figure 8.1):
- customer tracking with Bluetooth beacons, Wi-Fi
- location planning with insight into customer base
- adapting marketing message to analyze customer demographics and behavior
- dispatching promotional materials
- manner, timing, message
- digital geofences to trigger messaging
- timing of customer stay
Retail Applications of Location Intelligence
Grocery and Big Box stores leverage location intelligence, connected sensors, and the Internet of Things (IoT) to engage customers inside their stores. Shoppers hear the ubiquitous razor advertisement as soon as they turn into a pharmacy lane, scanned by a variety of sensors that detect the shopper's presence and proximal interaction with a display.
Omni-Channel Marketing
Why does a company wish to keep in contact with customers who have purchased from them?
An omni-channel marketing strategy uses multiple marketing channels to create a single user experience. The purchaser is the focus - yes, a target - with the understanding that a business is responsible to attract customers, the customer is not likely to spend additional effort to determine the value of a certain company's product. Omni-channel builds on the strengths and medium of each communication channel to deliver consistent, compelling brand messaging to consumers. The compounding advantage of omni-channel applies to retail businesses with physical and digital presence. Metrics that marketing departments rely on include message engagement, customer retention, conversion, budget spend, and customer purchase rates. Goals of branding and marketing campaigns are strategic and depend on the products, markets, competetion, consumers, and costs:
- increasing brand awareness
- encouraging engagement from customers
- generating sales and
- expanding the uses of products
Customers seek advantages such as "good deals" through discounts, coupons, product samples, rebates, loyalty rewards, recognition as a valued customer, and free shipping. With everyone connected to the internet through computers, wearables, smartphones, social media platforms, short message service (SMS) texting, virtual assistant AI technology (think Alexa or Siri), and vehicle wifi, there are numerous ways to reach consumers with brand messaging and enticements to purchase products.
In Omnisend's recent review of 2019 Onmichannel branding, they report that "...over the last year, marketers using three or more channels in any one campaign earned a 287% higher purchase rate than those using a single-channel campaign." Data shows that consumers approached with a single channel purchsed products 3.21% of the time vs. those reached via three or more channels purchasing products 12.43%. https://www.omnisend.com/blog/omnichannel-statistics/ [1] So much depends on the way buyers choose to shop. From our earlier lessons in demographics and human behavior, there are distinct differences in how generations select, try-on, decide to buy, and purchase products.
Deliverable:
No deliverable for 8.1
8.2 Internet of Things (IoT) and Connected Sensors
The IoT is a complex 21st century phenomena characterized by a network physical objects in the physical world connected to digital infrastructure in the virtual world. Retail business connects sensors, IoT, and omni-channel marketing to gain advantages and optimize their marketing, sales, and operations costs. The process also drives competition and innovation to meet customer needs. Watch the video for other indoor uses of IoT and location intelligence.
Video 8.2 Internet of Things (IoT) and Location Intelligence: Customer Engagement (length 1:32). Esri, 12 Jun 2018
IoT architects rely on four fundamental components of embedded sensing, continuous connectivity to the internet, integrated smart computing, and virtual interfaces to engage devices without requiring physical contact. AI software tools enable business to identify consumer trends and behavior, collect a large database of niche markets; in essence, as a business information process.
Customers’ use of smartphones near and within stores allows businesses to access dynamic site data such as location, location preferences, duration of stay, and frequency of visits. The ability to embed location data and spatial analytics delivers value for business decision making, actions, experiences. Dynamic data enables organization to predict customer behavior and their buying patterns. This is then incorporated into location-based marketing to aid conversion and improve customer experiences.
Deliverable:
Post a comment in Canvas to the Lesson 8.2 - Geospatial Analyst Role in Decision Making forum.
- Briefly relate your previous or current role in decision making at an organization relating in some way to location intelligence.
- Have you been the decision maker, part of the process, submitted geospatial analysis results for location intelligence-like decisions? What was the circumstance?
Don't forget to comment on your peers posts.
Due Tuesday 11:59 pm (Eastern Time).
Check the Calendar in Canvas for specific time frames and due dates.
8.3 Selecting Location Intelligence for Your Business
At this point in the course, you are ready to organize and establish criteria for selecting the optimal location intelligence system for your organization. I want you to choose an organization you represent (in real life or choose a business), read the following Lesson 8.3 references, and create a matrix of features and benefits of current Location Intelligence products.
8.3 Activity:
You are a geospatial analyst recommending to your boss a process and visualization for selecting the best location intelligence product/platform/service for your organization’s needs. Some considerations are:
- What features are critical/important/useful in a location intelligence system?
- What priority do you set on the criteria? Organize in a visually effective format that supports professional decision-making.
- What are the top 5 – 10 location intelligence platforms you recommend to your boss? Create a matrix-like visualization comparing the products and what they offer for your organization.
- Do not consider cost as a decision criteria for this assignment. (While cost may be the most important factor for many business leaders, your comparative analysis is highly valuable for selecting a location intelligence system.)
Read the course references on available Location Intelligence companies and platforms, conduct any additional research you feel is necessary.
- Your goal is to research existing location intelligence companies/platforms as well as the range of possible design choices.
- Select a strategy for selecting or creating a location intelligence solution.
- Identify a litmus test of location intelligence platforms to transform location data into business outcomes.
- Spatial analysis is a location intelligence tool. What are the other location intelligence tools and techniques?
Discuss decision making:
- Design a decision matrix from research + white papers. What factors should be considered?
- Recommend one solution to your boss and justify with features and benefits of that location intelligence product.
What Software Tool Should Be Employed?
Open-source software is free and has many features; but may not scale as well, or be as maintainable, as the commercial tools over time.
Commercial software is often expensive, designed primarily for specific purposes, or offering extensions for projects at additional costs; but has known quality, is more maintainable, and is more readily accepted by IT managers than open-source tools. Using open source tools, when possible, frees up project budget to develop models that will deliver the desired value.
What business questions would assist in your approach?
Read:
The following references include objective white papers, promotional company product descriptions, market studies, and blog articles. Scan the material to complete the activity for 8.3:- McCormick, James & Miller, Emily. 2018. The Forrester Wave: Location Intelligence Platforms, Q4 2018. Tools and Technology: The Digital intelligence Playbook [3]. Forrester.com. Cambridge, MA: Forrester Research Inc. 5 Dec 2018.
- Dresner. 2016. Location Intelligence Market Study: Wisdom of crowds series [4]. Dresner Advisory Services: 2016 Ed. Report.
- Esri. 2015. The Science of Where – Applying Location as a Service (LaaS) for Omni-channel [5]. Redlands, CA: Esri. Marketing. Dec 2015.
- Global Justice Information Sharing Initiative Intelligence Working Group. Analyst Toolbox: A Toolbox for the Intelligence Analyst [6]. Washington, D.C.: U.S. Department of Justice. 2007.
- Micek, Brittany. 2017. A Really Good Guide on Location Intelligence Implementation [7]. CARTO Blog.: Location Intelligence. 11 May 2017. Online.
- G2 Crowd. 2019. Best Location Intelligence Software [8]. G2 Crowd Grid for Location Intelligence. Online.
- Grandview Research. 2018. Location Intelligence Market Size, Share & Trends Analysis Report [9]. Grandview Research. Report ID: GVR-2-68038-401-7. . 2018-2025.
- Ubisense. 2015. Location Intelligence Solutions [10]. Ubisense Group PLC. Annual Report, 2015.
Deliverable
Post a comment in Canvas to the Lesson 8.3 Discussion Forum including:
- From your research, write a recommendation to select a location intelligence system for your organization. Include:
- criteria of your business needs that is significant to considering a location intelligence system;
- visual comparison of the features & benefits of current location intelligence company products or systems;
- recommendation of the best system that meets your organization’s location intelligence needs; note several reasons that support your choice.
- Attach your Word document to the Lesson 8.3 Discussion Forum with a short comment on your recommendation.
Due Tuesday 11:59 pm (Eastern Time)
Check the Calendar in Canvas for specific time frames and due dates.
8.4 Term Project - Progress Update Presentation
Having worked through two iterations of your question/case for your term project and several weeks gathering data, analyzing your problem, and preparing maps and reports, it's now time to present the current state of your project to the class for feedback.
This will be a presentation with audio—a video. You may create your video in Powerpoint (insert audio), Google Slides (insert audio), Kaltura (through Canvas), or VoiceThread. The deliverable will be either an attached file or a link to your .mp4, URL, or other formatted video file.
Guidelines:
- Create a 5-7 minute PowerPoint presentation on your term project.
- Include no more than 5 slides/images/maps/reports.
- State clearly and concisely your question or case, including situating the geography of the locale in your analysis.
- Include examples of the kinds of data you are investigating and an overview of your method. (NOTE: You won't have time in this presentation to include every data type or every step--provide your peers and me a good overview. The intention of the presentation is that you will get peer and instructor feedback on your work thus far.)
- You will be evaluated on the following criteria:
- clarity and feasibility of your case/question;
- clear, concise presentation of ideas/data;
- graphics/maps/report excerpts that support your case/question AND are visually clear;
- substantive feedback/comments for your peers.
Deliverable:
Email a link to me and attach a link in the Canvas to the Term Project Drop Box - Progress Update drop box in the Lesson 8 module.
Due Tuesday 11:59 pm (Eastern Time)
Check the Calendar in Canvas for specific time frames and due dates.
8.5 (Optional) Additional Readings – Penn State GeoVISTA Center
Penn State’s GeoVISTA Center
Penn State’s GeoVISTA Center has its GeoCollaborative Crisis Management Research Project underway that addresses two fundamental problems that impede effective coordinated work with geospatial information in crisis management activities. First, current geospatial information technologies are hard to use and designed for use by individuals; they do not support group work effectively. Second, there is limited scientific understanding of how groups (or groups of groups) work in crisis management using geospatial information and technologies that can range from large screen displays in a command center to PDAs for field personnel.
Students interested in exploring more about this project can read about this Penn State Research Project [11].
The GeoVISTA Center is involved in studying Geovisual Analytics. This field is an emerging interdisciplinary field that integrates perspectives from Visual Analytics (grounded in Information and Scientific Visualization) and Geographic Information Science (growing particularly on work in geovisualization, geospatial semantics and knowledge management, geocomputation, and spatial analysis). Geovisual Analytics tools help identify relevant geospatial information, data, and knowledge by supporting analytical process that meld innate human abilities of vision and cognition with computer-based visual interfaces that provide flexible connections to relevant data and supporting knowledge, and that are specifically designed to provide support for analytical reasoning.
Students who are interested in exploring more about this Penn State Center can read about it at the GeoVISTA Center [12] website.