In the past few years, ESRI has been promoting their Roads and Highways product which is designed to provide a fuller featured set of tools for transportation organizations to manage their LRS and roadway event data. A 57-minute introduction to this tool was provided at the 2013 ESRI users’ conference.
Straight Line Diagrams
Transportation organizations capture and maintain a large number of linearly referenced roadway events including:
- Intersections
- Bridges
- Rail Crossings Locations
- Legal Boundaries
- Accidents
- Signs
- Speed Limits
- Average Annual Daily Traffic (AADT)
- Width of the Right of Way
- Width of the Roadway Shoulders
- Functional Class
- Curves
- Grades
- Projects
Displaying more than a few of these on a single map can begin to clutter the map and make it difficult for the user to understand.
One tool which transportation organizations have used for many years to visualize road attribute information is a Straight Line Diagram (SLD). In an SLD, a roadway section of interest is presented as a straight line along with various roadway attributes or events. Often, these roadway attributes are maintained by separate groups within the transportation organization, and sometimes they are linearly referenced using different LRMs. An SLD brings many attributes together with a uniform referencing method to facilitate visualization of the data and the potential identification of relationships between different data elements.
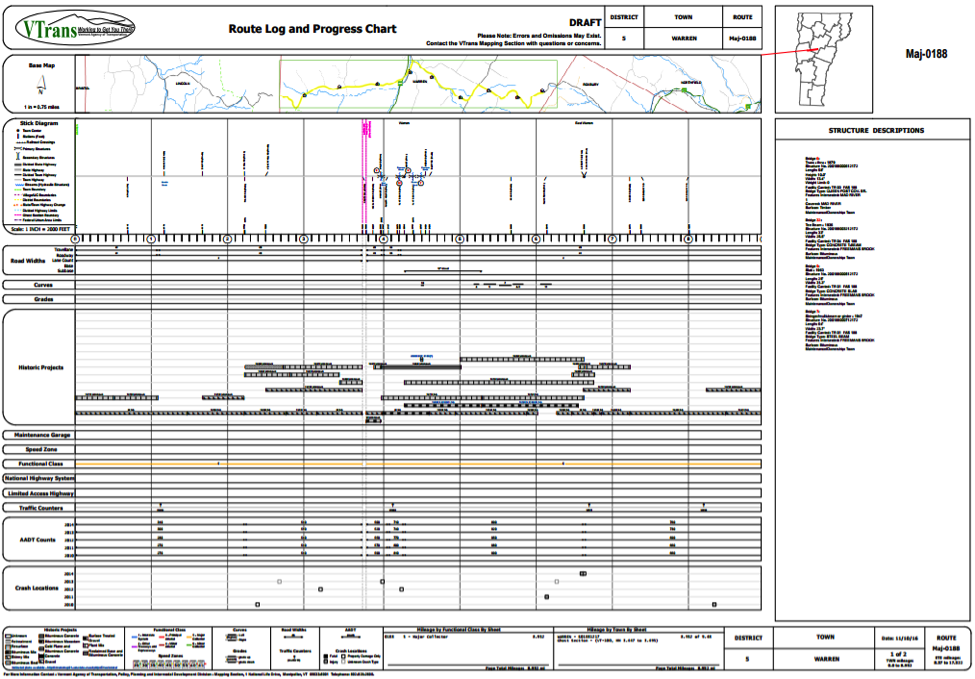
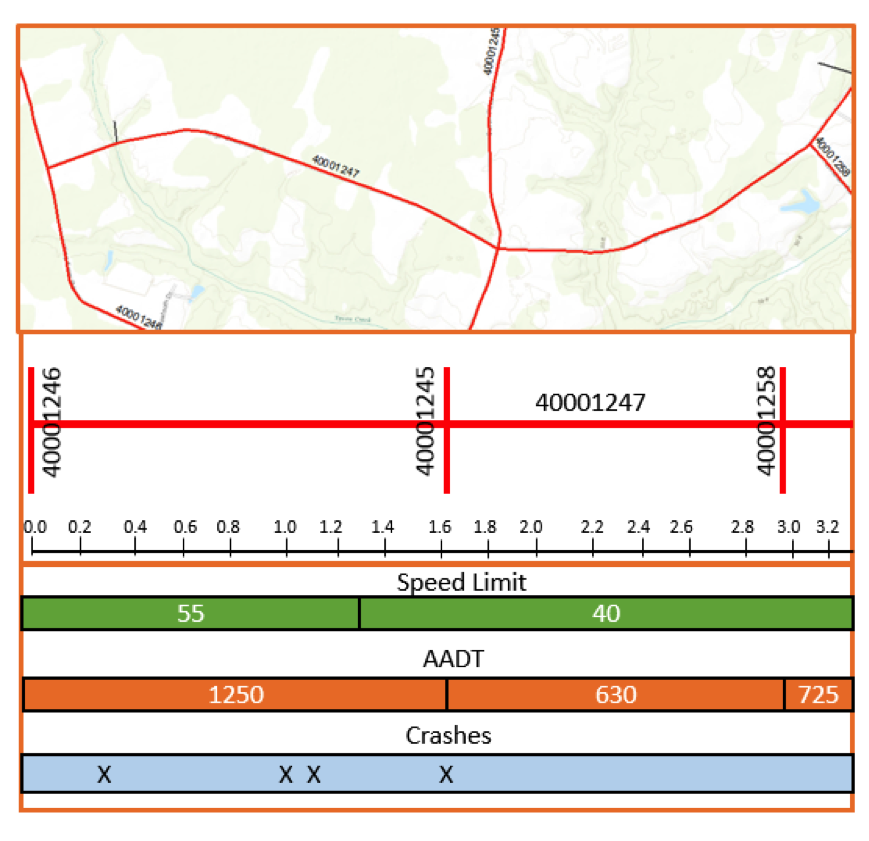
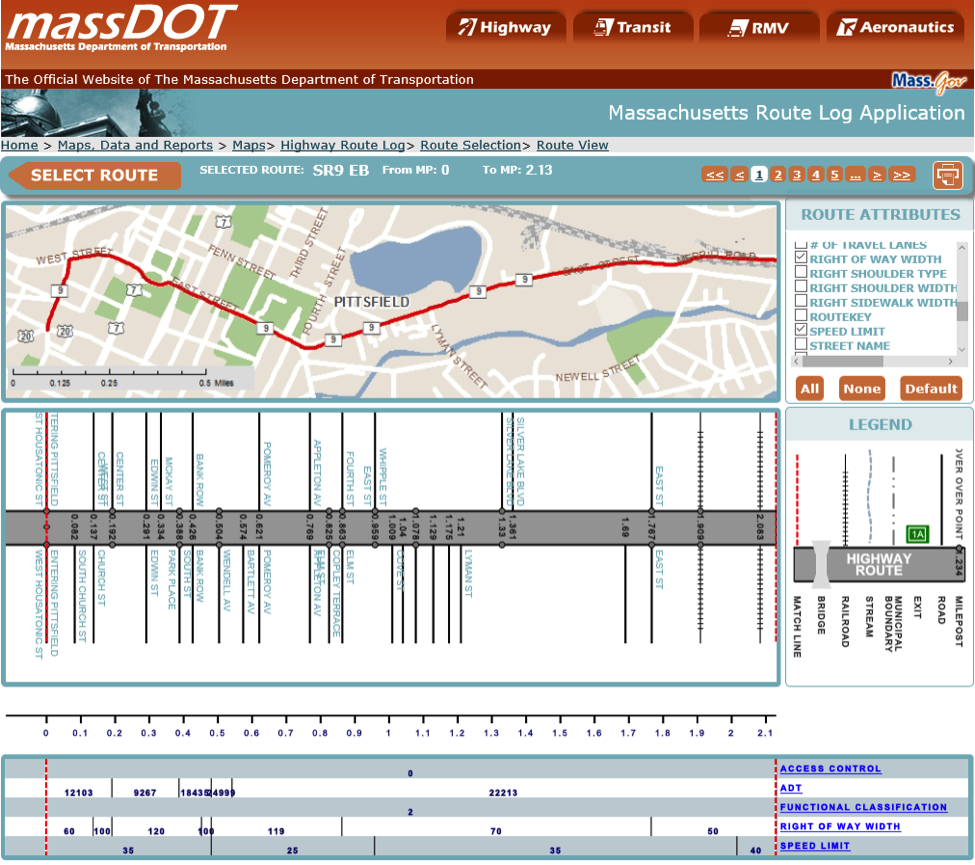
The specific layout of SLDs varies from one organization to another. One common layout for an SLD includes three components: a map component, a schematic component, and an attribute component. The map component often appears at the top of the SLD and presents the alignment of the route of interest. The schematic component, sometimes referred to as a stick diagram, presents the route as a straight line and can incorporate roadway features such as intersections, bridges, ramp entrances, and exits and legal boundaries. The attribute component includes roadway event data presented along the same horizontal axis. Linear events such as speed limit are displayed as a series of horizontal bars with the extent of each bar corresponding to the region over which the attribute has a constant value. Point events are displayed as point symbols positioned according to their location along the route.
Historically, SLDs were manually created and assembled into books for reference across the organization. Given the effort required to generate SLDs in this manner, the books often reflected data which was somewhat dated. Today, most SLDs are created dynamically from current event data using sophisticated GIS software applications.
As an example, the Massachusetts Department of Transportation uses a web-based tool called Massachusetts Route Log to generate Straight Line Diagrams (SLDs). Here is an example SLD generated from this application for a portion of State Route 9.
Vermont’s Agency of Transportation (VTrans) has a similar SLD tool called VTrans Routelogs.