Qualitative Risk Analysis
Several qualitative approaches exist to characterize risk probability once they are identified. All of these will depend on someone or some group's judgment about the probability and impact of identified risks--augmented by information from past, similar projects if studies are available. Risk probability analysis can fall on one person, and that person may likely be the project manager. Alternatively, a project manager could compile a list of significant risks, and then ask the project team, clients, end users, sponsors, or experts in the field to rank each item in the list. In this way, each item can be ranked in a form of timely consensus.
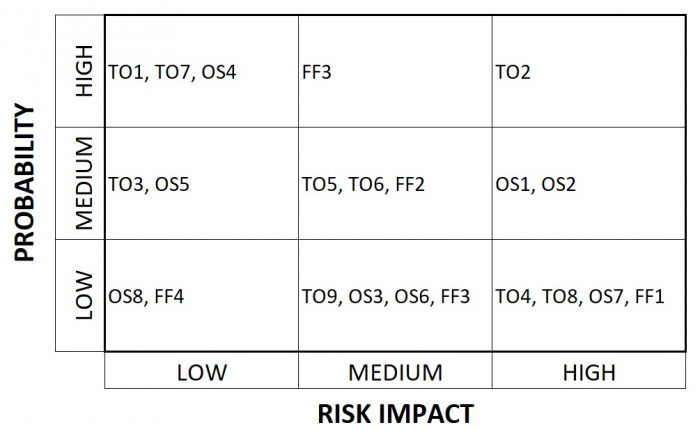
A risk matrix takes such information on all identified risks and orders or assigns a probability to the risk and weight factor to the potential impact of the event occurring. In qualitative risk analysis, once all risks are ordered or assigned, probability and impact of various risks can be simply classified as high, medium, or low. In some cases, a "very high" classification is used. Risks of most concern should be those of high probability and high negative impact on the project. Risks of the least concern are those of low probability and low impact. The general format for a risk matrix is shown in Figure 8-1, below. As part of presenting a risk matrix, it is important to define the Probability and Impact categories. NOTE: This is just an example of a graphical tool (with a 3 by 3 grid) to display risk impact and probability. For Assignment #7, you may choose to create a more detailed grid with a larger number of impact and/or risk probability categories, perhaps assigning a qualitative scoring using number score (e.g., 1 to 5 or 1 to 10). Avoid making it more detailed than necessary to support an ability to analyze risk and apply risk response strategies during project execution.
Quantitative risk analysis is more complex than qualitative approaches. Quantitative risk analysis requires more data on past project performance and more rigorous analysis methods. Schwalbe (subsection 11.6--not required reading) discusses the use of quantitative methods that might be applicable to some types of projects. However, for IT and GIS projects, qualitative approaches are more frequently applied and may be preferable to quantitative methods, especially if factors such as probability and impact are difficult to quantify. It may be of no benefit to the planning of a project to spend additional time creating inexact metrics of risk if no such information exists.