Earth System Sensitivity
As we saw in the previous section on carbon cycle feedbacks, there are some limitations in the traditional framework for assessing the climate response to anthropogenic forcing. In the case of carbon cycle feedbacks, the assumptions implicit in that framework regarding the relationship between carbon emissions and resulting concentrations may underestimate the future increase in levels, and the degree of climate change.
Another problem in the traditional framework is that the assessment of climate sensitivity—a topic we have looked at in depth in Lesson 5 of this course—may be too limited. Implicit in the traditional definition of climate sensitivity is the so-called "Charney" notion of climate sensitivity—named after a famous climate scientist (Jule Charney) and a late 1970s report of the National Academy of Sciences known as the "Charney Report" which provided the first real estimate of the range of uncertainty in the equilibrium climate sensitivity. The concept of climate sensitivity described in this report, sometimes called the "Charney Sensitivity", envisions the equilibrium sensitivity of Earth's climate to forcing as the equilibrium response of the climate system to a doubling of concentrations including all fast feedbacks—that includes changes in water vapor, clouds, sea ice, and perhaps even small ice caps and glaciers.
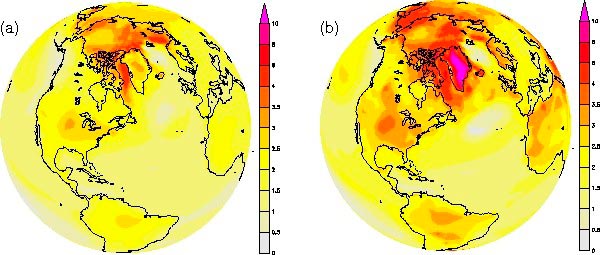
The limitation implicit in this definition becomes apparent as soon as we start to think of the lasting, multi-century impacts of anthropogenic climate forcing. The fast feedbacks do not, for example, include the slow retreat of the continental ice sheets or the slow response of the Earth's surface properties and vegetation as, e.g., boreal forests slowly expand poleward. Accounting for these slow feedbacks leads to the possibility that the equilibrium long-term response to anthropogenic greenhouse gas emissions is larger than the IPCC projections we have focused on up until now. This more general notion of climate sensitivity is typically referred to as Earth System sensitivity.
There is good evidence from long-term geological record of climate change that these slow feedbacks do indeed matter, and that the ultimate warming and associated changes in climate might be substantially larger than what is implied by the simple Charney definition of sensitivity implicit in the IPCC projections. For both the mid-Pliocene, roughly 2.8 MY ago, and the mid-Miocene, about 15 MY ago, global mean temperatures appear to have been warmer than would be expected from even the upper range of the estimated Charney sensitivity (4.5°C for doubling). This suggests an earth system sensitivity that is substantially higher than the standard Charney estimate of climate sensitivity.
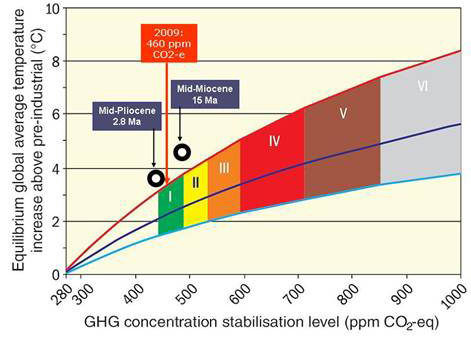
Studies using climate models that incorporate these slow feedbacks find that the Earth System sensitivity is indeed substantially greater than the nominal Charney sensitivity, roughly 50% higher. Thus, a stabilization of levels at twice pre-industrial levels over the next century might lead to a warming of 3°C over the next 1-2 centuries, but an eventual warming closer to 4.5°C once the land surface and vegetation has equilibrated to the new climate and the ice sheets have melted back to their new equilibrium configuration for the higher concentration—a process that could take a thousand years, but perhaps substantially less.