One of the key unknowns in the behavior of the climate, as we have seen, is the sensitivity—how much warming we can expect in response to a doubling of atmospheric concentrations. Current evidence suggests a most likely value of around 3.0°C warming, but there is—as we have seen—a wide range, anywhere from roughly 1.5°C to 4.5°C. Scientists attempt to try to constrain estimates of this key quantity by comparing model simulations with observations.
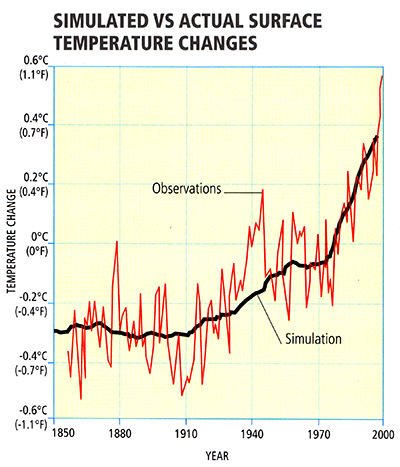
For example, scientists use models similar to the zero-dimensional EBMs we discussed in Lesson 4, driving them with the estimated changes in both natural factors (volcanoes and solar output) and human factors (greenhouse gas increases and sulfate aerosol emissions). Since the climate sensitivity is simply a parameter that can be changed in the model, scientists can do many simulations using different values of the climate sensitivity, and observe which values yield the best fit with the observations.
Such experiments can be done over the modern period back to the mid 19th century, during which observations of global mean temperature are available.
© 2015 Dorling Kindersley Limited.
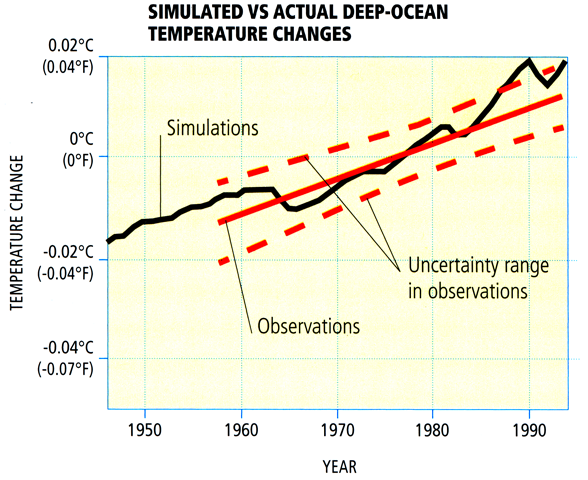
During the shorter period of the past half century when deep ocean temperature observations are available, experiments can be done to compare the model-simulated changes in ocean heat content with those that have been observed.
© 2015 Dorling Kindersley Limited.
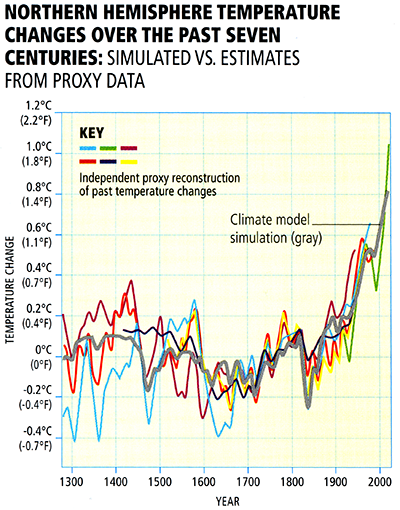
For the longer period of the past millennium during which temperature changes, as we have seen in Lesson 3, have been documented based on climate proxy data—it is possible to compare simulated and observed changes over a longer time period, providing potentially tighter constraints on climate sensitivity. The computer model simulations in this case are driven by longer-term estimates (e.g., from ice core evidence) of natural (volcanic and solar) forcings as well as modern anthropogenic forcing:
© 2015 Dorling Kindersley Limited.
© 2015 Dorling Kindersley Limited.
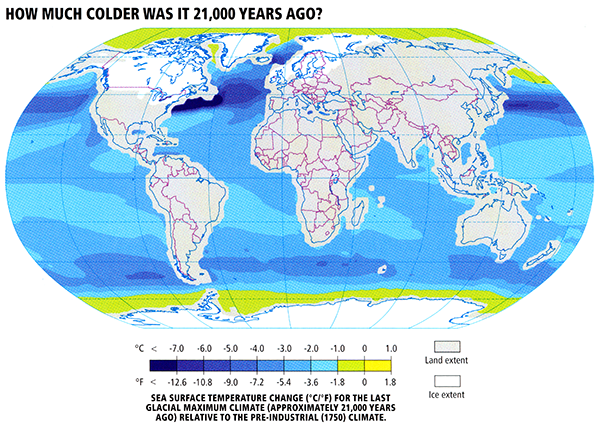
Going further back in time, scientists compare climate model simulations of the cooling during the height of the Last Glacial Maximum (LGM) roughly 21,000 years ago resulting from lowered atmospheric CO2, increased continental ice cover, and altered patterns of solar insolation, and proxy evidence of ocean surface cooling derived from climate-sensitive surface dwelling organisms trapped in ocean sediment cores.
© 2015 Dorling Kindersley Limited.
Finally, going even further back in time, into the deep geological past, scientists compare model results with geological evidence of past warm and cold periods.
The overall evidence from all of these different lines of evidence regarding both human-caused and natural climate changes over a broad range of time scales, is that the equilibrium climate sensitivity likely falls within the range of 1.5°C to 4.5°C for doubling, with a most likely value of roughly 3°C warming.
Given the full array of available evidence from instrumental and paleoclimate proxy data, and the comparisons of this evidence with theoretical estimates, there is a very low likelihood of either a trivially small (e.g., 1.5°C or less) or extremely high (greater than 7°C) equilibrium climate sensitivity.