
So, we have seen in the previous section that climate models have been used to make some very successful predictions in the past, and there is reason to take them seriously. Can we use these models to go a step further than we already have? We have seen in previous lessons that modern-day climate change appears anomalous and without any obvious precedent in the historical past. That alone does not establish that the changes that we are seeing—warming of the Earth's surface, and many other changes—are due to human impacts. Using climate models, we can, however, address this issue of causality. We can use the models to investigate the hypothesis that the observed changes can be explained by nature alone, and the alternative hypothesis that they can only be explained by a combination of human and natural factors. Investigations employing more than 20 state-of-the-art climate models (see below) show that natural factors alone cannot explain the global temperature record of the past century—including the long-term warming trend—while human factors, combined with the natural factors, can.
Some might argue that this alone is not convincing evidence. Perhaps, for example, we simply have the trend in solar output wrong and the true trend in solar output closely resembles the trend in human impacts (i.e., greenhouse forcing + anthropogenic aerosols). Then we might be misinterpreting the goodness of the fit shown above.
Let us, for argument's sake, accept that criticism. Is there some other type of comparison of observations and model predictions that might be more robust in this situation? Well, we can try to take advantage of the fact that the patterns of response to different forcings might look different. It turns out that the surface expressions are not that different—the surface expression of warming due to solar output increases actually looks a fair amount like the pattern of surface warming due to greenhouse gas increases. The vertical patterns of temperature change, however, as we alluded to previously in the course, are expected to be quite different. They provide a true fingerprint to search for—and indeed, the process of using the expected patterns of response of different forcings to determine which forcings best explain the observed changes is known as fingerprint detection.
The vertical pattern of response to increasing greenhouse gas concentrations is one in which the troposphere warms (as we have seen in previous exercises), but the stratosphere cools at the expense of this tropospheric warming; greenhouse forcing is a zero-sum game and there is no increase in radiation at the top of the atmosphere, but merely a redistribution of energy and radiation within the atmosphere. The vertical pattern of temperature change we would expect for an increase in solar output, however, is one in which the entire atmosphere warms, from top-to-bottom, as there is an increase in the received radiation at the top of the atmosphere which warms the entire atmospheric column. The pattern of temperature response to an explosive volcanic eruption is yet different from either of these patterns. From comparing the observed patterns of vertical temperature change to model simulations of the responses to each of these different factors, we find that only greenhouse surface warming exhibits the vertical pattern consistent with the model's predicted fingerprint (in fact, there is also the impact of ozone depletion on the cooling of the stratosphere, but even after accounting for that effect, the remaining trend can clearly only be accounted for by greenhouse forcing).
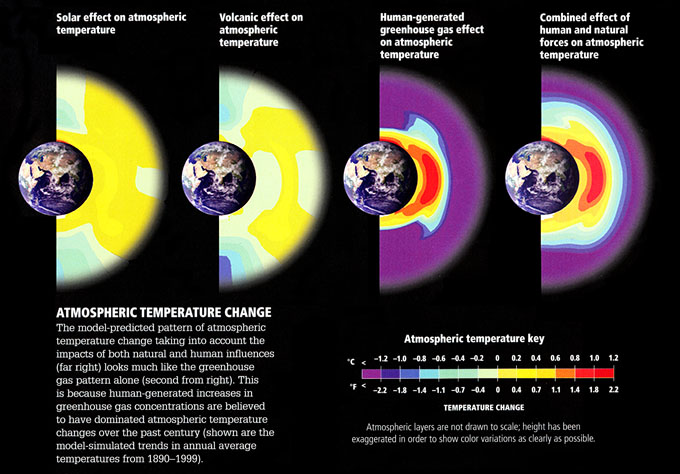
Figures (left to right):
- Solar effect on atmospheric temperature
- temperature ranges from -1.1ºF to 1.1ºF
- Volcanic effect on atmospheric temperature
- temperature ranges from -1.4ºF to 1.1ºF
- Human-generated greenhouse gas effect on atmospheric temperature
- temperature ranges from -2.2ºF to 2.2ºF
- Combined effect of human and natural forces on atmospheric temperature
- temperature ranges from -2.2ºF to 2.2ºF
Atmospheric Temperature Change: The model-predicted pattern of atmospheric temperature change taking into account the impacts of both natural and human influences (far right) looks much like the greenhouse gas pattern alone (second from right). This is because human-generated increases in greenhouse gas concentrations are believed to have dominated atmospheric temperature changes over the past century (shown are the model-simulated trends in annual average temperatures from 1890-1999)
© 2015 Dorling Kindersley Limited.