James Hansen is a well known climate scientist who formerly directed NASA's Goddard Institute for Space Studies.
He was the first climate scientist to testify in the U.S. Congress that human-caused climate change had indeed arrived, back during the hot summer of 1988. Today, as far greater evidence has amassed, his early comments appear especially prescient.
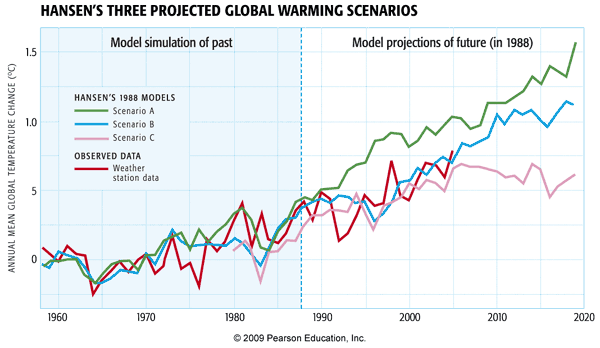
During his 1988 congressional testimony, Hansen showed the results of simulations he had performed using the NASA GISS GCM—the very same climate model explored in the EdGCM experiments of the previous section. These simulations included not only historical simulation of past climate changes, but three possible projections of future warming that depended on different possible future fossil fuel utilization scenarios.

Yogi Berra is quoted as having once said, "predictions are hard—especially about the future". Indeed, there is no better test than making a prediction about the future, and looking back and seeing how it panned out. This sort of post hoc validation is often done with numerical weather models. It's more difficult to do with climate models, however, because you have to wait not days or weeks, but years to see how the prediction actually measured up.
Hansen's 1988 simulations, in this regard, can be viewed as one of the great validation experiments in climate modeling history. In these experiments, Hansen included a high, medium, and low fossil fuel future emissions scenario, corresponding to the green, blue, and purple curves respectively. As it turns out, our actual fossil fuel emissions scenario during the two decades subsequent to Hansen's 1988 projections, has corresponded most closely to his middle scenario, the blue curve. And as you can see from the subsequent observations (the red curve), his prediction for that scenario quite closely matched the observed warming.
Now, you may have noticed, however, that this model simulation didn't capture the observed multi-year cooling in 1992. Is that a fault of the simulation?
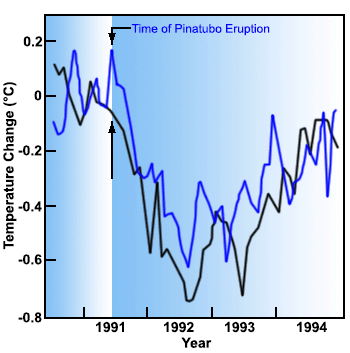
No!—there is no way that James Hansen (or anyone for that matter) could have predicted the eruption of Mt. Pinatubo. And rather than proving a fault with the model, the Pinatubo eruption actually provided Hansen with another key test of the climate models. It takes about 6 months for the volcanic aerosol to spread out around the globe and begin to have a global cooling impact. This gave Hansen about six months to run his model and make a prediction, at the instant Pinatubo erupted. As you can see, he was able to predict quite accurately the short-term cooling of the globe by a bit less than 1°C that would result from this eruption. His model simulation (the black curve below) actually predicted a bit too much cooling (observations shown by the blue curve below). But that, too, wasn't his fault. El Niño events occur randomly in time, and there was no way to know that an extended El Niño event would occur in 1991-1993, offsetting some of the volcanic cooling: As you found in your first problem set, El Niño events warm the globe by about 0.1-0.2°C.

These examples may be the most striking examples of how the models have been validated, but they have been validated in many other, more mundane ways. In fact, the various reports of the IPCC include hundreds of pages of 'model validation' showing the models do a good job capturing the main fluxes of energy and radiative balances, the general circulation of the atmosphere and the major ocean current systems, the amplitude and pattern of the seasonal response to changing patterns of solar insolation, etc.

