
There are many ways one can generalize upon the zero-dimensional EBM. As we saw in the previous section, we can try to resolve the additional, vertical degree of freedom in the climate system through a very simple idealization—the one layer generalization of the zero-dimensional EBM. If for no other reason than the fact that the incoming solar radiation is symmetric with respect to longitude, but varies quite dramatically with latitude, the latitudinal degree of freedom is the next most important property to resolve if we wish to obtain further insights into the climate system using a still relatively simple and tractable model.
That brings us to the concept of the one-dimensional energy balance model, where we now explicitly divide the Earth up into latitudinal bands, though we treat the Earth as uniform with respect to longitude. By introducing latitude, we can now more realistically represent processes like ice feedbacks which have a strong latitudinal component, since ice tends to be restricted to higher latitude regions.
Recall that we had, for the linearized zero-dimensional gray body EBM, a simple balance:
- where is the Earth's albedo and A and B are coefficients for the linearized representation of the 4th degree term.
Generalizing the zero-dimensional EBM, we can write a similar radiation and energy balance equation for each latitude band i:
- where represents each latitude band.
We have now introduced some extremely important generalizations. The temperature , albedo , and incoming solar radiation are now functions of latitude, allowing us to represent the disparity in incoming shortwave radiation between equator and pole, and the strong potential latitudinal dependence of albedo with latitude—in particular, when the temperature for a particular latitude zone falls below freezing, we represent the increased accumulation of snow/ice in terms of a higher albedo. The global average temperature is computed by an appropriate averaging of the temperatures for the different latitude bands .
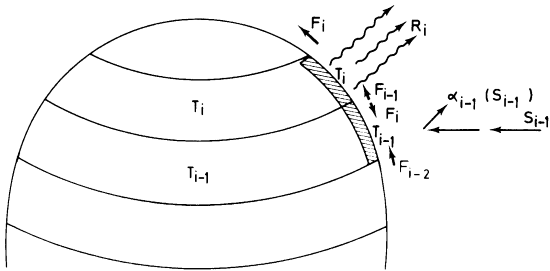
Recall that the disparity in received solar radiation between low and high latitudes leads to lateral heat transport over the surface of the Earth by the atmospheric circulation and ocean currents. In the absence of lateral transport, the poles will become increasingly cold and the equator increasingly warm. Clearly, we must somehow represent this meridional heat transport in the model if we expect realistic results. This can be done through a very crude representation of the process of heat advection through a term that is proportional to the difference between the temperature, where is some appropriately chosen constant, and is the global average temperature. This term represents processes associated with lateral heat advection that tends to warm regions that are colder than the global average and cool regions that are warmer than the global average.
This gives the final form of our one-dimensional EBM:
The model is complex enough now that there is no way to simply write down the solution anymore. But we can solve the model mathematically, through a very simple and primitive form of something we will encounter much more of in the future—a numerical climate model.
One of the most important problems that was first studied using this simple one-dimensional model was the problem of how the Earth goes into and comes out of Ice Ages. Use the links below to open the demonstration, which is in 3 parts.
METEO 469: One Dimensional Energy Balance Model Demo - part 1 (3:54)
PRESENTER: Let's now do an actual experiment here with our one-dimensional energy balance model where we've now generalized the energy balance model to allow for discrete latitude zones. And we calculate the energy balance as we did before between the incoming solar radiation, the outgoing long-wave radiation, the reflected radiation. We use the same energy balance principles that we used in the zero-dimensional model, but now we're allowing for different solutions of the energy balance model and different latitude zones.
And importantly, we are going to allow for these fluxes, these lateral fluxes of energy F between latitude zones, which represent the very important role that atmospheric and oceanic motions play in transporting heat on the whole from low latitudes to higher latitudes to make up for the imbalance between outgoing and incoming radiation at the tropics and at the poles. There's a surplus of energy at the equator, a deficit of energy at the poles. And so we need these lateral fluxes to make up for that imbalance
So let's take a look at a problem that was first attacked using this sort of approach, the one-dimensional energy balance modeling approach. We're going to use a program that was written in MATLAB. And you can see, this is sort of the heart of the program. It does the energy bounce calculations for each latitude zone. Here, we've specified the lateral heat flux transport coefficient F.
We're using gray body parameters for the energy balance of the sort you saw before in the zero-dimensional model. And we are now accounting for the possibility that the albedo will be vastly different depending on whether a particular latitude zone is ice covered, in which case it has a relatively high albedo, or not ice covered, in which case it has relatively low albedo.
And we will determine whether or not a latitude band is likely to be ice covered through a simple threshold, a parameterization here where if the average temperature for that latitude band is below minus 10 degrees Celsius in the annual average, then it will be ice covered. And that's the assumption that we'll be making. It's not a bad assumption if you look overall at the relationship between mean annual temperatures and which latitude zones are indeed mostly covered by ice in the real world.
And we will perform experiments in which we slowly change the solar constant from a relatively high value larger than today's solar constant to a relatively low value. And we'll see how the temperature of the Earth and of different latitude zones changes. And then we'll increase the solar constant from that low value to the high original value and again, see how Earth's temperature changes. Now we know that changing albedo will be coming into the problem. There will be transport of heat between different latitude zones. So this is a more sophisticated model than the sorts of models that we've looked at so far.
METEO 469: One Dimensional Energy Balance Model Demo - part 2 (4:40)
PRESENTER: Now that we're dealing with an additional degree of freedom-- we've now got the latitude to deal with-- we'll have to do a little bit of geometry. We have to take into account the geometry of Earth's tilt and the variation in incoming solar radiation at the top of the atmosphere as a function of latitude. So all those calculations-- the geometry and the distribution of insulation as a function of latitude-- is calculated in some subroutines.
And that is incorporated, of course, into our solution of the one-dimensional energy balance model. So let's actually run that model, It's simply run by me executing the command one_dim_ebm-- One-Dimensional Energy Balance Model. OK. And when it's done, first of all, it calculates the insulation at the top of the atmosphere as a function of latitude, where we, of course, have very high values of solar installation near the equator, very low values near the pole.
And it is now varying the solar constant. We're describing that through a solar multiplier. So it varies the solar constant from 40% larger than its current value, a multiplier of 1.4, the way to 40% lower than its current value, a multiplier of 0.6. And a multiplier of 1 is the current value of the solar constant.
What the red curve shows is what happens to the average temperature of the earth, which is constructed by averaging over all the latitude bands, each of which has its own temperature, as you lower the solar constant from a value that's 40% larger than it is today to, let's say, the current-day value.
By the time you decrease the solar multiplier to the current day value, you get a temperature somewhere in the range of 15 degrees Celsius or so, which we know is, in fact, a pretty reasonable estimate of the average temperature of the earth. And as we decrease it further, the temperature, of course, decreases, but something very interesting happens.
Suddenly, we reach a critical point where the temperature drops quite rapidly to well below freezing and, of course, continues to drop further as we lower the solar multiplier further. What's happening here is as Earth temperature is getting colder and colder, the latitude zones that are occupied by ice are spreading further and further towards the equator until eventually we reach a point where the entire earth becomes covered with ice and the albedo plummets dramatically. Sorry, the albedo increases dramatically, and Earth's temperature, therefore, plummets dramatically.
Now we have an ice-covered Earth as we continue to lower the solar constant. It, of course, continues to cool, but the ice cover isn't changing. We have a frozen Earth. Now what happens if we instead start out with a solar constant that is 40% below the current value and continue to increase it? Well, that's what's shown by the blue curve. And something very interesting happens.
As you start with a frozen, ice-covered Earth, solar constant 40% lower than today, it, of course, warms as we increase the solar multiplier, but it's still ice-covered. It's still ice-covered. It's still ice-covered. And it actually remains ice-covered, and the temperature remains very low-- the average temperature of the earth remains well below 0-- all the way until we reach a solar constant of 30% larger than today.
At that point, we now suddenly begin to melt away the ice fairly rapidly. And as soon as we do that, Earth temperature increases very rapidly. Now we have an ice-free Earth, and we're back where we begun. And if we increase the solar multiplier to 1.4, we are precisely where we started out.
METEO 469: One Dimensional Energy Balance Model Demo - part 3 (4:54)
PRESENTER: OK, so what happened here? We found that this system has a very interesting and non-intuitive property that for a given value of the governing parameters-- for example, for a solar constant of 1,370 watts per meter squared, Earth's temperature can potentially have two very different values. It doesn't have a unique value. It can either have a value similar to what we see today or a temperature below 30 degrees below 0 Celsius for the current day solar constant.
And what determines which of those two temperatures it's likely to have is the prior history. The properties of the system depend on its prior history. If we had started out with a frozen Earth and increased the solar constant to its current-day value, we would still have a frozen Earth.
And that's because the ice, once it accumulates and increases the albedo, which is reflecting away most of the solar radiation, it's fairly difficult to get rid of that ice, and only when you turn up the solar constant to a very high value are you able to melt away the ice, suddenly lower Earth's albedo from the albedo of an essentially frozen planet, and Earth's temperature can warm quite a bit.
On the other hand, if you start out with a very warm Earth and slowly lower the solar constant, you're not going to form ice until Earth's average temperature gets well below 0 degrees Celsius, and the various latitude zones now start dropping below that critical threshold temperature of minus 10 degrees Celsius, which is the temperature we specified represents when a latitude zone becomes ice-covered. And then, at that point, of course, the albedo increases dramatically, and Earth's surface temperature cools rapidly.
So the temperature of the Earth depends not only on the value of the governing parameters-- in this case, the solar constant-- but the prior history of the system. That is a property that's known as hysteresis, when the properties of a system depend on its prior history, not just on the governing parameters. It is an intrinsically nonlinear property. It's a property of complex systems which exhibit non-linear behavior. And in particular, in this case, bi-stable behavior that for a given value of the parameter, there are two stable points in terms of Earth's surface temperature.
And under some circumstances in systems like this, it's possible to undergo transitions rapidly between these two stable states. That is one theory for explaining the dramatic changes in the meridional overturning circulation of the North Atlantic Ocean that has taken place in the past, and we've talked a little bit about that in the past. We'll talk a little bit more about that in the future.
This is an example of a non-linear and, in this case, a bi-stable system. And in general, as our models become more complex-- in this case, we've generalized the model from 0 dimensions to 1 dimension. We've allowed for the possibility of a temperature dependent albedo. As soon as we start to make our models more complex, more detailed, more sophisticated, we introduce the possibility of very unusual, potentially unusual behavior of the system, this sort of non-linear behavior. And this is something that we'll talk quite a bit more about in this course.
It's relevant to the issue of thresholds and the possibility that as we continue to warm Earth's climate, we will pass certain critical thresholds where the climate system will undergo rapid transitions from its current state to some new state.
Finally, it's worth noting that this original model, constructed by a Russian scientist named Budyko decades ago in the mid 20th century, represented a real conundrum for climate scientists because it suggested that once Earth goes into a frozen ice-covered state, which it has in the past, it is very difficult to get out of that state. Even at current values of the solar constant, the Earth cannot come out of this frozen state.
The solution, it turns out, to this problem has to do with carbon cycle feedbacks and what happens with the Earth's carbon cycle when this happens. We'll talk more about that later on in the course.