Lab Course

What is a Lab course?
A lab course provides the setting for students to gain "hands-on" research experience while working through course material online.
What are the affordances of this model?
An online lab course shifts the traditional teacher/ student/ classroom paradigm to afford students the opportunity to utilize simulators and tools to manipulate actual data that is related to the topics the students are learning. Interactive lab activities help students engage with data and related tools to manipulate and practice course concepts, learning and committing new ideas to long-term memory.
Things to pay attention to:
Consider procedures that you would like your students to practice, as well as various data types and related tools that will help your learners gain the practical experience they need to prepare for their future careers. The online lab provides a setting in which to scaffold the learning of your students with your handpicked activities. The following pages are from the beginning of a lesson. Note the structured layout of the material, providing students with clear learning objectives and instructions for working with relevant research data and tools in this lesson.
We look forward to working with you!
Contact us directly or visit the Dutton Website to learn more!
Introduction to Earth 103
Welcome to Earth 103: Earth in the Future!
Tim Bralower wanted to create a course that could earn students a lab credit without needing "formal" lab equipment.
Students complete 8 labs using Google Earth. First, students are given a worksheet that walks them through the steps to complete the practice lab. This prepares them for the graded version of the lab. The practice labs foster student readiness, so they know how to make all of the adjustments in Google Earth. Then, when they need to complete the graded version, their acquired knowledge helps them work through the lab material in Canvas. Instead of turning in lab reports, students complete the graded version of the lab worksheet and then answer the questions in a Canvas Quiz.
Module 8: Water Resources and Climate Change
Video: Earth 103 Water Module (2:04)
Today, there are more than a billion people living without access to clean drinking water and that's really hard for us to imagine on the east coast of the United States, where there is water everywhere. Today, I'm standing in a stream near Lemont, Pennsylvania. And if I were here a hundred years ago, I would have readily taken a sample of this water and drunk it. But I’m not quite so sure about that today. There are factories around, there's farms around, and this water is probably not quite good enough to drink. This stream behind me is a tributary to the Chesapeake, and ultimately this water ends up in the Chesapeake Bay, and if I can't drink this water here in rural Pennsylvania, can you imagine what it's like by the time this water gets to the Chesapeake? It would definitely be a bad decision to drink the water flowing into the Chesapeake Bay today.
The other part about being on the east coast of the United States is we're in a lush region, and climate change here is forecasted to make this region maybe a little bit more lush and a little bit higher rainfall in the future. We'll never have a problem with access to drinking water in this part of the world. But if we go out to the western part of the U.S., climate change forecasts predict that the region will become a lot drier, and communities out west in the U.S. are going to have to make really tough decisions as to how they manage their water resources. Such tough decisions have already been made in places around the world such as Australia, where devastating droughts over the last two decades have led rivers to virtually reverse course, and communities have had to make very tough decisions about how they manage their water resources.
So, in this module, we'll learn a lot about how water behaves on the surface of the planet, what is going to happen in the future with climate change, and the choices communities are going to face with dwindling water resources. Now, enjoy it, and please get started.
Introduction
There is a new generation of super-rich, highly influential people who are starting to invest massive amounts of money and influence in truly important causes. Bill and Melinda Gates in global health, Warren Buffett in reproductive health and food, the Jolie-Pitts in community development, and the Katrina recovery effort. Now, enter Matt Damon and Gary White, who have co-founded water.org, an organization dedicated to developing and delivering solutions to the global water crisis. Visit water.org, and you will find an impressive array of information and programs. Here are direct facts from that site that convey the magnitude of the current global water emergency.
- Nearly 1 billion people are living without accessible water
- 2.5 billion without adequate sanitation
- 440 million school days lost
- 220 million hours each day are spent collecting water
- 3.7 miles walked each day by women and children
- 4100 children under five die each day from a preventable water-related illness
- 3.4 million people die each year from a preventable water-related disease
More than any other resource, with the exception of food, water is crucial for human survival. Ancient civilizations were repeatedly forced to deal with the threat of diminishing water supply. Now, climate change presents a new threat by causing the supply and distribution of water to change over the coming decades and centuries. This situation will be made significantly more dire by explosive population growth in parts of the world where water is scarce and by pollution that will continually limit the supply of clean drinking water. The IPCC (2007) stated the situation very clearly: “Water and its availability and quality, will be the main pressures on, and issues for, societies and the environment under climate change.” The latest 2022 report stresses the need for adaptation. This will be much easier in the developed world than in developing countries, where resources are limited.
Because groundwater systems recover very slowly from human impacts, remediation can be extremely difficult and expensive. In this module, we begin by examining the distribution and behavior of water close to the Earth’s surface; next, we consider how climate change will alter the supply of water and how population growth will change the demand; finally, we present management strategies that will hopefully preserve the supply of water for humans around the globe.
Ancient civilizations developed in some of the driest realms of the planet. Populations in Egypt and Mesopotamia (an area that includes parts of modern Iran, Iraq, Syria, and Turkey) learned how to survive in an arid environment. For example, ancient Egyptians and Mesopotamians constructed an extensive network of canals to transport water away from the Nile River for irrigation. Shadufs, which are contraptions consisting of buckets at the end of a boom which could be lowered with a rope, were used to haul water out of the canals and onto the fields. These civilizations routinely had to live with highly irregular precipitation, consisting of periods when large amounts of rainfall flowed through the canals and flooded large areas, alternating with times of almost no rainfall.
Examples of Ancient Civilizations
As the population has increased, and especially with the rise of industry in developed nations, so has demand for water soared. Moreover, industry has increased competition, often for the cleanest drinking water supplies.
Nowhere has the interplay between the increasing demand and limited supply of water been more complicated than in the desert southwest of the US. The city of Los Angeles receives a meager 38 cm (15 in) of rain a year. Yet, the city has the highest water usage in California and some of the highest use rates in the country. You would never know by looking at the number of golf courses and car washes and the abundance of lush, green lawns that the city is located in a desert. The same is true for Las Vegas, which receives significantly lower rainfall.
Los Angeles uses much more water than it receives from precipitation and, thus, it imports water from the northern part of California and from states to the east via the Colorado River. In fact, much of the development of Los Angeles was fueled by this supply of water from the Owens Valley in the Sierra Nevada and the Colorado River to the east. Water from the Colorado River began to flow into Los Angeles in the 1920s and 1930s and included the construction of Parker Dam and the Colorado River Aqueduct.
Water Supply and Demand
The growth of other cities that lie in arid locations closer to the Colorado River, including Denver and Phoenix, will likely lead to bitter litigation over water rights in the southwest in the coming decades. Overseas, countries in arid parts of the globe, for example, Turkey, Iraq, and Syria have also had major disputes about water rights and management. Turkey, which lies at the source of the Tigris and Euphrates rivers, has constructed dams on both rivers for irrigation purposes as well as for hydroelectricity, and this has led to long conflicts with countries downriver including Syria and Iraq.
With projections for the increasingly rapid growth of world population and coupled demand for water for drinking and agriculture, as well as for industry, maintaining a clean water supply looks to be one of the grand challenges of the 21st century. The goals of this module are to learn about how water is cycled on the Earth’s surface and how climate change coupled with the growth of the population will accentuate the global water crisis.
Goals and Learning Outcomes
Goals
On completing this module, students are expected to be able to:
- describe the processes that affect the flow of water in aquifers;
- explain how human activity is impacting the quality of water;
- predict how climate change will affect water supply in different locations;
- propose strategies to cope with an increasingly thirsty planet.
Learning Outcomes
After completing this module, students should be able to explain the following concepts:
- the uneven distribution of water on Earth’s surface
- how water is cycled near the Earth’s surface
- behavior of water in aquifers
- the concepts of permeability, porosity, water table
- causes of land subsidence
- causes of cone of depression and groundwater contamination
- arsenic groundwater contamination crisis
- cause of saltwater incursion
- climate change predictions for water supply
- drought and its consequences in different parts of the globe
- water management, including desalinization
- the growing battle over water in the western US
Assignments Roadmap
Below is an overview of your assignments for this module. The list is intended to prepare you for the module and help you to plan your time.
| Action | Assignment | Location |
|---|---|---|
| To Do |
|
|
Distribution of Water on the Earth's Surface
Introduction
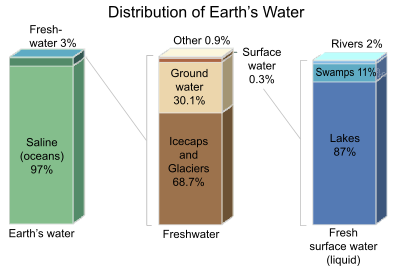
The distribution of water on the Earth’s surface is extremely uneven. Only 3% of water on the surface is fresh; the remaining 97% resides in the ocean. Of freshwater, 69% resides in glaciers, 30% underground, and less than 1% is located in lakes, rivers, and swamps. Looked at another way, only one percent of the water on the Earth’s surface is usable by humans, and 99% of the usable quantity is situated underground.
All one needs to do is study rainfall maps to appreciate how uneven the distribution of water really is. The white areas on the map below had annual rainfall under 400 mm for the last year, which makes them semi-arid or arid. And, remember, projections are for significant aridification to occur in many dry regions and for more severe rainfall events to characterize wet regions.
The Water Cycle
The following video provides a schematic summary of the water cycle.
Video: The Water Cycle (1:23) This video is not voice narrated.
The hydrologic cycle describes the large-scale movement of water between reservoirs including the ocean, rivers and lakes, the atmosphere, ice sheets, and underground storage or groundwater.
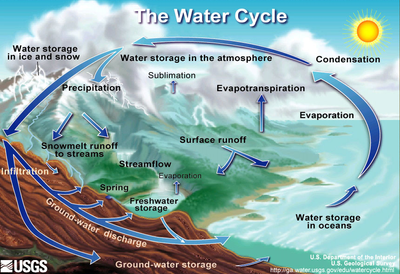
Water evaporates from bodies of water such as the ocean and lakes to form clouds. The moisture in clouds ultimately falls as rain or snow, some of which returns back to the ocean, lakes, and rivers. The remainder percolates into the soil, where it reacts with organic material and minerals and ultimately moves downwards to form groundwater. The amount that percolates depends strongly on evaporation as well as soil moisture, as shown in the video below.
Video: NASA Land Globe Animation (1:00) This video is not voice narrated.
As rain and snow fall to earth over the land, the increase in water competes with the loss of water due to daylight evaporation.
Precipitation: 0.01 to 10 millimeters per hour in steps of (0.01, 0.1, 1, 10)
Different kinds of soil retain different amounts of water in the ground, so the flow of rivers and the filling of underground aquifers can be hard to predict.
Rate of change of total land water: -1.5 to 1.5 grams per square meter per second in steps of (0.5)
Freshwater used for drinking, agriculture, and industry derives dominantly from rivers, lakes, and groundwater, with the latter reservoir accounting for approximately 30 percent of freshwater on the earth’s surface by % of potable (i.e., safe drinking) water. In the US, 86% of households derive water from public suppliers, and 14% supply their own water from wells. Nevertheless, households utilize only one percent of water extracted, the remaining 99% of water is supplied to industry (4%), agriculture (37% compared to 69% worldwide), and thermoelectric power plants (41%). Water use in most areas of the US has increased substantially over the last century.
Check Your Understanding
Lab 8: Stream Flow
Download this lab as a Word document: Lab 8: Stream Flow (Please download required files below.)
In this lab, we will observe the impact of precipitation on stream flow and flooding. The practice and graded sequence of steps are identical. Please go through the following sequence of questions for the practice, check your answers in the Practice Lab, then take the Graded Lab when ready.
Practice Questions
The US Geological Survey maintains the water watch website, which shows the current state of stream flow, drought, flood, and past flow and runoff. We will focus on stream flow data, and you will be required to summarize national trends. The data are expressed as percentiles over normal stream flow for the date of interest. The site has an animation builder that allows you to observe changes in stream flow over short periods and intervals back to 1999. The animations show both regular stream flow and flood stage locations.
Observe the flood and stream flow animations for the following intervals, and describe what you see in terms of major floods and general stream flow. (You can toggle back and forth between these two kinds of animations using the Map Type menu on the animation panel; Real-Time is general stream flow, while the Flood maps show black triangles for places where the streams are actually flooding above their banks.)
Using the USGS animation builder, answer the following practice questions:
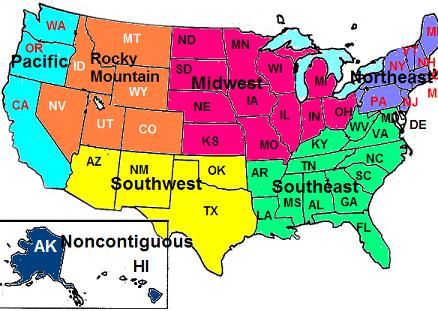
- Between 1st July and 31st August 2010 — which region of the US experienced the most flooding? Use the map below of regions in the US to help you answer this question. Note, this is the first part of a two-part question.
- When do the major floods occur, between 1st July and 31st August 2010? Note, this is the second part of a two-part question.
- How does the July and August 2010 flooding relate to precipitation anomalies? To figure this out, go to the Federal Ministry of Transport, Building and Urban Affairs website and set up the visualization parameters according to this screenshot:
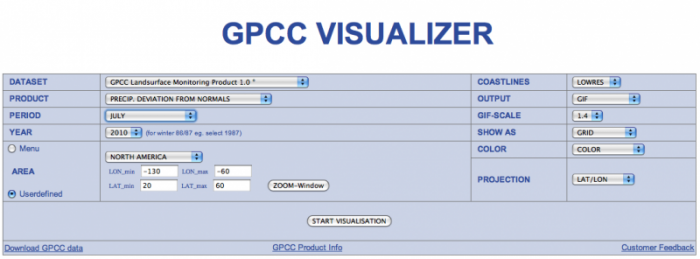 GPCC VisualizerCredit: U. Schneider, P. Finger, E. Rustemeier, M. Ziese, S. Hänsel. “GPCC Visualizer tool”. Global Precipitation Climatology Center, DWD, Deutscher Wetterdienst, Offenbach a. M., Germany, May 2022 .
This will show you precipitation anomalies relative to the monthly mean for the 1950-2000 period, in millimeters per month. Then review the months of June, July, and August, comparing these images with the flood occurrences. During June, July and August 2010, the increase in flooding coincided with ________________? - In what region do major floods happen in August 2011? (Refer to the map in Question 1 to see which states are in which regions.)
- How does the timing and location of August 2011 flooding relate to hurricane activity in the Atlantic? (Hint: Do a Google search for 2011 Atlantic hurricane season). The peak flooding in August 2011 coincides with the landfall of which hurricane?
- Where are the major floods in early December 2010?
- Are the December 2010 floods in the eastern portion of the country more likely related to a prolonged period of high precipitation, a hurricane, or a brief, strong storm system moving through the area?
- What is the relationship between the December 2010 floods in the western part of the country to ENSO? December 2010 was during a La Niña event. Go to the National Weather Service Climate Prediction Center to see what the typical pattern of precipitation is for the US during a La Niña event.
If you run your cursor along the column of letters on the left side, you can see the maps of precipitation anomalies for 3-month periods, so you could look at the maps for NDJ (November, December, January) and see what the typical precipitation anomaly is. For more explanation of these maps, click on the link in the upper right of the window that says "Information on Data, Methods, and Interpretation."
December 2010 was a La Niña year. During a La Niña year, the southern US experiences _______precipitation and the northern US experiences ______precipitation.
In the second part of the lab, in Google Earth, we will observe discharge (in cubic feet per second) for various points along the Mississippi during the devastating floods of 2011. Stream gages are planted in the middle of the river, and the gage measures the volume of water passing through a known volume during a known time. The units are in cubic feet per second.
River Height and Discharge
Please load the Google Earth Mississippi River Stream Gages Updated kmz file. Make sure you look at the dates correctly as well as the discharge axis scale. Please answer the following questions: - Roughly when is peak discharge at Winona, Minnesota (give your answer in month date format. e.g., November 05 for November 5th).
- Roughly when is peak discharge at St. Louis, Missouri (give your answer in month date format. e.g., November 05 for November 5th).
- What is the peak discharge (in cubic feet per second) at Winona? (to nearest 50,000 cubic feet per second). Just give a number.
- What is the peak discharge (in cubic feet per second) at St Louis (to nearest 50,000 cubic feet per second)? Just give a number.
- Generally, is stream flow increasing up or down river?
- Why does discharge increase so abruptly at St. Louis? (Hint: Look at the Google Earth Map in the St. Louis area very closely.)
A. Because of runoff from the city
B. Because the Missouri River flows in at that point
C. Because the river triples in width
D. Because the river deepens significantly
Stop- Are you ready to submit your lab?
Are you sure you are ready to take the graded lab for credit? Stop and think before clicking again.

If you have completed your worksheet and Practice Lab, click next to enter and submit your responses.
If you have not not completed your worksheet and Practice Lab, please do that first and come back in.