Course Types

Developing an online course starts with a vision we develop together. A vision for what students will remember five years after they’ve taken your course. A vision of the kinds of experiences you want to provide. A vision to engage and inspire.
This portfolio course showcases examples of our work. Whether you’re looking to develop a lab course in an online format (we can do that) or an online seminar course for graduate students (we have you covered), or even a course incorporating a real-world project with a real-world partner (yep, been there), we’re on it!
Here you'll find sample lessons representative of various course formats.
Image credits: © Urupong, © Jacob Lund, Pixel-Shot, Gorodenkoff, Scanrail, Li Ding / stock.adobe.com
Text-First (Basic) Course

What is a Text-First course?
A text-first course functions basically as an online textbook. It contains many images, some video, and interactive elements for students. This format is common in our library of courses and serves many students each semester.
What are the affordances of this model?
Text-First courses provide students with well-designed content that encourages engagement and interaction. Images and videos help to illustrate the content and are chosen or developed with students in mind. Interactive activities help students engage with and practice course concepts, learning and committing new ideas to long-term memory.
Things to pay attention to:
On the following pages, note the structured layout of the material, providing students with clear learning objectives and instructions for working on this lesson. Assignments and Assessments are aligned with the lesson objectives.
We look forward to working with you!
Contact us directly or visit the Dutton Website to learn more!
Introduction to GEOG 30N
Welcome to GEOG 30N, Environment and Society in a Changing World!
GEOG 30N introduces the theory, methods, history, and contemporary issues in global and regional relationships between human activities and the physical environment.
This course examines sustainability and human-environment interactions from a geographic perspective. Students examine both the influence of humanity on the environment and the influence of the environment on humanity, with attention to the sustainability of current human activities. They take a complex systems perspective on major environmental and societal challenges and examine linked human-environment issues in a variety of contexts. Each module contains readings, links, and explanations of the basic principles related to sustainability and human-environment systems.
Introduction
About Module 1
Here you will be introduced to fundamental geographic topics including scale, cartography and GIS and human-environment interactions. These topics are introduced using case studies and specific examples. The central objective of this lesson is for you to understand key concepts in geography and how they apply to this course. You will also be introduced to some key concepts that will be returned to throughout the course.
What will we learn in Module 1?
By the end of Module 1, you should be able to:
- examine several major themes of geography, particularly scale, cartography and GIS, and human-environment interactions;
- consider how the links between spatial and temporal scales help explain decision-making and environmental change;
- understand why social science is important to the study of the natural environment;
- be introduced to topics that will be discussed in greater detail later in the course.
What is due for Module 1?
Module 1 will take us one week to complete. See the Calendar in Canvas for specific due dates. There are no assignments due in Canvas this week. But be sure you read the required reading, as you will need to engage concepts from this module in the first written assignment due in a few weeks!
| Requirement | Location | Submitting Your Work |
|---|---|---|
| Reading Assignment: State Department Office of the Geographer | Introduction | No submission |
Questions?
If you have any questions, please post them to our Course Q & A discussion forum in Canvas. I will check that discussion forum often to respond. While you are there, feel free to post your own responses if you, too, are able to help out a classmate. If you have a more specific concern, please send me a message through Inbox in Canvas.
Introduction to Geography
You are now in the process of doing something that few other Americans have done: taking a college-level geography course. In contrast with other countries such as the United Kingdom, France, and India, most American colleges and universities do not even have a geography department. Because of this, you might not be familiar with geography as an advanced discipline of study and professional activity. This module is designed to introduce you to the field of geography as it is practiced at Penn State and beyond.
The Greeks were the first to use the term geography, which literally translates as “to describe the Earth.”
The geographer's task is nothing less than to understand and explain the entire world as we live in it. The geographer focuses on what's happening on Earth’s surface. If it’s below the surface, it’s more likely to be studied in the Geosciences Department. If it’s above the surface, it’s more likely to be studied in the Meteorology Department. But there is a lot of overlap among these three fields of study, which is why they are grouped together in Penn State’s College of Earth and Mineral Sciences, along with the Energy and Mineral Engineering Department and the Materials Science and Engineering Department.
The Penn State Geography Department (and many others) divides geography into four sub-disciplines:
- Human Geography: how human societies are arranged and interact around the world, including economies, governments, and cultures;
- Physical Geography: how natural and geophysical phenomena are arranged and interact around the world, including ecosystems, mountain ranges, bodies of water, and climates;
- Environment & Society Geography: interactions between humans and the natural and geophysical world, including human impacts on the environment and environmental impacts on humanity;
- Geographic Information Sciences: techniques for acquiring, analyzing and displaying geographic information, including satellites, software programs, and maps.
Geography 30 is Penn State's introductory course for environment & society geography. It is offered to students at both the University Park campus and the World Campus.
At University Park, Geography 30N is a core course for the undergraduate programs in Geography. Introductory courses for the other subdisciplines are Geog 010 (physical), 020 (human), and 160 (GISciences). Geog 040 is World Regional Geography, which presents both the human and physical geography of every region of the world.
At World Campus, Geography 30N is a major requirement for both the Bachelor of Arts and Bachelor of Science degrees in Energy and Sustainability Policy. For both University Park and World Campus, Penn State also offers many activities and resources on sustainability through the Center for Sustainability and the Institutes of Energy and the Environment.
This broad focus makes geography a challenging and exciting discipline. Geography intersects with many other disciplines across the natural and social sciences, engineering, and the humanities. For example, biogeography intersects with biology; political geography intersects with political science.
One hallmark of geography is place-based inquiry. Geographers recognize that natural and social conditions are often unique to a specific region. In order to better understand a place's unique or unusual characteristics, geographers often perform field research, meaning that they go to a place and observe the natural and social conditions in that place. The place need not be remote. You can conduct field research simply by observing the place that you live in.
Geography today is a vibrant academic and professional discipline.
Geographers today work in a wide range of settings, including research, government, technology companies, and non-profits. Some specific examples can be found on the Geography Department's What Geographers Do page. Please scan this page to get a sense of the breadth of options available to geographers.
Reading Assignment: "MapQuest: Office of the Geographer Makes Information Visual"
The United States Department of State is responsible for managing international relations. It contains an Office of the Geographer that provides a range of geographic services in support of the State Department's international relations mission. To learn more about what the Office of the Geographer does, please read the article "MapQuest: Office of the Geographer Makes Information Visual." The article is on pages 30-33 of the March 2009 State Magazine.
As you read this, consider the following questions. What does the Office of the Geographer do? What types of geography does it use? What skill sets must its employees have? What international relations issues and incidents has it been involved in? Why is geography important to international relations?
Scale
One of the central concepts in geography is scale. In very rough terms, scale refers to how big or small something is. That "something" could be an event, a process, or some other phenomenon. In geography, we often focus on spatial scale. Spatial scale is the extent of an area at which a phenomenon or a process occurs. For example, water pollution can occur at a small scale, such as a small creek, or at a large scale, such as the Chesapeake Bay. Spatial scale also refers to the area or spatial extent at which data about a phenomenon are aggregated to be analyzed and understood. For example, while there are differences in levels of pollution in different areas of the Chesapeake Bay, one may choose to aggregate water quality measurements to make a general statement about pollution in the bay as a whole.
Geographers not only are interested in the patterns of physical or social processes on the Earth at a given level of spatial organization (e.g., local, regional, or global), but they also want to know the interactions and feedbacks across different spatial scales. Geographers sometimes also discuss temporal scale, which is the duration or time length of a thing or process. Some examples can help us understand scale. Consider air pollution. This often exists at the scale of a city or metropolitan area. The city will have cars, factories, power plants, and other things that cause air pollution, and the air pollution will affect people who live in the city and breathe the air there. People elsewhere may not be significantly affected. (Note that sometimes the wind sends air pollution further away.) In contrast, climate change largely exists at the global scale. (We'll discuss climate change in greater detail later in the course.) This is because climate is a process that covers the whole planet. When we change the climate somewhere, we change it everywhere. Scale matters in understanding the interactions between humans and the environment.
A nice depiction of scale can be found in the following video (9:01):
PRESENTER: The picnic near the Lakeside in Chicago is the start of a lazy afternoon, early one October. We begin with a scene one meter wide, which we view from just one meter away. Now every 10 seconds, we will look from 10 times farther away, and our field of view will be 10 times wider. This square is 10 meters wide. And in 10 seconds, the next square will be 10 times as wide. Our picture will center on the picnickers, even after they've been lost to sight.
100 meters wide, a distance a man can run in 10 seconds. Cars crowd the highway. Powerboats lie at their docks. The colorful bleachers are Soldier Field. This square is a kilometer wide, 1,000 meters. The distance a racing car can travel in 10 seconds. We see the great city on the lake shore. 10 to the fourth meters, 10 kilometers, the distance a supersonic airplane can travel in 10 seconds.
We see first the rounded end of Lake Michigan, then the whole great lake. 10 to the fifth meters, the distance an orbiting satellite covers in 10 seconds. Long parades of clouds. The day's weather in the Middle West. 10 to the sixth, a one with six zeros. A million meters.
Soon the Earth will show as a solid sphere. We are able to see the whole Earth now, just over a minute along the journey. Earth diminishes into the distance, but those background stars are so much farther away. They do not yet appear to move.
A line extends at the true speed of light, in one second it half crosses the tilted orbit of the moon. Now we mark a small part of the path in which the Earth moves about the sun. Now the orbital paths of the neighbor planets, Venus and Mars, then Mercury. Entering our field of view is the glowing center of our solar system, the sun.
Followed by the massive outer planets, swinging wide and their big orbits. That odd orbit belongs to Pluto. A fringe of a myriad comets too faint to see completes the solar system. 10 to the 14th. As the solar system shrinks to one bright point in the distance, our sun is plainly now only one among the stars.
Looking back from here, we know four Southern constellations still much as they appear from the far side of the Earth. This square is 10 to 16th meters, one light year. Not yet out to the next star. Our last 10 second step took us 10 light years further. The next will be 100. Our perspective changes so much in each step now, that even the background stars will appear to converge.
At last we pass the bright star Arcturus, and some stars of the Dipper. Normal but quite unfamiliar stars and clouds of gas surround us as we traverse the Milky Way galaxy. Giant steps carry us into the outskirts of the galaxy. And as we pull away, we begin to see the great flat spiral facing us. That time and path we chose to leave Chicago has brought us out of the galaxy along a course nearly perpendicular to its disk.
The two little satellite galaxies of our own are the clouds of Magellan. 10 to the 22nd power, a million light years. Groups of galaxies bring a new level of structure to the scene. Glowing points are no longer single stars, but whole galaxies of stars seen as one. We passed the big Virgo cluster of galaxies among many others, 100 million light years out. As we approach the limit of our vision, we pause to start back home.
This lonely scene, the galaxies like dust, is what most of space looks like. This emptiness is normal. The richness of our own neighborhood is the exception. The trip back to the picnic on the lakefront will be a sped up version, reducing the distance to the Earth's surface by one power of 10, every two seconds. In each two seconds, we'll appear to cover 90% of the remaining distance back to Earth.
Notice the alternation between great activity and relative inactivity, a rhythm that will continue all the way into our next goal, a proton in the nucleus of a carbon atom beneath the skin on the hand of a sleeping man at the picnic. 10 to the ninth meters, 10 to the eighth. Seven, six, five, four, three, two, one. We are back at our starting point. We slow up at 1 meter, 10 to the zero power.
Now we reduce the distance to our final destination by 90% every 10 seconds. Each step much smaller than the one before. At 10 to the minus 2, one one-hundredth of a meter, one centimeter, we approach the surface of the hand. In a few seconds we'll be entering the skin, crossing layer after layer from the outermost dead cells into a tiny blood vessel within. Skin layers vanish and turn, an outer layer of cells, felty collagen.
The capillary containing red blood cells in a roughly lymphocyte. We enter the white cell, among its vital organelles, the porous wall of the cell nucleus appears. The nucleus within holds the heredity of the man in the coiled coils of DNA. As we close in, we come to the double helix itself, a molecule like a long twisted ladder, whose rungs of paired bases spell out twice in an alphabet of four letters, words of a powerful genetic message.
At the atomic scale, the interplay of form and motion becomes more visible. We focus on one commonplace group of three hydrogen atoms bonded by electrical forces to a carbon atom. Four electrons make up the outer shell of the carbon itself. They appear in quantum motion as a swarm of shimmering points. At 10 to the minus 10 meters, one angstrom, we find ourselves right among those outer electrons. Now we come upon the two inner electrons held in a tighter swarm.
As we draw toward the atom's attracting center, we enter upon a vast inner space. At last, the carbon nucleus, so massive and so small, this carbon nucleus is made up of six protons and six neutrons. We are in a domain of universal modules. There are protons and neutrons in every nucleus. Electrons in every atom. Atoms bonded into every molecule out to the farthest galaxy.
As a single proton fills our scene, we reach the edge of present understanding. Are these some quarks at intense interaction? Our journey has taken us through 40 powers of 10. If now the field is one unit, then when we saw many clusters of galaxies together, it was 10 to the 40th, or one and 40 zeros.
The video shows the same point in space on a broad range of scales, from the subatomic to the astronomical. In geography, we tend to focus on human scales, which are the scales of the world as we experience it. So, you will not need to know any particle physics or astronomy for Geog 30N, even though some of it may be relevant!
It is important to appreciate that phenomena can be considered or observed at multiple scales. For example, we can observe climate change at the global scale, since climate is a global process. However, we can also observe climate change at local scales. Climate change is caused by, among other things, many individual decisions to burn fossil fuels. Also, climate change impacts people and ecosystems in specific local places across the world. The causes and impacts are different in different places. If we only observed climate change at the global scale, we would miss this variation from one location to another. It's important to observe climate change - and many other important phenomena - at many scales so that we can fully understand what's going on.
Another example important to Geog 30N is deforestation. As with climate change, it helps to consider deforestation on many scales. An individual living in the Brazilian Amazon might decide to cut down a tree to collect firewood, to sell the wood, or to clear land for farming. If we think of deforestation just at this local scale, then we might understand it as a local event. However, the decision to cut down the tree can be connected to other political, economic, cultural, and environmental processes that operate at national, regional and international scales. For example, the decision to cut the tree is shaped in part by external economic markets: whether the tree could be sold for money, or whether the person could make money from engaging in other activities that require clearing patches of forest, such as raising cattle for beef. Trade agreements between Brazil and other countries shape the systems of economic exchange, and international demand for hardwoods such as mahogany (in the United States and Europe in particular) create incentives to deforest tropical rainforests. Therefore, the simple act of cutting down a tree in Brazil needs to be seen as connected to other economic and political processes that intersect and move across multiple scales.
The deforestation example highlights the important concept of globalization. Globalization is a hotly debated concept, but it is generally understood as the increasing integration of societies around the world through improvements in transportation and communication technologies. The integration can be economic, political, or cultural. Here are some examples:
* Economic Integration: Global freight shipping permits Brazilian trees to be sold to European consumers.
* Political integration: American environmental policies may limit the types or quantities of trees that can be imported from Brazil.
* Cultural integration: Globalized tastes for food can lead people from around the world to desire food products that can be grown in Brazil.
Globalization has impacted societies around the world as the sharing of products has contributed to the perception that cultures are losing their individuality.
One way to approach understanding relationships across scales is through commodity chains. A commodity chain contains the links between the collection of resources to their transformation into goods or commodities and, finally, to their distribution to consumers. Commodity chains can be unique depending on the product types or the types of markets (agriculture versus textiles for example). Different stages of a commodity chain can also involve different economic sectors or be handled by the same business. Figure 1.1 visualizes a simplified commodity chain for the seafood industry.
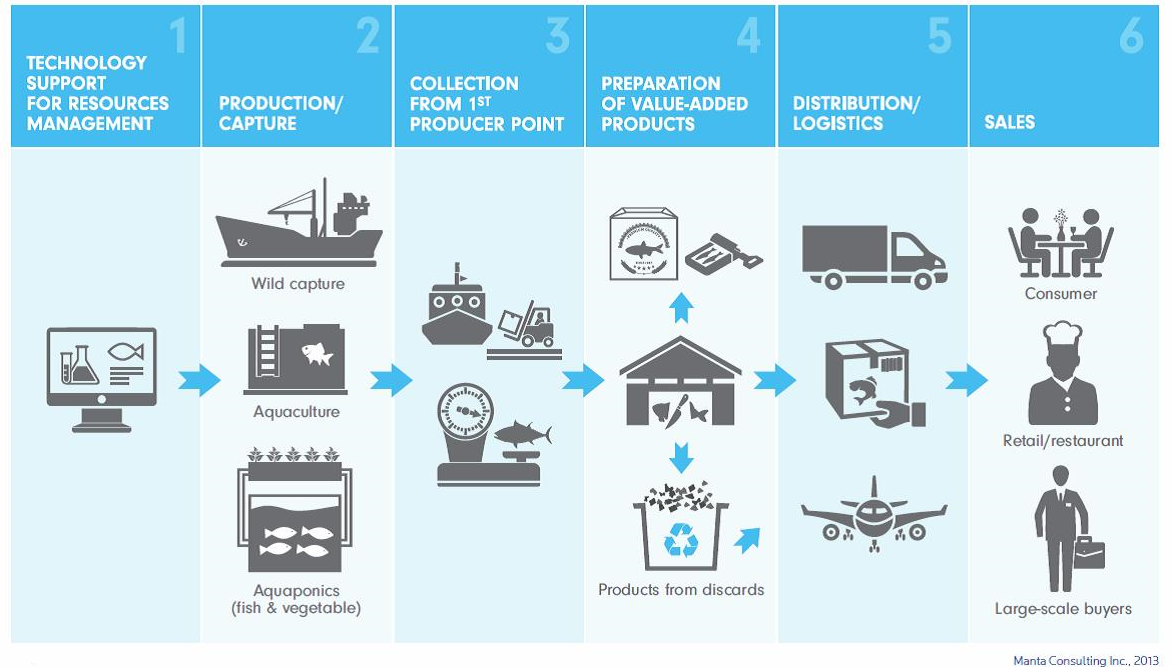
Click here to see a text version of Figure 1.1
Flowchart of the seafood supply chain:
1. Technology support for resources management leads to
2. Production/Capture: wild capture, aquaculture, aquaponics (fish & vegetable) leads to
3. Collection from 1st producer point leads to
4. Preparation of value-added product (ex. Butchering, packaging and waste) leads to
5. Distribution/Logistics (ex. Truck, plane etc) leads to
6. Sales: consumer, retail/restaurant/large-scale buyers.
Understanding the path that fish took on its way to our plates as it moves across the commodity chain allows us to think about the interconnections between capture/production (wild fisheries vs. aquaculture), generation (converting whole fish to other product forms such as fish fillets or canned fish), distribution and sales (transferring products to locations for consumption and selling products to consumers).
Consider This:
When you buy seafood, do you ask yourself, "Where does my seafood come from and how does it get to me?" Look at Figure 1.1 and try to place yourself on this supply chain. Where do you exist in terms of the production and consumption of seafood?
As we'll discuss in later modules, the global rise in seafood demand has caused the depletion of fish stocks. Unsustainable overfishing has emerged as a global issue and has its severe and irreversible impacts on human lives and marine biodiversity. As with fishermen catching more fish than the population can replace through natural reproduction, we need to think about our individual decisions and local patterns that contribute to sustainable practice. Our decisions and food choice are also linked to political and economic processes at multiple scales, but we need to think about the types of impacts our individual decisions have for the natural world.
Visualization
Visualization
Geography is regularly identified as the discipline that makes maps. While geography is, of course, much more than this, geographers do create maps to show how processes play out across space at various scales. Why maps? It's because maps are very effective at helping us see what's happening within some region. When spatial patterns are important - and they very often are - then looking at maps can be much more efficient and effective than looking at paragraphs of text or tables of data.
For example, suppose we want to learn the presidential election results by county in a given year, The animated map below shows the information. By displaying the information geographically, the map helps us learn what we want to know. In particular, the map makes it easier to identify the patterns in the data across space and over time. Throughout Geog 30N, we will view and even create maps to visualize spatial information.
See the raw data.
Cartographic Projection
The world is round, but maps are flat. A projection is a scheme for converting points on the round world to points on a flat map. There are many different types of projections, each with advantages and disadvantages. Some projections make it easy to see what is north, south, east, and west. Some projections make it easy to see how large a given land mass is. Some projections make it easy to navigate ships on the ocean. (Cartography has a long history of association with navigation.) Finally, some projections can even be used to advance political agendas, as this excerpt from the TV show The West Wing shows (four minute video):
[CJ]: hi, I'm sorry
[Dr. John Fallow]: oh?
[CJ]: sorry to be late
[Dr. John Fallow]: Not a problem
[CJ]: I'm CJ Cregg
[Dr. John Fallow]: of course you are I’m Dr. John Fallow with Dr. Cynthia Sales and Professor Donald Hyuk
[CJ]: Hyuk?
[Dr. John Fallow]: Hyuk
[CJ]: okay and you are the organization of cartographers for social equality
[Dr. John Fallow]: well we're from the OCSE we have many members.
[CJ] how many?
[Dr. John Fallow] 4,300 dues-paying members
[CJ]: what are the dues?
[Dr. John Fallow]: Now $20 a year for the newsletter
[CJ]: let's start
[Josh Lyman]: wait I want to see
[CJ]: this is Josh Lyman
[Dr. John Fallow]: Indeed you are
[CJ]: Josh this is Dr. Fallow and his Merry Men
[Dr. John Fallow]: yes
[CJ]: should we begin
[Dr. John Fallow]: yes. Plain and simple uh we'd like President Bartlet to aggressively support legislation that would make it mandatory for every public school in America to teach geography using the Peters projection map instead of the traditional Mercator
[Josh Lyman]: give me 200bucks and it's done
[Professor Donald Hyuk]: really?
[CJ]: No why are we changing maps
[Dr. Cynthia Sales]: because CJ the Mercator projection has fostered European imperialist attitudes for centuries and created an ethnic bias against a third world
[CJ]: really?
[Dr. John Fallow]: the German cartographer Mercator originally designed this map in 1569 as a navigational tool for European sailors. The map enlarges areas at the poles to create straight lines of constant bearing or geographic direction
[Dr. Cynthia Sales]: so it makes it easier to cross an ocean
[Dr. John Fallow]: but
[CJ]: yes
[Dr. John Fallow]: it distorts the relative size of nations and continents
[CJ]: are you saying the map is wrong
[Dr. John Fallow]: oh dear yes now look at Greenland
[CJ]: okay
[Dr. John Fallow]: now look at Africa
[CJ]: okay
[Dr. John Fallow]: the two land masses appear to be roughly the same size
[CJ]: yes
[Dr. John Fallow]: would it blow your mind I told you that Africa is in reality 14 times larger
[CJ]: yes
[Dr. Cynthia Sales]: here we have Europe drawn considerably larger than South America when it's six point nine million square miles South America is almost double the size of Europe's 3.8 million
[Professor Donald Hyuk]: Alaska appears three times as large as Mexico when Mexico is larger by 0.1 million square miles
[Dr. Cynthia Sales]: Germany appears in the middle of the map when it's in the northernmost quarter of the earth
[Josh Lyman]: Oh wait relative size is one thing but you're telling me that Germany isn't where we think it is
[Dr. John Fallow]: nothing's where you think it is
[CJ]: where is it?
[Dr. John Fallow]: I'm glad you asked. The Peters projection
[Dr. Cynthia Sales]: it has fidelity of axis
[Professor Donald Hyuk]: fidelity of position
[Dr. Cynthia Sales]: east-west lines are parallel and intersect north-south axes at right angles
[CJ]: what hell is that?
[Dr. John Fallow]: it's where you've been living this whole time should we continue?
[CJ]: uh-huh
[Dr. John Fallow]: so you're probably wondering what all of this has to do with social equality
[CJ]: no I'm wondering where France really is
[Josh Lyman]: guys we want to thank you very much for coming in
[CJ]: hang on we're gonna finish this
[Dr. John Fallow]: okay what do maps have to do with social equality you asked?
[Josh Lyman]: she asked
[Professor Donald Hyuk]: Salvatore Anatoly of the National Council for social studies argues in our society we unconsciously equate size with importance and even power
[Josh Lyman]: I'm going to check in on Tommy if these guys find Brigadoon on that map you'll call me right
[CJ]: probably not
[Josh Lyman]: okay
[Dr. John Fallow]: when third world countries are misrepresented they're likely to be valued less when Mercator maps exaggerate the importance of Western civilization when the top of the map is given him northern hemisphere and the bottom is given to the southern then people will tend to adopt top and bottom attitudes
[CJ]: but wait where else could you put the northern hemisphere but on the top
[Dr. Cynthia Sales]: on the bottom
[CJ]: how
[Dr. John Fallow]: like this
[CJ]: yeah but you can't do that
[Dr. John Fallow]: why not?
[CJ]: cuz it's freaking me out
Which of the projections shown in the video do you think should be used? Why? Note that the video claims that a certain projection is wrong. Technically, all projections are in some ways wrong, in the sense that they do not accurately portray the world. The only way to achieve accuracy is to use a spherical object - a globe. A projection should be chosen to fit the purpose of the map, so the best projection to use will depend on the circumstances of the map.
Some maps don't even try to have an accurate projection. They distort distances in ways that are geographically inaccurate but useful for other purposes. A classic example of this is the map of the London subway system, which is known as the London Underground or the Tube and operated by a government agency called Transport for London. Here is a portion of the standard system map:
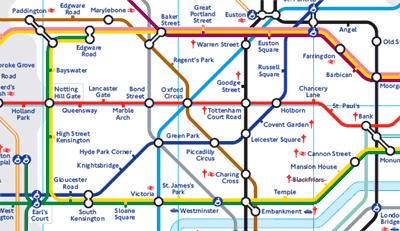
The full map can be found on the Transport for London website. This map is beautifully designed and user-friendly. The mix of colors and layout of the different subway lines on the map make it easy to interpret. However, the map is very geographically inaccurate, meaning the relative distances between the different stops are not shown. In fact, the center of the map (which is downtown London) shows the stops at some distance from each other when in reality they are very close to each other. Alternatively, the stops further out from the city (in the corners of the maps) are some distance away from each other. This makes it impossible to know how long a particular trip will be from the map. So while the map aids in the comprehension of the different lines and stops, it sacrifices accuracy in terms of distances. Maps, therefore, are imperfect documents that can distort or omit information, and, in some cases, bias our understandings of spatial patterns and processes.
Here is a geographically accurate Tube map, produced independently of Transport for London:
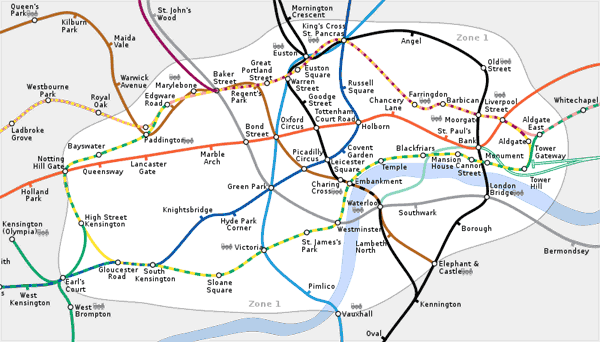
If you were riding the Tube, which map would you rather have?
Human-Environment Interactions
One of the central contributions of the geographic discipline is its examination of the interactions between social and ecological systems. Thinking about these interactions requires addressing several key questions.
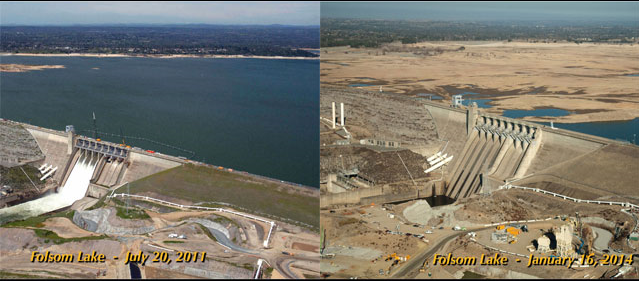
The first question is how does the natural environment shape, control, and constrain human systems? One way this is understood is in terms of natural hazards, which are natural events that disrupt human activity. For example, the ongoing and persistent drought in California (2012-Present, Figure 1.5) has resulted in devastating effects on ecosystems and human society. The threat of wildfire is greatly increased by the continued dryness and wildlife and people are suffering from severe water shortage. The dry conditions also have taken a heavy toll on agriculture, tourism, and recreational industries.
The second key question about human-environment interactions is how human decision-making and processes shape and change the natural environment, including ecosystems, river systems, vegetation, and climate. Humans have caused such significant environmental change that Nobel Prize-winning scientist Paul Crutzen suggested in 2000 that we have entered a new era known as the Anthropocene.
There is great concern about whether social and ecological systems can coexist in a sustainable manner. This has helped advance the concept of sustainability, which seeks to understand how human activities can exist without disrupting the ability of natural ecosystems to function. The sustainability concept will appear in various modules for this course, including coupled human-environmental systems, ethics and democracy, development, and individual responsibility. You will work through how sustainability is understood and the different ways that it is addressed.
An important consideration to sustainability is the concept of governance. Studies of governance consider how people make decisions and how they are constrained by external forces and structures to limit their range of options. An understanding of human-environment interactions attends to environmental governance in the ways that the ability of people to make decisions regarding the natural environment is shaped in part by external factors. As an example of this, the farmer in Brazil that we already discussed participates in governance decision-making with other stakeholders (the Brazilian government, other community members, etc.), state policies, and markets. The decisions that result in terms of transforming the natural environment are influenced by the governance mechanisms that shape the range of options available to particular actors. Environmental governance, which is in essence how natural resources are interpreted and managed by different stakeholders, connects to questions of sustainability. For example, one way of governing natural resources is through common property systems whereby individual actors are allowed access but with certain restrictions. Another example is exclusionary protected areas that restrict the movement of human populations and extraction of natural resources. These are two types of environmental governance strategies that have different impacts on social and ecological systems.
Finally, many of these discussions include concerns for ethics, as they involve how we prioritize human needs at the expense of non-human needs, how some human populations benefit from industrial development more than others, and what are the ecological costs of human-driven environmental change. The next course module, Coupled Human-Environment Systems, addresses these questions in more detail.
Social Science Perspectives
Geog 30N is, among other things, a social science course about the natural environment. At first glance, this might seem a bit odd. If the environment is a natural phenomenon, shouldn’t the study of it be more of a natural science?
Natural science is unquestionably important to understanding the natural environment. But, as we hope becomes clear in this course, social science is very important too. Here are some reasons why.
Human impacts on the environment. Human society has very large impacts on the natural environment. We are changing the makeup of Earth’s surface and atmosphere, depleting a variety of natural resources, changing the global climate, and even causing many other species to go extinct. These impacts are unprecedented in the entire course of Earth’s history. Natural science can help us understand the nature of these environmental impacts, but social science is needed to understand why and how human society is causing them.
Environmental impacts on humanity. Just as human society impacts the environment, so, too, does the environment impact humanity. Indeed, the environment has played a large role in the contours of human society throughout its entire history. Today, as the environment changes from human activity, these environmental changes are coming back around to impact humanity, often quite profoundly. Understanding how the environment impacts society requires social science.
Environmental policy. Given the importance of the impacts of humanity on the environment and the environment on humanity, society’s policies towards the environment are also important. This includes our policies on how we impact the environment and policies on how we respond to environmental conditions and changes in these conditions. The word “policy” here should be interpreted broadly to include the policies of governments but also the policies of businesses, schools, non-profit organizations, and even households and individual people. Understanding the environmental policies found throughout these portions of human society requires social science.
Geog 30N covers all of these ways social science is important to the environment. In the process, we’ll learn some core social science perspectives, many of which also appear in social science disciplines outside geography, such as economics, history, political science, and psychology. One advantage of studying the environment in a geography course is that geography is a diverse discipline that is very comfortable with including ideas from other disciplines. Indeed, some of the content for this course comes from natural science, the humanities (in particular ethics), and the design-oriented disciplines such as architecture, business, engineering, and policy. Different academic disciplines bring different perspectives, but, ultimately, the disciplines are all studying the same world. Our goal is to understand the world and society’s place within it. We will use whatever perspectives can help us achieve this.
Summary
Seminar Course

What is a seminar course?
A seminar course is usually a relatively small-enrolling, discussion-based course. Students are required to read and complete assignments before coming together to discuss topics and themes.
What are the affordances of this model?
Seminar courses can engage students to think deeply, to discuss comprehensively, and to synthesize their learning while completing a semester project. This format is wonderful for fostering higher-order thinking and for encouraging student leadership and inclusivity.
Things to pay attention to:
Seminar courses generally do not rely on instructor-generated "lectures." They require that students have a clear understanding of the course structure and that they come ready to think critically and discuss in depth. Seminar courses give students opportunities to come together to discuss their findings, thereby collectively working to expand their understanding of the field of study. The social aspects of collaborative discussions help students learn from one another and help the learning community think about the limits and opportunities within the field.
We look forward to working with you!
Contact us directly or visit the Dutton Website to learn more!
Introduction to GEOG 580
Welcome to GEOG 580: Geovisual Analytics!
This course was developed to provide students with opportunities to explore real-world problems with geovisual analytics.
The seminar structure was chosen to give students experience investigating and discussing many topics, and hands-on lab work is included to provide experience using and critiquing various geovisual analytics platforms.
Students read and discuss weekly, complete four lab exercises, and delve into two major projects: a literature review and a final project that includes intermediary checkpoints. The literature review gives students practice reviewing and analyzing a large body of knowledge, and students enjoy the fact that they can choose their own topics so that they can dive into final projects that allow them to apply what they've learned in the labs. Finally, at the end of the course, students enjoy sharing and exchanging ideas surrounding the set of projects completed by their classmates.
Lesson 2 Overview
Overview first, zoom and filter, then details-on-demand.
-a Visual Information Seeking Mantra from Ben Shneiderman (2003)
Welcome to Lesson 2!
In the second lesson, we will continue our tour of the geovisual analytics research landscape. However, we will shift our focus from developing a broad understanding of what GVA is and why it emerged as an important discipline to beginning to explore focused and unique use cases for applying GVA concepts and techniques. More specifically, you will engage in a series of readings concentrated on leveraging visual analytics for use cases involving text and time. Paralleling this reading activity, you should be investigating the GVA literature to identify a topic for the literature review assignment. I encourage you to spend the time necessary to pick a topic that is well-defined, relevant to GVA, and hopefully of interest to you. Also for this lesson, you will complete a hands-on exercise that introduces you to ArcGIS Insights, which is another GVA platform created by Esri.
By the end of this lesson, you should be able to:
- generate a literature topic that is unique, narrowly focused, and clearly within the scope of GVA
- provide informed feedback to peers on the relevancy of selected research topics in the context of GVA
- compare and contrast GVA approaches to making sense of text
- show an understanding of the role of time in GVA applications
- demonstrate an understanding of/proficiency with ArcGIS Insights by engaging in a tutorial-based assignment
- evaluate the ArcGIS Insights platform for usability and utility
- based on an analysis of the platform, generate an idea for an improvement to the usability and utility of ArcGIS Insights
To Complete Lesson 2
- Read all Lesson 2 module materials
- Complete the assigned readings
- Participate in the Discussion Forum
- Complete the ArcGIS Lab
- Submit your topic selection to the topic choice spreadsheet
- Participate in the Topic Choice Discussion Board
Lesson 2 Reading Assignment
In this lesson, we will read a series of papers that begin to illustrate the breadth of diversity in (geo)visual analytics applications. R1 presents the novel use of GVA in supporting “close reading” of poetry through interactive, visual exploration of a poem’s sonic topology. R2 is all about time and storytelling, showcasing the complexity of effectively and expressively communicating multiple narrative points visually. Finally, in R3, we will see how GVA can be leveraged to support “distant reading” through enabling the digital humanities community to explore large text archives containing both spatial and temporal information.
For all of these works, consider the level of effort and time it took for the researchers to arrive at an effective design solution for a very specific use case or need. My hope is that these readings, along with looking ahead to future lesson topics/readings (in addition to your own research!), will help guide you in picking a literature review topic that is narrowly focused, GVA-relevant, and personally of interest! Don’t forget to submit your topic idea by the mid-lesson deadline and be prepared to provide a short paragraph summarizing your topic by the end-of-lesson deadline, in addition to commenting on at least two other classmates’ topics.
For this lesson’s discussion forum, respond in two-three paragraphs to one of the following prompts:
- Carefully consider R2 and reflect on how you might also integrate space and/or place into the various timeline design options. Explain what this integration could look like and outline any challenges you foresee in your proposed design option(s).
- Compare and contrast how GVA is used to support “close” (R1) and “distant” (R3) reading. Is there any overlap in the researchers’ approaches to informing these text-based use cases? Were there any methodological components that one study used that could have informed the other study had those researchers applied that approach?
Post your written work to Discussion Forum #2 and be sure to post substantive responses to at least two of your classmates.
- R1: McCurdy, Nina, Julie Lein, Katharine Coles, and Miriah Meyer. Poemage: Visualizing the sonic topology of a poem. IEEE transactions on visualization and computer graphics 22, no. 1 (2015): 439-448. https://doi.org/10.1109/TVCG.2015.2467811
- R2: Brehmer, Matthew, Bongshin Lee, Benjamin Bach, Nathalie Henry Riche, and Tamara Munzner. Timelines revisited: A design space and considerations for expressive storytelling. IEEE transactions on visualization and computer graphics 23, no. 9 (2016): 2151-2164. https://doi.org/10.1109/TVCG.2016.2614803
- R3: Bruggmann, André, and Sara I. Fabrikant. How does GIScience support spatio-temporal information search in the humanities? Spatial Cognition & Computation 16, no. 4 (2016): 255-271. https://doi.org/10.1080/13875868.2016.1157881
This reading is available via the Library Resources link in the Course Navigation Menu (at left).
Lab Assignment: Inights for ArcGIS - Investigating Suspicious Prescription Drug Trends and the Refugee Crisis
In this lab, we will explore the capabilities of the ArcGIS Insights platform for supporting geovisual analytics in the context of analyzing patterns in suspicious prescription drug trends and global refugee movement. We will complete two lessons that Esri has developed to showcase its capabilities, and then you will critique what you have seen.
The goals of this lab are to:
- become familiar with the geovisual analytics capabilities of the ArcGIS Insights platform,
- evaluate the extent to which the platform supports spatial analytical reasoning, and
- gain familiarity with common usability and utility assessment for system design.
Getting Started
To launch Insights for ArcGIS, you need to log in to your ArcGIS account. Once you’re logged in, click the Apps button at the top of the page and select the Insights application:
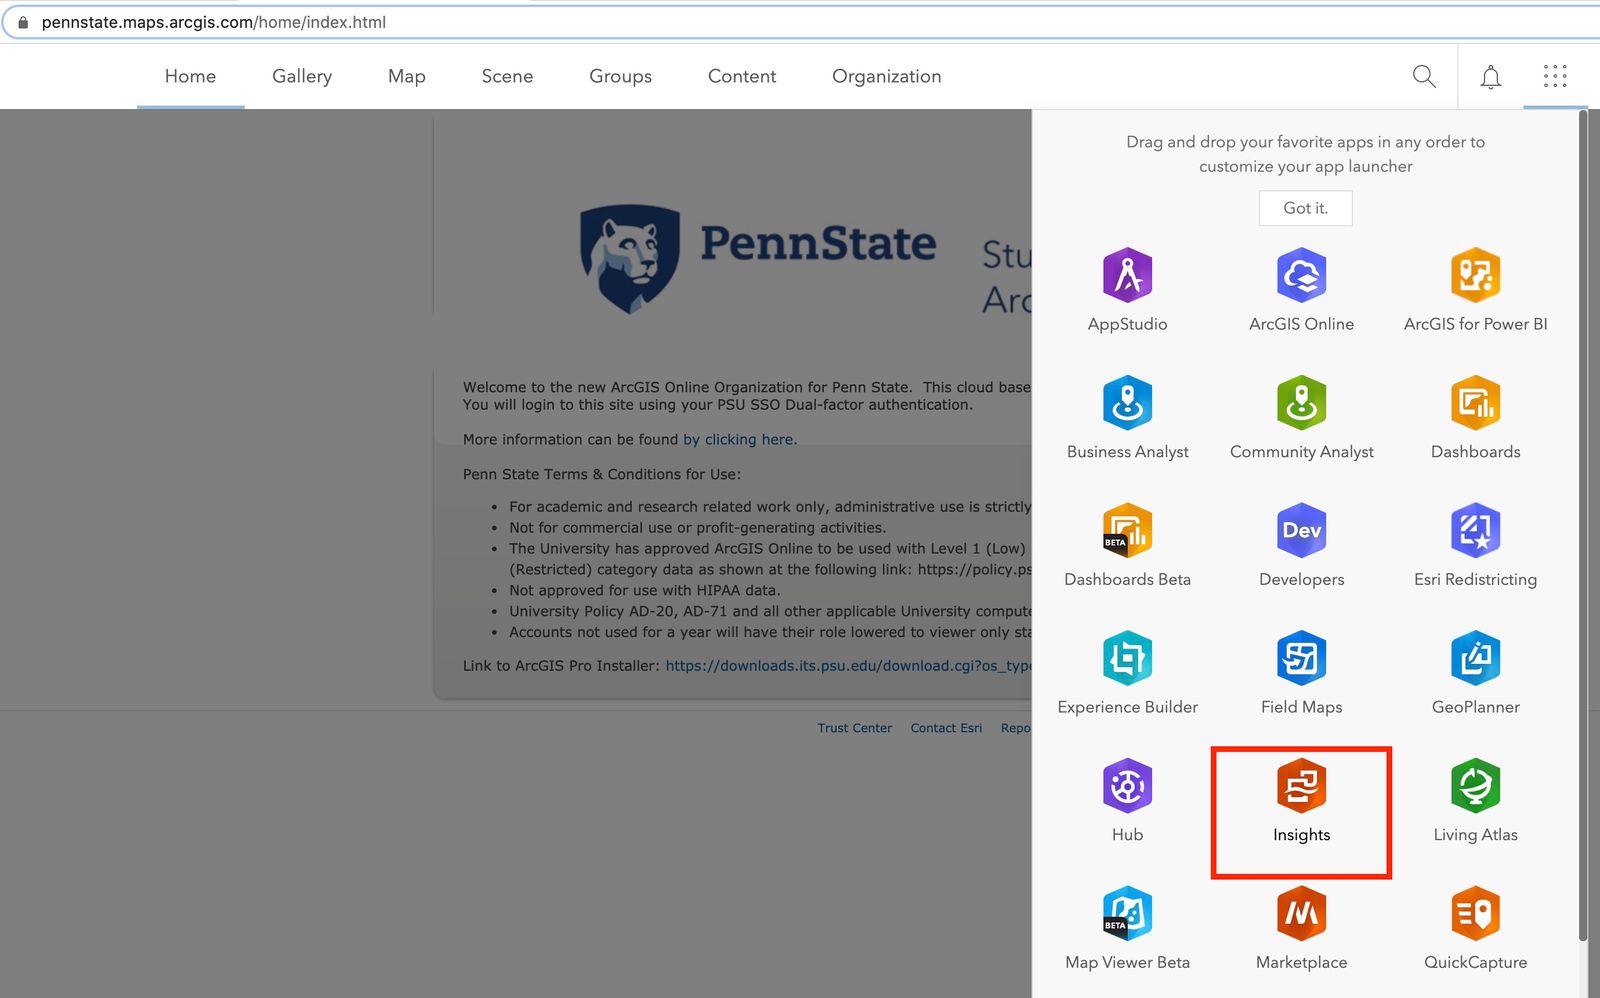
The Insights application
The activity we’re going to complete next is split into two parts. In the first part, you’ll learn how to do basic operations in the Insights application and do a little bit of visual analysis across coordinated views of prescription drug data. The second tutorial will have you explore refugee data and go a bit deeper into some of the analytical capabilities in the Insights platform.
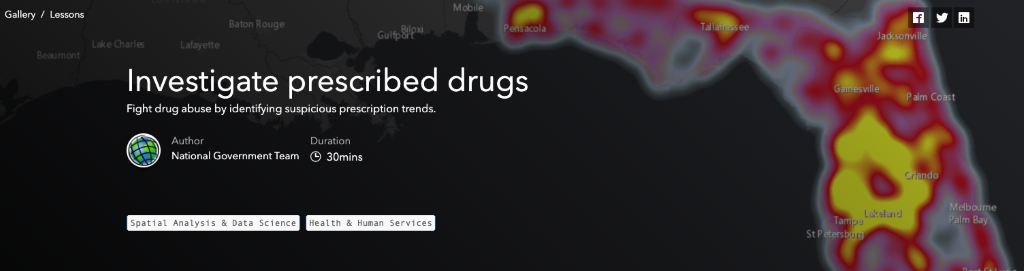
To access the instructions for the first exercise on prescription drug analysis, go here: Investigate prescribed drugs
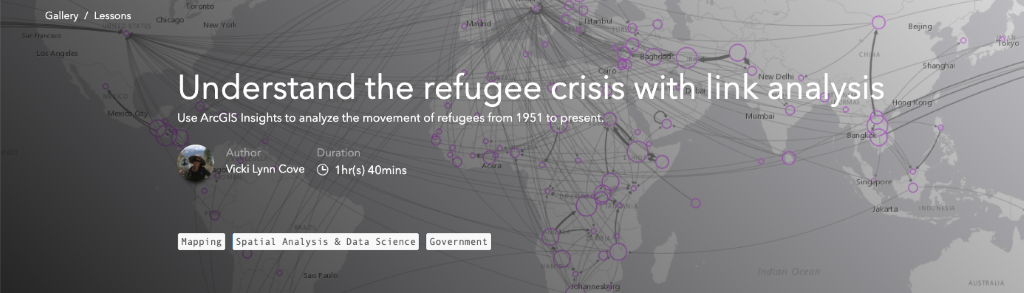
Once you’ve completed that tutorial, move on next to the tutorial on analyzing refugee data here: Understand the refugee crisis with link analysis
Deliverables
Work for this lab must be completed by Tuesday at 11:59 pm EST.
Below is a link to a “survey” consisting of three parts. The first part asks you to respond to short answer questions pertaining to the extent to which this platform supports spatial analytical tasks and who the target audience of this tool is. The second and third parts ask you to assess the usability and utility of the platform. Make sure to input your name on the final page before submitting.
Please see the Lab 2 drop box for the Grading Rubric for this assignment.
Multimodal Course

What is a Multi-Modal course?
A course that relies on a multimodal model is a course that provides instruction in several different ways, including video, pictures, audio, and text, to expose students to the same concept repeatedly and in different ways or "modes."
What are the affordances of this model?
Multimodal instruction enhances learning in two ways: first, by allowing students to experience learning in the way that is most comfortable for them, and second, by challenging students to experience and learn in other ways, which may be outside of their comfort zones. Multimodal instruction keeps students engaged with the content and is proven to increase students' abilities to understand and remember important information.
Things to pay attention to:
On the following pages, note that topics are presented in the form of text, video, images, and slideshows, allowing students to learn and process the same topic in a variety of ways.
We look forward to working with you!
Contact us directly or visit the Dutton Website to learn more!
Introduction to GEOSC 10
Welcome to GEOSC 10, Geology of the National Parks.
This course was developed to provide a broad overview of Geology while exploring some of our beautiful National Parks. It was developed to be a large enrolling, online general education course.
The instructors wanted to teach geology in a fun and engaging way by utilizing multiple modes of instruction. They include text, slide shows of the National Parks, detailed diagrams, narrated animations and PowerPoint mini-lectures, and vintage videos of students teaching other students about the geology of the National Parks. It also includes geological interpretations of classic rock songs performed by the course author! The student videos are from a CAUSE trip where students traveled to the National Parks and filmed each other teaching. The trip was way back in the early 2000s, but the videos remain in the course to build excitement for future student visits to the parks. The course has stood the test of time and remains a popular option for resident and online students alike.
The following pages are from a lesson, but the lesson in total is not replicated here. Note the structured layout of the material, providing students with clear learning objectives. The students are assessed with weekly multiple-choice quizzes, a final exam, and 6 online exercises.
Watch a brief video introduction from Dr. Alley! (1:03)
Welcome to Geosciences 10. I'm Richard Alley, and I'll be your tour guide to the geology of the national parks. In the course of the semester, we're going to visit some of the most beautiful and interesting places in the world. We're going to ask some big questions. Why are there mountains and volcanoes and earthquakes? Um, why are the mountains torn down by rivers, by glaciers? Um, what's the history of this planet, how do we live on the planet, how do we stay happy and healthy and terrific with the planet? And while we're doing it, we are going to visit some of the most beautiful and wonderful places on the planet. By the end of the semester, we're all going to know a lot more about the national parks, and you are going to be so excited that next summer you're going to be off to visit one because they're such wonderful places. Have a great semester. I'm going to jump on my bicycle and head into school and get to it.
Welcome to Module 5!
Tearing Down Mountains: Weathering, Mass Movement, & Landslides
This is Spring Creek. We're in the Spring Creek Canyon just downstream from Penn State's University Park Campus. People have been coming here to Fisherman's Paradise for a century almost, to catch wild brown trout in this world famous trout stream. The creek once flowed way above our heads, way up there, and it has cut this canyon and left these glorious 200 foot high cliffs here.
Right next to me there is a big rock and that big rock used to be at the top of the cliff and it fell down. If you have a kitten and you put something on a table or a shelf, the kitten tends to knock it off. There aren't kittens up there knocking down the rocks but there are ice crystals growing in cracks that widen the cracks. And there are tree roots growing in the cracks, and there are little earthquakes shaking things. The weather attacks the rocks. It breaks them up, things get in the cracks, and they knock them down. Once it gets down here, the stream may break it up more. The stream eventually will pick it up and take it down to the Chesapeake - to the ocean. And then sometimes the rocks dissolve on the way and there are things we can't see in the water that get taken down to the ocean, and they get made into seashells down there. And the pieces, and the seashells, eventually may get scrunched in an abduction zone or taken down a subduction zone to feed volcanoes, to make new rocks that can be attacked by the weather again. And if you see a cycle here, it's because there is a cycle.
We will tell you later how we know the times. The fastest this cycle can run is about 10 million years. Right here, these rocks are about 500 million years old so it's been a pretty slow cycle here, but pieces of it can be fast, because if you're in the way when that rock falls down it could kill you in a second. So there's very interesting things we have to understand here and we're going to deal with them in this module.
Fans of old-fogey rock music may recall that Paul Simon was "slip-sliding away." Paul was singing about human relations, not about debris flows. But, our hillsides really are “slip-sliding away,” too. Weather attacks rocks to make loose blocks, which may fall off cliffs rapidly or hang around to make soil before sliding downhill. So, crank up the tunes, watch out for rolling boulders, and let’s slip on into Module 5.
Learning Objectives
- Explain why the wind blows.
- Discuss why wind going up mountains produces rain and then becomes warmer going down the other side.
- Explain how weathering changes rocks physically and chemically at the Earth’s surface.
- Discuss mass movement and the downhill motion of loose rocks and soil.
- Explain how weathering and mass movement of old rocks are part of a cycle that leads to new rocks that experience weathering and mass movement.
What to do for Module 5?
You will have one week to complete Module 5. See the course calendar in Canvas for specific due dates.
- Take the RockOn #5 Quiz
- Take the StudentsSpeak #6 Survey
- Submit Exercise #2
- Begin working on Exercise #3
Questions?
If you have any questions, please feel free to send an email through Canvas. Remember to include all of the teachers and all of the TAs in the "To" line. Failure to email all teachers and all TAs may result in a delayed or missed response. Directions for how to send an email can be found in the Resources module.
Weathering Processes
Weathering Processes
We met metamorphism back in Module 4. If you take some Earth material (mud, for example) from one environment where it is “happy” (near the surface of the Earth), and move it into a very different environment, the mud changes. Moving the mud deep into the Earth, where temperature and pressure are high, causes new minerals to grow, and the soft mud with its tiny clay particles can become a hard metamorphic rock with big, beautiful crystals of fascinating minerals.
The materials in the mud are stable (or at least nearly so) under conditions found at the surface but not stable under conditions found deep in the Earth. And, perhaps not surprisingly, minerals produced deep in the Earth usually are not stable under surface conditions. Compared to deep in the Earth, the surface is wetter, has more oxygen, has a wider range of acid/alkaline conditions (with acid especially common at the surface), and has many more living things trying to break down the minerals to extract chemicals that are useful to them (“fertilizer”).
As a general rule, the more you change the conditions around a mineral, the faster the mineral changes into something new. (This “rule” has many exceptions, but it is often useful.) At or near the Earth’s surface, the changes that occur to a mineral at a place are called weathering. Moving the products of weathering is called transport. And weathering plus transport are lumped together as erosion.
Weathering, in turn, is divided into mechanical weathering and chemical weathering. Mechanical weathering refers to nature breaking big pieces to make little pieces; chemical weathering refers to nature making new types of materials that were not there previously.
Mechanical Weathering
Mechanical Weathering
Turning big pieces into little ones requires cracking the big ones. Cracks in rocks are caused or enlarged by processes including:
- Mountain-building stresses or earthquakes;
- Expansion as erosion removes the weight of overlying rock;
- Expansion and contraction during heating and cooling (especially very near the surface during forest fires; a really hot fire followed by a rainstorm can change temperature a lot in a hurry);
- Growth of things in cracks (tree roots, various minerals, and especially ice).
Probably the most important mineral that grows in cracks is ice, but others do too. For example, the mineral thenardite, Na2SO4 (no, you don’t have to memorize the mineral or the formula!) can add a lot of water to its structure (10 molecules of water for each Na2SO4, to make mirabilite, Na2SO4·10H2O, and you still don’t need to memorize the mineral or the formula), expanding in the process. Some pieces of the “dry” mineral, thenardite, may fall into a crack in a dust storm during the dry season, and then change to the much bigger mirabilite during the rainy season as the air gets humid, wedging open the crack. Too much rain may dissolve the mirabilite and move it deeper into the crack where it can lose water during the next dry season and then get wet and expand again, and again… This process is breaking many of the ancient monuments of Egypt as increased irrigation and other activities give seasonal increases in humidity in some places. (The story is even a little more complex than this, but, as shown below, the growth of minerals in cracks really does break rocks!)
Video: Rock Weathering (1:44)
Rock weathering really does happen. Things break rocks. Here is an example of tree roots breaking a human-made rock, or pavement, and we have to worry about a lot of human-made things being broken. The National Park Service preserves so many historical things that they actually have a National Center for Preservation Technology and Training to learn how to preserve our past for the future, as shown here. These pictures are just a little bit old, but they show an attempt by this National Center and Princeton University to learn how to save rocks from certain kinds of weathering. And they were worried about sodium sulfate salts that get into cracks and then can pick up water and expand, and in doing so they can break the rocks. And this would be thenardite changing to mirabilite. You don't need to know the detail, but it really does happen. And these pictures are slightly old, but what you can see here is they had developed a treatment that was used on some of these that protected them. And others, that were put in the salt and did not have the treatment, were very clearly not protected. So there are things that we humans can do to help save the things we made, but there is no question whatsoever, that nature does know how to break rocks.
Want to see more?
Enrichment: Another vintage movie for you to enjoy--and it won't be on a quiz. Here, National Park Service Ranger Jan Stock and the CAUSE students explore the freeze-thaw cycle in Bryce Canyon National Park.
Video: The Freeze-Thaw Cycle: Bryce Canyon National Park (1:17)
This white feature here is called the Wall of Windows. It's actually limestone. And it started out with a little tiny hole, like the hole on the left, and then it's eroding and eroding and eroding.
You've got the bridge on top. And then the bridge on top will fall away. And then you'll have the two hoodoos left standing. The difference between a natural bridge and an arch? Natural bridges are formed by streams and rivers running through underneath, cutting away.
Whereas this one is?
Whereas this is actually frost wedging.
OK.
Where it freezes and thaws and freezes and thaws and freezes and thaws and then it breaks away in the different layers.
Chemical Weathering
Chemical Weathering
Chemical changes are often more interesting and more complex than physical ones. There is a great range of possible changes, and you must know a lot of chemistry to really appreciate all of them. In general, weak acids are the most important. (Strong acids would be most important, except nature doesn’t make large quantities of them!) Rainwater picks up carbon dioxide from the air and becomes a weak acid called carbonic acid. In soils, water may pick up more carbon dioxide plus organic acids from decaying organic material, becoming a slightly stronger but still-weak acid.
When acid attacks a rock, the results depend on what minerals are present, how warm, wet, and acidic the conditions are, and a few other things you don’t need to worry about. We can sketch some general patterns. Suppose we start with granite, a silica-rich rock that forms in many continental and island-arc settings. Granite is fairly common and contains a lot of the commonest elements in the Earth’s crust, so learning about granite gives you insights into weathering of other things. Don’t obsess about learning the details of the minerals we discuss; start by looking for the big picture.
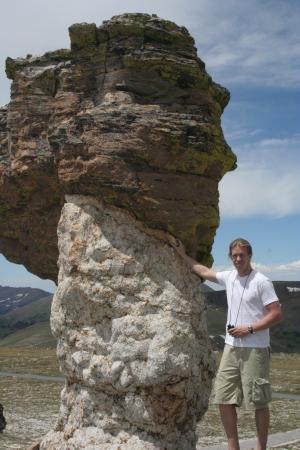
In the image below, you see Penn State graduate Matt Spencer in front of white granite that was intruded into dark metamorphic rock, along Trail Ridge Road in Rocky Mountain National Park. The granite has weathered faster than the metamorphic rock in this environment, so the granite remains only where it is protected by the overhanging metamorphic rock. (These vaguely mushroom-shaped features are called "hoodoos", by the way.)
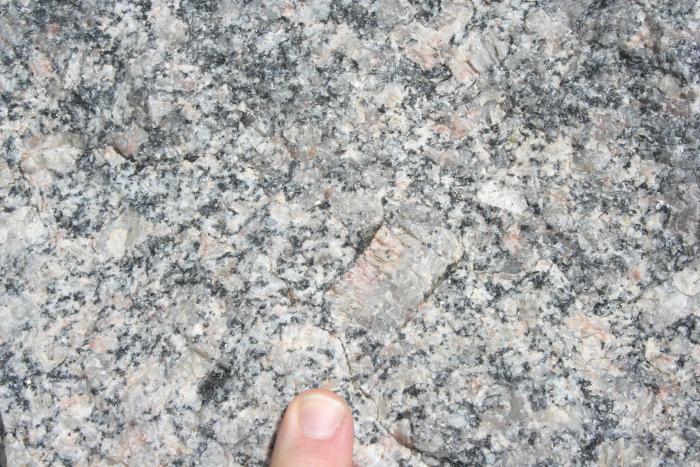
As shown in the close-up picture of a granite boulder below, granite usually is composed of four minerals: quartz (which is almost pure silica, with silica in turn composed of the elements silicon and oxygen), potassium feldspar and sodium-calcium feldspar (mostly silica, with a little aluminum replacing some of the silicon and potassium, sodium or calcium added for balance), and a dark silica-bearing mineral containing iron and magnesium (often a dark mica called biotite). The eight elements named in this paragraph make up almost 99% of the atoms in the rocks of the crust of the Earth. (Helping living things survive and running our economy requires many other elements that are quite rare in rocks, one reason that geologists are hired to find valuable, rare things and help mine them.)
When granite interacts with carbonic acid, several things happen. Typically, for most of the minerals in most environments:
- Iron (Fe) rusts. It picks up water and oxygen and remains in the soil as little pieces of rust.
- The aluminum (Al), potassium (K), and silica (SiO2) from the feldspars and from the dark mineral rearrange into new minerals, called clays, that also include some water.
- The calcium (Ca), sodium (Na), and magnesium (Mg) dissolve in water and wash away.
- Most of the quartz (silica as a mineral) sits there almost unchanged as quartz sand (a little of it may dissolve and wash away, but most stays).
One can write a sort of equation:
Granite → rust + clay + (dissolved-and-washed-away Ca + Na + Mg) + quartz sand
The rust, sand, and clay left behind, plus a little organic material often including worm poop, become the indispensable layer we know as soil. (And, if you have ever tried to drive a car on soft soil during a rainstorm and had your tires sink in and get stuck, you may call the soil “mud”, possibly with some bad words added.)
The calcium and silica that dissolve and wash into the ocean are used by sea creatures to make shells, the dissolved magnesium washed into the ocean often ends up reacting with hot rocks at spreading ridges to make new minerals in the seafloor or goes into some of the shells, and the dissolved sodium accumulates in the ocean to make it salty. (Eventually, the ocean loses some salt, often by the salty water getting trapped in spaces in sea-floor sediments and going down subduction zones to feed volcanoes; evaporation of water in restricted basins also may cause deposition of some salt.)
You should recognize that this is a very general description of what happens; were it this easy, there would not be hundreds of soil scientists working to understand this important layer in which most of our food grows. In general, the hotter and wetter the climate, the more stuff is removed—rust and quartz sand can be dissolved in some tropical soils, leaving aluminum compounds that we mine for use in making aluminum. In dryland soils, calcium and magnesium may be left behind forming special desert soils, or sodium may be left behind forming salty soils in which little or nothing will grow.
You also should recognize that the “chunks” in soil – rust, clay, sand, and organic materials – can be carried away by streams or wind, or glaciers, but as chunks rather than invisible dissolved materials. We discuss this loss of chunks in the next sections. If chunks are carried away more rapidly than new ones are formed, the soil will thin, and we will find it difficult to grow food to feed ourselves (this is what Teddy Roosevelt worried about in the quote at the start of this Module). The chunks eventually are carried to the oceans and deposited as sediment on the seafloor, together with a lot of shells.
Recycling
Granite may form beneath a volcano in a subduction zone. We have just seen that the granite then will begin to break down, making dissolved things and chunks. Eventually, the chunks are carried to the sea, by rivers and glaciers and wind (we will study this transport soon), while the dissolved things also go to the sea where they are turned into shells or other things. Sediment consisting of these chunks and shells, with some of the salty water in the spaces, is then taken down subduction zones to feed volcanoes that make granite. Some of the shells even contain a little carbon, and some dead things containing carbon are buried in the sediments, and some of this carbon is taken down subduction zones and supplies carbon dioxide to the volcanoes with water, helping make carbonic acid that weathers the granite.
If this looks like a cycle, it is! The Earth really does cycle, and recycle, everything! But, going around this loop once takes at least millions of years, and may take a lot longer than that, issues we'll discuss later.
Grand Tetons and the Gros Ventre Slide
The Grand Tetons tower above the valley known as Jackson Hole, Wyoming, provides the epitome of western scenery for many people. A still-active pull-apart fault lies along the front of the range and slopes steeply downward beneath Jackson Hole. From the highest peaks to the fields of the Hole, where elk and moose and bear are common, is well over a mile vertically (roughly 2 km), but the total vertical offset on the fault is almost 6 miles (10 km) (we don’t see this total offset because a lot of rocks have been eroded from the top of the range and deposited in the valley). The uplifted block is primarily old metamorphic rocks that erode only slowly. The faulting is probably related to the Basin and Range extension that also gave us Death Valley, although the complexity of the region makes any interpretation difficult. Dr. Alley recalls huddling next to an overhanging rock, far up on the steep front of the Tetons, watching hailstones rattle off the trail from a black deck of clouds barely over his head. It is a truly awesome place.
A few miles (few km) east of the park you can visit another interesting feature: the Gros Ventre Slide Geological Site. There, as shown in pictures and the VTrip below, a mountain-sized ridge is made of rock layers that slope steeply, almost parallel to the north slope of the ridge, down to the Gros Ventre River. Those layers include strong, resistant sandstone resting on weak, slippery shale. The river had eroded down through the sandstone and into the shale, leaving the toe of the sandstone unsupported. In June of 1925, after a particularly wet spring, the entire mountainside let loose, sliding along the soft shale down, across the river, and more than 300 feet up the other side; a rancher and his horse who were on the other side barely escaped safely. The slide mass made a dam, and the river then made a lake many miles long and as much as 200 feet (60 m) deep. The entire slide probably required only seconds to occur and moved cubic miles (many cubic kilometers) of rock.
Such a dam of loose debris is not very strong; water flowing through its porous spaces or over it can remove rocks and weaken it greatly until it collapses catastrophically. Back in Module 2, in the West Yellowstone VTrip, we saw that an earthquake just northwest of Yellowstone in 1959 caused a similar landslide, which dammed a river to form a new lake, and that the Army Corps of Engineers had rushed in to move massive amounts of debris and prevent a collapse of the dam. The Corps knew how likely and how dangerous such a failure would be, in part because the Corps had not been tasked to act at Gros Ventre in 1925. In 1927, the dam formed by the Gros Ventre slide failed, washing out a small town downriver and killing six people. The loss of life would have been much larger if more people had lived there. A few of the people living there were saved when a ranger saw the start of the flood, drove downstream faster than the flood and warned the people to flee. Unfortunately, not everyone listened.
Take a tour of the Grand Tetons National Park.
Want to see more?
Here are some optional resources you might also want to explore! (No, these won't be on the quiz!)
-
A Brief History of the Gros Ventre Slide Geological Site (US Forest Service)
- Photos of the Grand Tetons National Park (UCGS)
Mass Movement
The Gros Ventre slide is an especially dramatic example of an important process that usually is more boring: mass movement. This is the name given to the downhill motion of rock, soil, debris, or other material when the flow is not primarily in wind or in a glacier, or in water (if the material is washed along by a river, we call it a river)
Water is usually involved in mass movement, however, and most mass movements occur when soil or rock is especially wet. Water helps cause mass movement for four reasons: 1) water makes the soil heavier; 2) water lubricates the motion of rocks past each other; 3) water partially floats rocks (a rock pushes down harder in the air than in water) so that the rocks in the water are not as tightly interlocked and can move more easily past each other; and 4) filling the spaces in soil with water removes the effect of water tension.
Number four, above, may deserve a bit more explanation. Think about going to the beach and building sandcastles. Dry sand makes a little pile with sides rising at maybe 30 degrees (steep, but not too steep; see the diagram below). Totally saturated (wet) sand flows easily, forming a pile with a much more gradual slope. But people making sandcastles want damp sand, which can hold up a vertical face. You can even make and throw damp sand balls (be careful where you throw them).
Now watch a demonstration of the process followed by a video explanation.
Video: Mass Movement and Sandcastles Demonstration (:55 seconds)
So, let's see what happens with piles of sand. This is a protractor and I'm adding a little playground sand here. This is dry sand and you'll see it makes a moderate slope. It's going to be about 30 degrees there, as you see on the protractor. Now I'll add a little bit of water, but we're just going to make it damp, not wet and you're not going to be impressed by my skills at making sand castles. But you know when you've seen a sand castle that you can now get a very steep slope. But if we take that sand castle and a wave comes in, the tide comes in, we pour a lot of water on it, you see what happens. It flattens way out. And so we have very different behaviors depending on whether it's dry or damp or wet.
Video: Mass Movement and Sandcastles Explanation (2:09 minutes)
So what's going on with this dry damp wet sand, really what's going on down in it. Well let's take a zoom in on the dry sand. These are individual grains of sand made bigger and they make a nice pile that is sort of like this one. You could have a pile like that underwater and totally wet, but the water supports some of the weight of the grains of sand. The water makes it easier for the sand grains to move over each other and so even a little shake or a little current tends to knock down the pile and give you something very broad and not at all steep on the edges such as what we show here. In between the damp case, water molecules tend to stick to other water molecules and they tend to stick to the sand. So when the water is sticking to the sand and the other water, it sort of forms like you see in this diagram. And if we zoom in, here's two grains with the water in between sticking to the sand grains and to the other water molecules. If you were trying to pull the sand grains apart, it takes a force because you either have to pull a sand grain or both sand grains out of the water and break that attraction or you have to pull the water apart and break that attraction. And so the strength of the water sticking to the sand can hold up a sand castle or it can hold up most of the hillside slopes on the earth, most of the time. So here are three dr,y which might give you a sand dune, and damp, which can give you really spectacular sand castles and holds up most of the slopes on Earth, most of the time. But when you make them really wet they may make landslides and run down the hill and that's not good if you're in the way.
The details of the surface physics involved are a bit complicated, but basically, a drop of water will sit at the junction of two sand grains. If you pull the sand grains apart, both grains will end up wet, so you had to “break” the water from one continuous film into two. There is a similarity to a dripping faucet. A water drop doesn’t fall off immediately but first becomes large and heavy. Water molecules stick to each other, and to the faucet, so strongly that they can hold up a large drop of water before it falls. (In situations such as this, the attraction of water molecules for each other is usually called surface tension.) Damp sand thus is strong—a landslide would require some sand grains to move rapidly past other sand grains, breaking the water bonds between the grains. In fully wet sand, however, the grains move more freely in the water without ever breaking it, so motion is easy. Hence, wind can blow dry sand into dunes, damp sand tends to stay where it is, but wet sand flows easily.
Classifications of Mass Movements
There are elaborate classifications of mass movements, depending on how fast, how wet, how coarse, how steep, and how "other" they are. Most of the names make sense: falls are rocks that fell off cliffs, topples are rocks that toppled over from cliffs, landslides, debris flows, and debris avalanches are fast-moving events, and slumps are something like a person slumping down in a chair (failures of blocks of soil along concave-up curved surfaces).
One fascinating and scary type of mass movement occurs in “quick” clays. You can read about these in the Enrichment. Quite literally, in certain places at certain special times, the foundations of a town built on sediments made of certain types of clay may liquefy and flow down the river, killing people. (Most people don’t need to worry about these, though!)
Enrichment
The quick clays that cause large, dangerous landslides generally start off as clay layers deposited rapidly in a shallow ocean, that then is raised above sea level. This often occurs near a melting ice sheet at the end of an ice age. The melting ice dumps a lot of sediment including a lot of clay, and then, as the weight of the ice is removed, the land rebounds above sea level. Clay particles tend to be platy and may look a little like playing cards. When these particles are deposited rapidly in the ocean, the particles may make a house-of-cards structure, with lots of big spaces. The saltwater supplies large ions that sit in the spaces and help hold the “cards” in position, something like little bits of glue helping hold up a house of cards.
After the clay is raised above sea level, rain supplies fresh water that slowly washes out the salt, like removing the glue that was holding up the house of cards. Eventually, a small disturbance may start a collapse, and this tends to make the clay “run away”, failing catastrophically from a solid to a liquid almost instantaneously, and generating a flow.
Flows from such clays are known especially from parts of Canada and Scandinavia. A quick clay failure at Saint Jean Vianney, Quebec in May 1971 destroyed 40 houses and killed 31 people in Canada, and a similar one at Nicolet, Quebec in 1955 killed 3 people. The Norwegian Geotechnical Institute released an amazing report and video about the Quick Clay Slide at Rissa in 1978; this is generally available online, if you search for it, and is truly fascinating. A man with a new (in 1978) camera filmed part of it but then had to run for his life as the slide expanded toward him. (When this was being written, you could find the video on YouTube and elsewhere.)
Sometimes, a quick clay slide will be small and will generate a flow that crosses a road. Bulldozing the clay out of the way does little good; more just flows across. But throwing a bag of salt into the flow near the road and driving a tracked vehicle through to mix the salt and clay may cause the flow to solidify so that it can be bulldozed away.
Soil Creep
Soil Creep
The most important mass-movement type in terms of transferring material downhill is soil creep, the slow (typically inches, or centimeters, per year or less) downslope motion of soil. Creep may be just a very slow landslide. It may occur from freeze-thaw processes—a column of ice that grows under a small pebble on a cold night pushes that pebble out from the hillslope, and the pebble falls straight down when the ice melts, effectively moving a tiny distance down the hill (see the video above). When trees fall over and uproot soil, or when groundhogs and even worms dig up rock grains and allow them to move downhill, creep is occurring. If you look at a typical hill slope, streams on the lower slopes are present to move water and rock downhill, but the upper slopes lack streams. There, soil creep moves the material downhill.
Naturally, hillslopes typically reach a balance, in which weathering breaks down rocks about as rapidly as mass movement and streams take the broken rocks away. The balance may occur with bare rock sticking out (making cliffs, for example), or with a lot of soil covering the rock. If soil creep dominates the mass movement, the hillslope may be close to balance at all times. If landslides dominate, then the soil will build up for a while before suddenly sliding off, and you have to watch for a long time to see the balance. Over a very long time, the hill will usually get flatter, causing the mass movement to slow. However, the soil will very gradually thicken to slow the weathering as the hillslope is reduced, and near-balance will be maintained.
Humans are greatly upsetting this balance worldwide. Our activities—bulldozing, cutting trees whose roots held the soil, plowing, and more—are moving more material than nature moved before we were involved. Landslides are becoming more common, and causing more damage as we build in more dangerous areas. Soil erosion has increased from our farm fields, making it harder for us to feed ourselves. We could slow or reverse many of these damaging trends if we decided to work at it.
Video: Soil Creep/Frost Heave (1:59)
There are many processes that move soil and loose rocks slowly downhills as soil creep. One of them we're going to show you here. We've drawn for you a hill with a pebble, just a little piece of rock, less than a half an inch or so. There would be lots of pebbles on this hill. Now sometimes on a cold night, ice will grow beneath the pebble and it will push it away from the hill as is shown here. This is a picture of how that process looks in the real world. So this is ice and it has shoved these pebbles up by about one inch from a little hillside. These are pine needles and these are pieces of leaves and bark. So, you can see this is at Colyer Lake in Central Pennsylvania. Now what will happen next is that the ice will melt during a warm day and when the ice melts the pebble will tend to fall down. And the net from that will be that the pebble has moved a little bit down the hill in a day or so. Later in the semester we will see that this process also happens to bring rocks out of the soil, up to the surface, so they can then be moved downhill. Pennsylvania's hillsides had a lot of this process during the Ice Age when we were in a permafrost climate. And our hillsides now are covered with big rocks that will twist your ankle if you're hiking if you're not careful and this is part of soil creep.
Here is a simplistic diagram. See if you can describe what is happening to a friend and then take a look at some truly amazing landslides from around the globe.
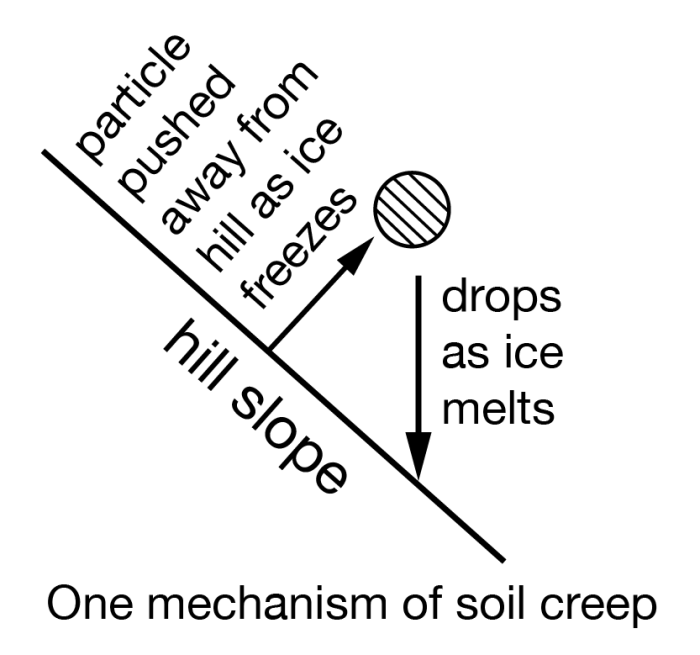
A Slideshow of Landslides Around the Globe
Optional Enrichment
These will not be on the quiz but might prove interesting. First, let's start with a video of some amazing landslides.
Video: Top 5 Massive landslide Caught on Camera (10:40)
You can hear background noise, but no true conversation.
And now a retro video about one of the National Park's most iconic elements.
Video: Formation of Delicate Arch (2:40)
Here we are at Delicate Arch. With the possible exception of Old Faithful, this is the most famous feature, the symbol of the parks. This is one of the very many, more than 2,000 arches, that are in Arches National Park, and it shares with them the same origin. These are not carved by running water shooting underneath them. Nor are they carved by wind blasting a hole through it. They're carved mostly by some very odd processes.
Down below, there's a layer of salt that was deposited in a sea a long time ago that was drying up here. Salt, when it's down deep and there's something sitting on top of it, is soft, and it flows. And the salt has flowed into sort of a mound, something like a lava lamp bulging up, and that mound has warped the rocks. And if you take rocks and sort of warp them up, they crack. And so there are these cracks that have made standing vertical walls of rock.
Well, the next thing that happens, if we look at that running along towards the bottom, there's a line on both sides of it. That's a soft layer, and it weakens things. Well, when you start undercutting a cliff-- we have these cliffs, and they get undercut by water leaking out along these little cracks-- then what happens is pieces fall off. And enough pieces fall off that eventually one of the pieces breaks through, and then it's an arch.
This arch is not long for the world. We see on the left, about halfway up, how thin it's getting. And we also see at the top a whole bunch of cracks that are developing. That layer across the top is trying to sag, and as it does, there are cracks that are forming. And some of those cracks sort of look like Pennsylvania keystone sitting up there.
And so it might last thousands of years. It might go in the next big storm. But it is not terribly long for the world. We know that many of the prominent and famous features in the park have changed in the time people have been watching. It will be a loss, but an educational one, when this very famous feature of the Park Service also changes.
Soil Erosion
(An extensive collection of animations on this subject)
Mass Wasting/Landslide Animations
(An extensive collection of animations on this subject)
A Rocking Review: Somewhere Over the Puddle
Somewhere Over the Puddle
If you want another look at the weather system, and the difference between the Redwoods and Death Valley, the Wizard of Odd takes you Somewhere Over the Puddle in this review revue. (The Sierra tops out over 14,000 feet but in most places is lower, so don't let it bother you that the air in the GeoClip went a little higher than the air in this song--both are right, depending on just where the air goes over.)
Video: Somewhere Over the Puddle (2:54)
Dr. Alley: (SINGING) Somewhere over the rainbow, raindrops drops. Sun and rain make a rainbow with your eyes in between, that's all. Sun falls straight on the equator, just skims the poles.
So tropical heating is greater. Air rises and sinks in rolls. Air lifted in these currents great expands as it feels lesser weight, brings cooling. Air cooling holds less H20, condenses to rain, clouds, or snow. That fall, no fooling.
When there's evaporation, it takes energy That is why perspiration drying cools you or me. Equatorial evaporation stores solar heat that's released by cloud condensation. Energy is conserved, pretty neat.
This heat from Condensation slows. Cloud cooling as it upward grows while raining. But when this air comes down, it's dry, and squeezing drives its fever high. And you know from your training.
Three degrees F per 1,000 feet upward, cools and rains. Five degrees F per 1,000 feet downward warms up the downwind plains. Somewhere over the rainbow, raindrops fall.
Sun and rain make a rainbow with your eyes in between, that's all. Wet redwoods, cold sierra high above Death Valley set to fry. That's why.
Introduction to EARTH 103
The course author's goal was to create an interactive and illustrative online "textbook" to show the impacts that climate change has on the earth now and in the future. Based on that, the text-first format worked well.
Students begin by reading text accompanied by lots of pictures, which were added using the H5P slide sorter that permits students to flip through several pictures embedded within sections of text. As students progress through the course, they encounter embedded videos, Knowledge Check questions, and Activate Your Learning exercises. Together, these elements keep students engaged with the content and help them to build knowledge as they go. Knowledge Checks, interactive questions developed with H5P, allow students to check their understanding of the topics covered in each section. The Activate Your Learning exercises are more involved, requiring students to take some kind of action beyond answering simple questions. These actions include visiting a website to search for a topic, gathering information, reading an article and writing a short essay, or running a simulation. Students work their way through the content by reading, looking at pictures, and completing any Knowledge Checks and Activate Your Learning activities. They then take a lesson quiz and either complete the lab or work on part of their capstone project.
Module 3: Earth's Climate System
Video: Module 3 Introduction (1:14)
Hi, students. Welcome to module 3 on climate models. I grew up in London back in the 1960s, and weather forecasts were always wrong. They would predict a storm--it would be perfectly sunny. They would predict sunny weather, and there would be a storm. They were always wrong. Now we're at a time when weather prediction is really good, and that is because the computer side of the models is very strong and very advanced, and we're getting much better at predicting climate in the future as well.
So, in this module, you'll learn about how CO2 levels and forecasted levels of CO2 drives climate models. The amount of CO2 in the atmosphere will definitely be related to the temperature in the future, as well as the global rainfall in the future, storm tracks, and storm intensity in the future, fire forecasts in the future, and sea level rise. And what we're going to learn about in this module is how different levels of CO2 that are controlled by human activity in the future will definitely be used to predict temperature, rainfall, hurricane intensity, as well as sea level rise. I think you're going to learn a lot about this module, how it's important for your future, and I hope you enjoy it.
Introduction
This course is all about the Earth’s climate. Thus, it is essential that you have a solid understanding of how the climate system works. This module is all about the climate system. It is by far the most technical module in the course, and our philosophy is to lay out the science in a comprehensive way, equations and all, so that you can see that Earth's climate is in part fairly simple, governed by physical relationships that describe how heat from the Sun is exchanged on the surface of the Earth and in its atmosphere. Then, there are some very complex aspects of the Earth's climate that we will not devote much time to.
Here is an example of why this module is important. The Polar Vortex has become a household name in the US in recent years. In Texas in the winter of 2021, the cold air from the vortex caused unusually cold temperatures and this crippled the power system that was not built to withstand such temperatures. The power cuts caused chaos, up to 5 million people were without power often for many days, 12 million people lost water service due to freezing pipes, and 151 people died as a result of hypothermia and carbon monoxide poisoning.
Video: Deep freeze in Texas: Millions without power, 21 dead in historic snowstorms (2:54)
Deep freeze in Texas.
Homes and roads blanked in deep snow and temperatures colder than Alaska… Historic and deadly winter storms have sent the southern US state of Texas into a deep freeze, with temperatures plummeting to as low as -18C in some places. In a state more used to heat and sunshine and ill-equipped for Arctic conditions.
Burke Nixon - Houston resident: We have no water. We woke up this morning, our pipes are all frozen, and we have no water in the house. Our neighbor just got us some propane to try to thaw our pipes because they are frozen. We’re not used to this in Texas.
For many, the conditions have been made tougher by being left without power. With the storm knocking out about a third of the state’s energy production capacity. As of late Tuesday, more than 4 million cross the state were still without electricity.
Birgit Kamps - Houston resident: We were getting ready to cook dinner and all of a sudden, lights went off, power went off, everything went off. And I was like, “Wow, now what do I do?” And, I grabbed a bunch of blankets. So we cuddled up with our three dogs, one cat, my daughter and, you know, made it through the night.
Scenes from, Louisville, Kentucky
Scenes from, Telluride, Colorado
Winter storms have hit vast swathes of central and southern US since the weekend.
Scenes from, Ciudad Juárez, Mexico
And even seen rare snowfall and caused power outages in northern Mexico.
Scenes from, Chicago, Illinois
At least 21 people have been killed across four US states, including in falls and traffic accidents.
Scenes from, Brunswick County, North Carolina
The extreme conditions have also triggered at least four tornadoes, including one in coastal North Carolina that killed at least three people. The freezing weather is expected to continue to grip much of the United States until the weekend.
Those of us on the East Coast and Midwest of the US and our neighbors in Canada, 187 million people in all, lived through an extremely cold week at the beginning of 2014. Air temperatures, without the windchill factored in, reached -35oC in eastern Montana, South Dakota, and Minnesota. This cold was a result of the southward expansion of the polar vortex, a whirlwind of cold dense air that is normally restricted to the area around the poles. Understanding the polar vortex, and how it became unstable and swept across the Midwest and eastern parts of Canada and US, is key to interpreting the significance of the extreme cold in early 2014. Without this understanding, you might think that the expansion of cold air is a sign of cooling climate. However, it is likely that the opposite is the case; the recent cold snap is actually a result of warming. This is how it works. As you will learn in this module, the northern high latitudes are warming more rapidly than the rest of the globe as a result of melting sea ice. You will also learn that such warming leads to diminished wind velocities, including the polar vortex. As the vortex weakens, it becomes less stable and begins to wobble and stray from the region around the North Pole. It turns out that the recent cold snap was just one of these wobble events, and the projections are for polar vortices to become more common over North America in the future, just as other extreme events like extratropical hurricanes such as Sandy, heat waves and droughts become more frequent.
Now, right off the bat, we need to make it clear that the "simple" relationships are often portrayed in the module in terms of equations. You do not need to be a Math major to understand these equations, nor do we want you to memorize them. The point of showing the equations is not to cause great anxiety, but to provide an understanding of the relationship between two variables. For example, you should be looking to distinguish relationships that are linear (such as a=b*x [where * is multiplied by]) from those that are quadratic (such as a=bx2). This is the level at which we expect you to understand equations. One last word, the lab for this module is designed to strengthen the fundamentals you learn in the reading. By experimenting with climate in the lab, you should come away with a really solid understanding of the climate system.
Goals and Learning Outcomes
Goals
On completing this module, students are expected to be able to:
- describe how energy is absorbed, stored, and moved around in Earth's climate system;
- distinguish how the amount of energy stored determines the temperature;
- interpret the importance of feedback mechanisms that make our climate system sensitive to forcings, but also provide a stabilizing influence;
- infer how temperature responds to changes in solar input, albedo, and greenhouse gas concentrations;
- evaluate how simple (i.e., STELLA) models can be used to make projections of climate variables.
Learning Outcomes
After completing this module, students should be able to answer the following questions:
- What are heat and thermal energy?
- What are the different types of electromagnetic radiation?
- What is blackbody radiation and what is the significance of the Stefan-Boltzmann law?
- What is emissivity and what is its significance?
- What is albedo and what are albedo values for different materials?
- What is the solar constant and how is it measured?
- What is insolation and what are its geographic and annual distributions?
- What does sunspot history look like and how is it related to solar intensity?
- What are the relative heat capacities of different materials?
- What is the greenhouse effect and what are the different greenhouse gasses?
- What are the basic energy flows in the atmosphere?
- What is positive and negative feedback and what are examples of each?
- What are the energy budgets of different latitudes?
- How is heat transferred in the atmosphere?
- How is heat transferred in the oceans?
- What is the Global Conveyor Belt and what is its significance?
Assignments Roadmap
Below is an overview of your assignments for this module. The list is intended to prepare you for the module and help you to plan your time.
| Action | Assignment | Location |
|---|---|---|
| To Do |
|
|
NOTICE:
There is some math in this section! It is mostly algebra. You should know how to read and understand these equations, but you do not need to memorize equations.
Global Climate
We begin with a quick glimpse of the global climate — and then we’ll try to understand why it looks this way. But first, what does climate mean? In the simplest sense, it is the average weather of a region — the average temperature, rainfall, air pressure, humidity, cloud cover, wind direction, and wind speed. This means that climate is not the same as weather; weather implies a very short-term description of the atmospheric conditions, and it tends to change in a complex manner over short time scales, making it notoriously difficult to predict. In contrast, the climate is less variable — it smoothens out the variability of the short-term weather. This course is about climate, how it is changing, and what that means for our future; as we move through this class, you should remind yourself periodically that we are not talking about the weather — our time frame is much longer.
So, let’s have a look at the climate as expressed by temperature:
As you can see, the equatorial regions are the warmest, and the poles are the coldest, with Antarctica being noticeably colder than the Arctic. The temperature varies more within the continents than the oceans, and there is a pronounced northward extension of warm water in the North Atlantic.
The global climate system is like a big machine receiving, moving, storing, transferring, and releasing heat or thermal energy. The machine consists of the oceans, the atmosphere, the land surface, and the biota on land and in the oceans; in short, it consists of everything at the Earth’s surface. The average state of this system — the global climate — is represented most simply by the pattern of temperatures and precipitation at the surface.
In order to really understand this complex machine, we will have to understand something about its parts, but we also need to begin with some fundamental ideas about energy, heat, and temperature, including the source of the energy for the climate system — the sun.
Useful Terms and Definitions Related to the Energy of the Climate System
Energy
In the broadest terms, energy is a quantity that has the ability to produce change in a physical system; it includes all kinds of kinetic energy (energy of motion) and potential energy (energy based on the body's position) and is measured in joules. One joule represents the amount of energy needed to exert a force of one Newton over a meter; so 1 Joule = 1Nm.
Power
Energy expended over a period of time is a measure of power, and in the context of climate, power is expressed in terms of Watts (1 Watt = 1 joule per second). This is also called a heat flux — the rate of energy flow.
Heat
This is simply the thermal energy of a body, measured in joules. Think of this as the average kinetic energy (vibrations) of the atoms of a material.
Heat Flux Density
This is a measure of how concentrated the energy flow is and is given in units of Watts per square meter.
Temperature
This is obviously closely related to heat, but it is the average kinetic energy within somebody. Materials can be the same temperature, but they may have different amounts of thermal energy — for instance, a volume of water has much more thermal energy than a similar volume of air at the same temperature. Remember that there are 3 temperature scales: Fahrenheit, Celsius, and Kelvin. We’ll use Celsius and Kelvin, which have the same scale, just offset so that 0°C = 273°K.
Simple Climate Model
We begin with a very simple analog model for our planet’s climate (figure below) in which solar energy enters the system, is absorbed (some will have been reflected), stored (some will have been transformed or put to work), and then released back into outer space. The amount of energy stored determines the temperature of the planet. The balance between the incoming energy and the outgoing energy determines whether the planet becomes cooler, warmer, or stays the same. Notice the little arrow connecting the box to the Energy Out flow — this means that the amount of energy released by the planet depends on how hot it is; when it is hotter, it releases, or emits, more energy and when it is cooler, it emits less energy. What this does is to drive this system to a state where the energy out matches the energy in — then, the temperature (energy stored) is constant. This energy balance, sometimes called radiative equilibrium, is at the heart of all climate models.
Global Climate System
Now, let’s consider the connection between this idea of an energy flow system to the actual Earth. As shown in the figure below, this system includes the atmosphere, the oceans, volcanoes, plants, ice, mountains, and even people — it is intimately connected to the whole planet. We will get to some of these other components of the climate system later, but to begin with, we will focus on just the energy flows — the yellow and red arrows shown below.
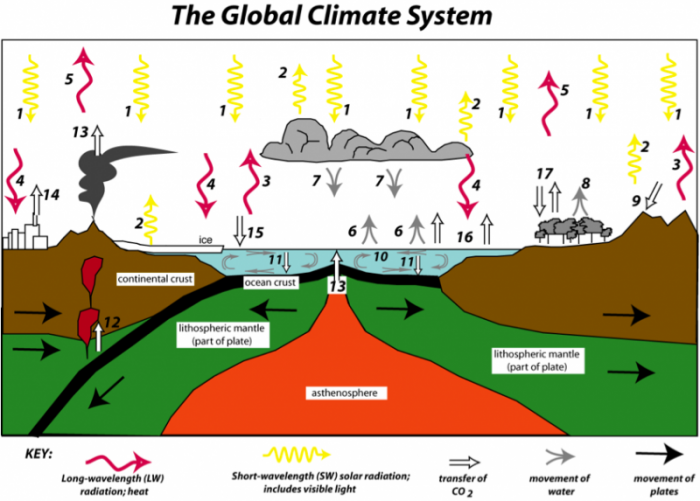
Numbers in the figure refer to the following key:
- Incoming short-wavelength solar radiation
- Reflected short-wavelength solar radiation
- Emission of long-wavelength radiation (heat) from surface
- Absorption of heat by greenhouse gases and emission of heat from the atmosphere back to the surface (the greenhouse effect)
- Emission of surface heat not absorbed by the atmosphere
- Evaporation cools the surface, adds water to the atmosphere
- Condensation of water vapor releases heat to the atmosphere, precipitation returns water to the surface
- Evapotranspiration by plants cools the surface
- Chemical weathering of rocks consumes atmospheric CO2
- Oceans store and transfer thermal energy
- Sedimentation of organic material and limestone (CaCO3) transfers carbon to sediment on the ocean floor
- Melting and metamorphism of sediments sends carbon back to surface
- Emission of CO2 from volcanoes
- Emission of CO2 from burning fossil fuels
- Cold oceans absorb atmospheric CO2
- Warm oceans release CO2 to the atmosphere
- Photosynthesis and respiration of plants and soil exchange CO2 between the atmosphere and biosphere
The figure above includes some new words and concepts, including short-wavelength and long-wavelength radiation, that will make sense if we devote a bit of time to a review of some topics related to energy.
Electromagnetic Spectrum
Brief Review of Electromagnetic Radiation
The energy we are concerned with here comes in the form of electromagnetic radiation, so it will help us to review some aspects of this form of energy. Electromagnetic (EM) radiation comes in a spectrum of waves, each consisting of an electrical and a magnetic oscillation of particles called photons; this spectrum is shown in the figure below:
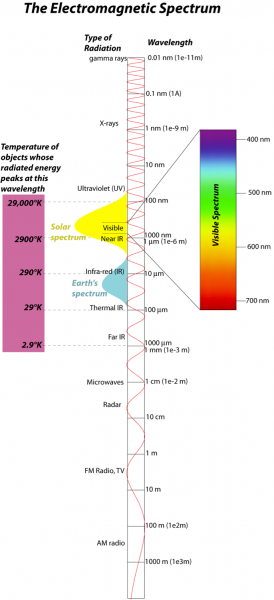
Blackbody Radiation
In the realm of physics, a blackbody is an idealized material that absorbs perfectly all EM radiation that it receives (nothing is reflected), and it also releases or emits EM radiation according to its temperature. Hotter objects emit more EM energy, and the energy is concentrated at shorter wavelengths. The relationship between temperature and the wavelength of the peak of the energy emitted is given by Wien’s Law, which states that the wavelength, lambda, is:
λ= 0.0029/T (λ is in m, T in kelvins)
But the energy emitted covers a fairly broad range, as described by Planck’s Law, as shown below:
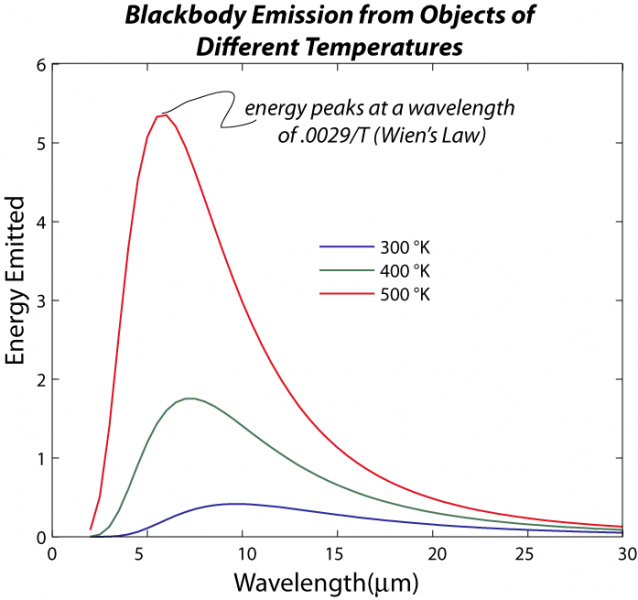
The total amount of energy radiated from an object is also a function of its temperature, in a relationship known as the Stefan-Boltzmann law, which looks like this:
F=σ T 4
where σ is the Stefan-Boltzmann constant, which is 5.67e-8 Wm-2K-4 (this is another way of writing 5.67 x 10⁻⁸; so 100 is 1e2, 1000 is 1e3, one million is 1e6, etc.), T is temperature of the object in °K, and so F has units of W/m2. If you multiply this by the surface area of an object, you get the total rate of energy given off by an object (remember that Watts are a measure of energy, Joules, per second). As you can see, the amount of energy emitted is very sensitive to the temperature, and that can be seen in the figure above if you think about the area beneath the curves of different color. This sensitivity to temperature is very important in establishing the radiative equilibrium or balance of something like our planet — if you add more energy, that warms the planet, and then it emits more energy, which tends to oppose the warming effect of more energy added. Conversely, if you decrease the energy added, the planet cools and emits far less energy, which tends to minimize the cooling. This is a very important example of a negative feedback mechanism, one that works in opposition to some imposed change. The thermostat in your house is another good example of negative feedback — it works to stabilize the temperature in your house, bringing it into radiative equilibrium.
The version of the Stefan-Boltzmann law described above applies for an ideal blackbody object, but it can easily be adapted to describe all other objects by including something called the emissivity, as follows:
F=εσ T 4
Here, epsilon is the emissivity, which is a unitless value that is a measure of how good an object is at emitting (giving off) energy via electromagnetic radiation. A blackbody has epsilon=1, but most objects have lower emissivities. A very shiny object has an emissivity close to 0, and human skin is between 0.6 to 0.8.
Check Your Understanding
Making an Impact (Engagement) Course

What is a Making an Impact/Engagement course?
This type of course is designed with experience in mind. Students are engaged in learning that encourages them to make an impact in their community.
What are the affordances of this model?
Making an Impact courses allow students to apply directly what they've learned in the course and apply it to a real-world context. These courses are often project-based and allow the learner to see the direct impact they can have on the community. By thinking about issues facing their community, students can develop their critical thinking, project management, and problem-solving skills while learning how to effectively collaborate with stakeholders and other students.
Things to pay attention to:
Notice that course content presents detailed explanations and instructions for students. The undertaking of large projects, and especially those which require much coordination between different groups of people, requires lots of planning, well-organized structure, and clear communication so that everyone involved has a good understanding of the requirements and parameters of the project and the course.
We look forward to working with you!
Contact us directly or visit the Dutton Website to learn more!
Introduction to EME 589
Welcome to EME 589, Management and Design of RESS!
This course was designed to assist Renewable Energy and Sustainability Systems students in developing project management skills while applying the knowledge they have acquired in previous courses in the program.
The instructor of this course wanted students to engage in projects they were passionate about. The course starts by asking students to share potential projects with one another and then self-organize around projects they are interested in. The course centers around the project, with each module sharing valuable information that parallels the progression of the project. Through text, video, and activities, students develop their projects into tangible resources or actionable plans.
Module 2 Overview
First, some explanation of how we should think about design throughout this course. These theories and definitions are based on the many courses I've taught and taken on design theory and design ethics.
Embedded within every human fabricated object within our world is an instantiation of a series of choices, intentions, and valuations; alongside acknowledgments of needs, desires, and expectations. What we refer to as technological design is really shorthand for a rich and varied set of material conditions within a complex and varied set of social and physical arrangements... between objects, people, and their environments.
Project design, as will be understood and used in this course, encompasses the processes and theories of intentionally intervening within these material conditions and socio-environmental arrangements, the understanding of which is crucial to implementing sustainable energy systems. That these instantiated processes and theories (within designs) impact the world as we live it, requires us to acknowledge that designs have consequences, and that different designs have different consequences and outcomes to different stakeholders.
That design choices impact human lives and that different choices impact lives differently, requires us to further acknowledge that there are ethical dimensions to how we approach design, and that values made during the design process become permanently embedded in the artifacts and arrangements themselves. Addressing these conditions in the development and implementation of a design is key to producing projects that are both relevant to the contemporary as well as long-term stakeholders, i.e., sustainable design.
In sum, I want you to think about what you will eventually design as a sustainable system, and not just a collection of technically sufficient devices. You should be thinking about the social arrangements required to sustain the design, as well as material stocks and flows. Achieving "design lock-in" will be a collective process of coming to agreement within your teams, and will not (should not) be the product of a single team member or stakeholder.
Overall, Module 2 will cover the initial phases of project design based on stakeholder engagements and how to refine and agree upon a project design within a team setting.
Learning Objectives
- Designing a project design
- Working with and from stakeholder engagement
- Refining a design based on ongoing feedback
- Agreeing upon a project design
Activities
- Gathering Initial stakeholder findings/needs/requirements/constraints
- Agreeing on a project problem for design intervention
- Creating a plan that matches with the team strengths/individual
Getting Into Group Projects
As your instructor, I have to say, this is probably one of the hardest parts of the course to co-ordinate at the outset. There are many options... should we choose arbitrary projects, select groups at random, and go from there? Or should the instructor let you form groups ad hoc and according to interests? This project is different from all of your independent RESS projects, and the formation of the groups is important to success.
My hope is that about 50-70% of you already have a sense of the groups with which you want to work, and we can figure out a good fit for the rest. My fear is that 20-50% of you still have no inclination towards one project or another. Again, these are supposed to be GROUP projects... and not individually directed or driven.
Let me say that working with a group this semester is particularly important if you want to get into consulting. You need to know how to work dynamically with groups... and single technology projects may not be the only thing about which you are asked to consult. As well, understanding the integration of "stand-alone energy projects" with other energy systems is also a significant outcome we want our graduates to have in their toolbox. (Ultimately, if you are looking to have a good example of a project for your portfolio, you will benefit most from working within a group of your peers.)
Ok, that is a lot of caveats. Following this is a Discussion Forum that you should complete by Thursday of this week, where you do your best to form into groups based on your interests and areas of expertise. Groups are to be a minimum of 3 and a maximum of 6 participants. (Exceptions can be made if you send me an email explaining otherwise.) As well, and this is very important, attempt to achieve a balance between skillsets... your group should have roughly 50/50 renewable energy and sustainability management expertise.
For anyone not aligned with a group project by the end of Thursday this week, I will review skillsets and interests to assign you to a group by the weekend.
Ok, let's get going!
Scope of Project Requirements
For your consideration: In thinking about a project you proposed or one you consider joining, be sure to review the overall criteria for defining the scope of the project, as follows.
Overall Goal: The overall goal of your class project is to deliver a reliable, team built analysis and detailed design of a RESS project. The RESS project should focus on a combination of Solar Energy, Wind Energy, Sustainability Management and Policy, Bioenergy, or at least cover a number of these applications.
Project Scale: The class project will consist of a semester-long effort of a team of graduating from RESS students, carrying out the following phases of effort: project definition, preliminary design, technology selection and detailed design, and presentation followed by evaluation. Deliverables from the project will include a project design prospectus for the client, accompanied by appendices of technical calculations and supporting documents (evidence), and an oral presentation overview of project findings. Project efforts will include regular project team meetings, interactions with stakeholders, and consultation with your instructor.
Project Objectives: The objectives of the class project are to:
- demonstrate students’ ability to conceive and develop a RESS project concept at a professional and rigorous level of detail,
- demonstrate students’ ability to clearly and professionally communicate the results of their analysis, and
- synthesize the subjects learned in the RESS Master’s curriculum, resulting in a single, cohesive expression of the student’s understanding of Renewable Energy and Sustainability Systems.
Measures of Success: The class project will be considered successful to the degree that it answers the following questions:
- How well was the project defined, and did the project fit to its intended scope?
- How effectively did the project team interact with stakeholders and incorporate feedback?
- How technically accurate were the analyses and designs of the project?
- How insightfully did the project team analyze and reflect upon the project as they developed their design and selected their technology?
- How well did the project team work together and/or address challenges within the group structure?
- How well was the project communicated in the oral and written design reports?
These measures of success will be reflected in the final grade assigned to the student using the grading scale listed on the course syllabus.
The above is a statement of scope for your class project. Similarly, you will need to work with your project team to develop a project definition for your proposed RESS project, that follows a similar format to the list above. Note that we don’t include this as an explicit assignment that you must turn in at this point. However, we do expect that your project plan/scope will be included in your final project. Also, your project advisor may request that you submit it for review.
A Few Notes...
Do not “pre-select” your technology in the project definition. Leave room for comparing competing technologies and approaches. Also, try to come up with measures of success that are quantifiable whenever possible. Even in the case of difficult “nonphysical” parameters, you can often come up with a quantifiable metric if you are creative.
What are the Strengths you can bring to a Group?
Before Choosing:
Before choosing a group with which you want to participate, even if you want to follow your own proposal, you need to consider what strengths you bring to the table. (Don't focus on your weaknesses... it's a waste of time, and you don't choose projects and passions based on your weaknesses.) And, ultimately, does the project seem to you to be locally grounded and realistically achievable?
Consider your Strengths:
- What kind of project do you want to work on?
- What is your area of RESS expertise and program specialization?
- Do your area(s) of expertise compliment any project specifically?
- What is your current job context, and how can a project either extend from or address specific needs for this context?
- What is your area of expertise and major strength in the RESS portfolio?
- Is this an area of expertise in which you want to get stronger, or are you looking to transition?
- Do you have policy experience/expertise within a given project scope?
- Do you have technical experience/expertise for a specific project?
- Are you more interested in designing for a specific technological solution or for a specific sustainability goal?
Other considerations:
- Does the context of the project fall within a reasonable scope of being able to be changed?
- Does the project seem technically feasible, considering current technologies?
- Can the project connect with enough stakeholders for meaningful interactions?
- Does the project have a chance of being measurable in terms of sustainability?
- Does the project seem reasonably affordable for the client?
Main question for you:
Is there a project that would work to help you achieve some or all of these goals?
Stakeholders and Team Engagement
Stakeholder interaction is an oft underappreciated aspect of successful project management that must be actively addressed if a project is to achieve its full potential. As (soon to be) RESS graduates, you are expected to be able to conceive and develop technically outstanding projects, but you must also be able to develop projects that succeed within their governmental, social, and cultural context. Stakeholder interaction is a key component to making that happen.
The purpose of working through the following Lynda.com lessons is to remind you how project managers works with potential and enrolled stakeholders. These tutorials are geared more towards how businesses and enterprise in general comprehend stakeholder relationships. What these video tutorials do not address is how we must further push our thinking about stakeholder engagement as a fundamental aspect of sustainability and sustainable systems. You have encountered issues concerning sustainability and stakeholders in numerous RESS courses and their lessons (from BIOET 533, EME 504, EME 805, EME 803, and others), and you are expected to approach stakeholder engagement aligned with those broader perspectives.
Why Work With Stakeholders?
This is a fair question. If people are not actually doing the work, why should they be involved? Here are a few good reasons; perhaps you can think of others as well:
- Stakeholder involvement may be required. Bosses and investors are especially desirous of appropriate updates and interactions relating to a project.
- Stakeholders can provide you with access to data and resources that would not normally be available.
- Stakeholders can support your project financially or otherwise. While financial support is obviously critical, non-monetary community support can also be very important, since the opposite (community opposition) can be detrimental to the project, especially if opposition is based on misunderstanding of the project.
- Stakeholders can ensure long term project success. Often, your role in project development will only be a small piece of the total success of the project, and often stakeholders for your project will be the active participants in complementary activities that will be critical to long term success. Consider, for example, the development of “E85 Flex-Fuel” vehicles in the United States. Without the support of ethanol producers, distributors, and retailers, the development of Flex Fuel vehicles will not be successful, even though those entities are not directly involved in designing or manufacturing the vehicles.
Building sustainable cities - and a sustainable future - will need open dialogue among all branches of national, regional and local government. And it will need the engagement of all stakeholders - including the private sector and civil society, and especially the poor and marginalized.
~ Ban Ki Moon, UN Secretary-General
How to Effectively Work With Stakeholders
The key to effective stakeholder engagement is creation and implementation of a Stakeholder Interaction Plan. While some people and groups carry out stakeholder interaction plans on an informal basis, it is best to explicitly create a written plan to that can be reviewed and revised, thus ensuring that key groups or activities are not excluded. Every stakeholder interaction plan should include, at a minimum, the following elements:
- List of Stakeholders - list, characterize, and prioritize the stakeholders for your project.
- Objectives - describe exactly what you hope to accomplish with stakeholder interaction (try to be specific-use measurable goals if possible). Consider not only what you hope to gain from the interaction, but also what the stakeholders hope to gain.
- Methods - describe how you plan to communicate with and engage your stakeholders, and when this will occur, relative to the overall project schedule.
- Feedback - Explain how you will receive feedback from stakeholders, how you will incorporate their feedback into the project, and how you will assess whether or not your objectives have been met.
Tutorial 1: Stakeholder management for Project Managers
Tutorial 2: Managing Project Stakeholders
Module 2 Activities
Deliverables
Developing a coherent project plan with three components
- Project Checklist
- Stakeholder Analysis Plan
- Stakeholder Management Plan
Video Tutorials
Exercise Files
Discussion
Participate in the Developing Cohesiveness and Trust discussion at the beginning of the module period.
How to get the most from stakeholder engagement.
Project Milestones
Remember to create your project definition statement and definition of team roles.
Create a stakeholder interaction plan for your project. This document will be created by your project group and submitted by your group leader. The process should include a brainstorming/discussion session, drafting of the plan, and reviewing/revising of the plan before it is submitted. The plan should be submitted in written form, and be of professional quality.
Programming Course

What is a Programming course?
A Programming course provides the setting for students to gain "hands-on" experience with a programming language.
What are the affordances of this model?
A well-designed programming course can offer students practice with programming and interaction with instructors and other students in a supportive setting that builds community and breeds success.
Things to pay attention to:
One of the best ways to learn coding is to practice a lot! Our courses are designed to allow plenty of practice, guidance, and a chance to discuss issues and questions with the instructor and with other students. The use of a tool called syntax highlighter allows students to see code represented authentically and accurately on the course pages, and the inclusion of the program Datacamp, in some of our courses, gives students the chance to try practice problems at the moment a concept is presented.
We look forward to working with you!
Contact us directly or visit the Dutton Website to learn more!
Introduction to GEOG 485
Welcome to GEOG 485: GIS Programming and Software Development!
GEOG 485 is an introductory programming course developed by experts in the Python coding language. The course focuses on programming as used to automate GIS software to solve problems.
The developers of GEOG 485 designed this course to include lots of practice for students and to provide a communicative learning community so that students could help each other.
The following pages are from a lesson, but the lesson in total is not replicated here. The lesson contains clear objectives, plenty of practice, guidance, and a chance to discuss issues and questions with the instructor and with other students. There is an aligned assessment in the form of a quiz. Notice the use of syntax highlighter, which allows students to see code represented authentically and accurately on the course pages. Also, notice that students are offered a chance for further, extra practice at the end of the lesson.
Lesson 2: Python and programming basics
Overview
This lesson has a relatively large amount of reading from the course materials, the Zandbergen text, and the ArcGIS help. I believe you will get a better understanding of the Python concepts as they are explained and demonstrated from several different perspectives. Whenever the examples use the IPython console, I strongly suggest that you type in the code yourself as you follow the examples. This can take some time, but you'll be amazed at how much more information you retain if you try the examples yourself instead of just reading them.
At the end of the lesson, you'll be required to write a Python script that puts together many of the things you've learned. This will go much faster if you've taken the time to read all the required text and work through the examples.
Lesson 2 covers Python fundamentals (many of which are common to other programming languages) and gives you a chance to practice these in a project. To complete this lesson, you are required to do the following:
- Download the Lesson 2 data and extract it to C:\PSU\Geog485\Lesson2.
- Work through the online sections of the lesson.
- Read the remainder of Zandbergen chapters 4-6 that we didn't cover in Lesson 1 and chapter 7.1 - 7.5, and 7.11 (in the Python 3 version of the book) or 11.1 - 11.5 and 11.11 (in the Python 2 version of the book). In the online lesson pages, I have inserted instructions about when it is most appropriate to read each of these chapters. There is more reading this lesson than in a typical week. If you are new to Python, please plan some extra time to read these chapters. There are also some readings this week from the ArcGIS Help.
- Complete Project 2 and upload its deliverables to the Lesson 2 drop box. The deliverables are listed in the Project 2 description page.
- Complete the Lesson 2 Quiz.
Do items 1 - 3 (including any of the practice exercises you want to attempt) during the first week of the lesson. You will need the second week to concentrate on the project and quiz.
Lesson objectives
By the end of this lesson, you should:
- understand basic Python syntax for conditional statements and program flow control (if-else, comparison operators, for loop, while loop);
- be familiar with more advanced data types (strings, lists), string manipulation, and casting between different types;
- know how to debug code and how to use the debugger;
- be able to program basic scripts that use conditional statements and loops to automate tasks.
Lesson 2 Quiz
Lists
In Lesson 1, you learned about some common data types in Python, such as strings and integers. Sometimes you need a type that can store multiple related values together. Python offers several ways of doing this, and the first one we'll learn about is the list.
Here's a simple example of a list. You can type this in the Spyder IPython console to follow along:
In [1]: suits = ['Spades', 'Clubs', 'Diamonds', 'Hearts']
This list named 'suits' stores four related string values representing the suits in a deck of cards. In many programming languages, storing a group of objects in sequence like this is done with arrays. While the Python list could be thought of as an array, it's a little more flexible than the typical array in other programming languages. This is because you're allowed to put multiple data types into one list.
For example, suppose we wanted to make a list for the card values you could draw. The list might look like this:
In [2]: values = ['Ace', 2, 3, 4, 5, 6, 7, 8, 9, 10, 'Jack', 'Queen', 'King']
Notice that you just mixed string and integer values in the list. Python doesn't care. However, each item in the list still has an index, meaning an integer that denotes each item's place in the list. The list starts with index 0 and for each item in the list, the index increments by one. Try this:
In [3]: print (suits[0])
Spades
In [4]: print (values[12])
King
In the above lines, you just requested the item with index 0 in the suits list and got 'Spades'. Similarly, you requested the item with index 12 in the values list and got 'King'.
It may take some practice initially to remember that your lists start with a 0 index. Testing your scripts can help you avoid off-by-one errors that might result from forgetting that lists are zero-indexed. For example, you might set up a script to draw 100 random cards and print the values. If none of them is an Ace, you've probably stacked the deck against yourself by making the indices begin at 1.
Remember you learned that everything is an object in Python? That applies to lists too. In fact, lists have a lot of useful methods that you can use to change the order of the items, insert items, sort the list, and so on. Try this:
In [5]: suits = ['Spades', 'Clubs', 'Diamonds', 'Hearts']
In [6]: suits.sort()
In [7]: print (suits)
['Clubs', 'Diamonds', 'Hearts', 'Spades']
Notice that the items in the list are now in alphabetical order. The sort() method allowed you to do something in one line of code that would have otherwise taken many lines. Another helpful method like this is reverse(), which allows you to sort a list in reverse alphabetical order:
In [8]: suits.reverse()
In [9]: print (suits)
['Spades', 'Hearts', 'Diamonds', 'Clubs']
Before you attempt to write list-manipulation code, check your textbook or the Python list reference documentation to see if there's an existing method that might simplify your work.
Inserting items and combining lists
What happens when you want to combine two lists? Type this in the Spyder console:
In [10]: listOne = [101,102,103]
In [11]: listTwo = [104,105,106]
In [12]: listThree = listOne + listTwo
In [13]: print (listThree)
[101, 102, 103, 104, 105, 106]
Notice that you did not get [205,207,209]; rather, Python treats the addition as appending listTwo to listOne. Next, try these other ways of adding items to the list:
In [14]: listThree += [107]
In [15]: print (listThree)
[101, 102, 103, 104, 105, 106, 107]
In [16]: listThree.append(108)
In [17]: print (listThree)
[101, 102, 103, 104, 105, 106, 107, 108]
To put an item at the end of the list, you can either add a one-item list (how we added 107 to the list) or use the append() method on the list (how we added 108 to the list). Notice that listThree += [107] is a shortened form of saying listThree = listThree + [107].
If you need to insert some items in the middle of the list, you can use the insert() method:
In [18]: listThree.insert(4, 999)
In [19]: print (listThree)
[101, 102, 103, 104, 999, 105, 106, 107, 108]
Notice that the insert() method above took two parameters. You might have even noticed a tooltip that shows you what the parameters mean.
The first parameter is the index position that the new item will take. This method call inserts 999 between 104 and 105. Now 999 is at index 4.
Getting the length of a list
Sometimes you'll need to find out how many items are in a list, particularly when looping. Here's how you can get the length of a list:
In [20]: myList = [4,9,12,3,56,133,27,3]
In [21]: print (len(myList))
8
Notice that len() gives you the exact number of items in the list. To get the index of the final item, you would need to use len(myList) - 1. Again, this distinction can lead to off-by-one errors if you're not careful.
Other ways to store collections of data
Lists are not the only way to store ordered collections of items in Python; you can also use tuples and dictionaries. Tuples are like lists, but you can't change the objects inside a tuple over time. In some cases, a tuple might actually be a better structure for storing values like the suits in a deck of cards, because this is a fixed list that you wouldn't want your program to change by accident.
Dictionaries differ from lists in that items are not indexed; instead, each item is stored with a key value which can be used to retrieve the item. We'll use dictionaries later in the course, and your reading assignment for this lesson covers dictionary basics. The best way to understand how dictionaries work is to play with some of the textbook examples in the Spyder console (see Zandbergen 6.8).
String Manipulation
You've previously learned how the string variable can contain numbers and letters and represent almost anything. When using Python with ArcGIS, strings can be useful for storing paths to data and printing messages to the user. There are also some geoprocessing tool parameters that you'll need to supply with strings.
Python has some very useful string manipulation abilities. We won't get into all of them in this course, but following are a few techniques that you need to know.
Concatenating strings
To concatenate two strings means to append or add one string on to the end of another. For example, you could concatenate the strings "Python is " and "a scripting language" to make the complete sentence "Python is a scripting language." Since you are adding one string to another, it's intuitive that in Python you can use the + sign to concatenate strings.
You may need to concatenate strings when working with path names. Sometimes it's helpful or required to store one string representing the folder or geodatabase from which you're pulling datasets and a second string representing the dataset itself. You put both together to make a full path.
The following example, modified from one in the ArcGIS Help, demonstrates this concept. Suppose you already have a list of strings representing feature classes that you want to clip. The list is represented by "featureClassList" in this script:
# This script clips all datasets in a folder
import arcpy

inFolder = "c:\\data\\inputShapefiles\\"
resultsFolder = "c:\\data\\results\\"
clipFeature = "c:\\data\\states\\Nebraska.shp"

# List feature classes
arcpy.env.workspace = inFolder
featureClassList = arcpy.ListFeatureClasses()

# Loop through each feature class and clip
for featureClass in featureClassList:

    # Make the output path by concatenating strings
    outputPath = resultsFolder + featureClass
    # Clip the feature class
    arcpy.Clip_analysis(featureClass, clipFeature, outputPath)
String concatenation is occurring in this line: outputPath = resultsFolder + featureClass. In longhand, the output folder "c:\\data\\results\\" is getting the feature class name added on the end. If the feature class name were "Roads.shp" the resulting output string would be "c:\\data\\results\\Roads.shp".
The above example shows that string concatenation can be useful in looping. Constructing the output path by using a set workspace or folder name followed by a feature class name from a list gives much more flexibility than trying to create output path strings for each dataset individually. You may not know how many feature classes are in the list or what their names are. You can get around that if you construct the output paths on the fly through string concatenation.
Casting to a string
Sometimes in programming, you have a variable of one type that needs to be treated as another type. For example, 5 can be represented as a number or as a string. Python can only perform math on 5 if it is treated as a number, and it can only concatenate 5 onto an existing string if it is treated as a string.
Casting is a way of forcing your program to think of a variable as a different type. Create a new script in Spyder, and type or paste the following code:
x = 0
while x < 10:
    print (x)
    x += 1

print ("You ran the loop " + x + " times.")
Now, try to run it. The script attempts to concatenate strings with the variable x to print how many times you ran a loop, but it results in an error: "TypeError: must be str not int." Python doesn't have a problem when you want to print the variable x on its own, but Python cannot mix strings and integer variables in a printed statement. To get the code to work, you have to cast the variable x to a string when you try to print it.
x = 0
while x < 10:
    print (x)
    x += 1

print ("You ran the loop " + str(x) + " times.")
You can force Python to think of x as a string by using str(x). Python has other casting functions such as int() and float() that you can use if you need to go from a string to a number. Use int() for integers and float() for decimals.
Readings
It's time to take a break and do some readings from another source. If you are new to Python scripting, this will help you see the concepts from a second angle.
Finish reading Zandbergen chapters 4 - 6 as detailed below. This can take a few hours, but it will save you hours of time if you make sure you understand this material now.
ArcGIS Pro edition:
- Chapter 4 covers the basics of Python syntax, loops, strings, and other things we just learned. Please read Chapter 4, noting the following:
- You were already assigned 4.1-4.7 in Lesson 1, so you may skip those sections if you have a good handle on those topics.
- You may also skip 4.17-4.18, and 4.26.
- Section 4.25 demonstrates use of the input() function, using the IDLE and PyCharm IDEs. IDEs vary in their implementation of the type() function. In Spyder, the user is expected to enter a value in the Spyder Console.
- Another way of providing input to a script in Spyder is by going to Run > Configuration per file, checking the Command line options box, entering the arguments in the box that appears, then clicking Run. - You've already read most of Chapter 5 on geoprocessing with arcpy. Now please read 5.10 & 5.14.
- Chapter 6 gives some specific instructions about working with ArcGIS datasets, which will be valuable during this week's assigned project. Please read all sections, 6.1-6.7.
ArcMap edition:
- Chapter 4 covers the basics of Python syntax, loops, strings, and other things we just learned. Please read Chapter 4, noting the following:
- You were already assigned 4.1-4.7 in Lesson 1, so you may skip those sections if you have a good handle on those topics.
- Section 4.18 discusses getting user input via the Run Script dialog that appears when running a script in PythonWin. Supplying arguments in Spyder can be done by going to Run > Configuration per file, checking the Command line options box, entering the arguments in the box that appears, then clicking Run.
- Section 4.18 also demonstrates use of the input() function, showing that it causes PythonWin to display a dialog box for the user to input a value. In contrast, Spyder shows no such dialog box; instead, it expects the user to enter a value in the Spyder Console.
- You may also skip 4.20, since we're not using the PythonWin editor discussed in that section. - You've already read most of Chapter 5 on geoprocessing with arcpy. Now please read 5.7 and 5.12, noting the following:
- The discussion of how to access Help documentation in 5.12 does not apply to Pro. However, the documentation pages themselves show essentially the same information. Pro documentation is offered only online. To access the documentation of an arcpy function or tool, you can enter its name in the Search box at the top of the Help system or click on the ? icon that appears in the upper right of every tool dialog when opened in Pro. - Chapter 6 gives some specific instructions about working with ArcGIS datasets, which will be valuable during this week's assigned project. You shouldn't encounter any ArcMap/ArcGIS Pro confusion in this chapter. Please read all sections, 6.1-6.8.
If you still don't feel like you understand the material after reading the above chapters, don't re-read it just yet. Try some coding from the Lesson 2 practice exercises and assignments, then come back and re-read if necessary. If you are really struggling with a particular concept, type the examples in the console. Programming is like a sport in the sense that you cannot learn all about it by reading; at some point, you have to get up and do it.
Troubleshooting and getting help
If you find writing code to be a slow, mystifying, and painstaking process, fraught with all kinds of opportunities to make mistakes, welcome to the world of a programmer! Perhaps to their chagrin, programmers spend the majority of their time hunting down and fixing bugs. Programmers also have to continually expand and adapt their skills to work with new languages and technologies, which requires research, practice, and lots of trial and error.
The best candidates for software engineering jobs are not the ones who list the most languages or acronyms on their resumes. Instead, the most desirable candidates are self-sufficient, meaning they know how to learn new things and find answers to problems on their own. This doesn't mean that they never ask for help; on the contrary, a good programmer knows when to stop banging his or her head against the wall and consult peers or a supervisor for advice. However, most everyday problems can be solved using the help documentation, online code examples, online forums, existing code that works, programming books, and debugging tools in the software.
Suppose you're in a job interview and your prospective employer asks, "What do you do when you run into a 'brick wall' when programming? What sources do you first go to for help?" If you answer, "My supervisor" or "My co-workers," this is a red flag, signifying that you could be a potential time sink to the development team. Although the more difficult problems require group collaboration, a competitive software development team cannot afford to hold an employee's hand through every issue that he or she encounters. From the author's experience, many of the most compelling candidates answer this question, "Google." They know that most programming problems, although vexing, are common and the answer may be at their fingertips in less than 30 seconds through a well-phrased Internet search. With popular online forums such as Stack Exchange providing answers to many common syntax and structuring questions, searching for information online can actually be faster than walking down the hall and asking a co-worker, and it saves everybody time.
In this section of the lesson, you'll learn about places where you can go for help when working with Python and when programming in general. You will have a much easier experience in this course if you remember these resources and use them as you complete your assignments.
Other sources of help
Besides the above approaches, there are many other places you can get help. A few of them are described below. If you're new to programming, just knowing that these resources exist and how to use them can help you feel more confident. Find the ones that you prefer and return to them often. This habit will help you become a self-sufficient programmer and will improve your potential to learn any new programming language or technology.
Drawing on the resources below takes time and effort. Many people don't like combing through computer documentation, and this is understandable. However, you may ultimately save time if you look up the answer for yourself instead of waiting for someone to help you. Even better, you will have learned something new from your own experience, and things you learn this way are much easier to remember in the future.
Sources of help
Search engines
Search engines are useful for both quick answers and obscure problems. Did you forget the syntax for a loop? The quickest remedy may be to Google "for loop python" or "while loop python" and examine one of the many code examples returned. Search engines are extremely useful for diagnosing error messages. Google the error message in quotes, and you can read experiences from others who have had the same issue. If you don't get enough hits, remove the quotes to broaden the search.
One risk you run from online searches is finding irrelevant information. Even more dangerous is using irrelevant information. Research any sample code to make sure it is applicable to the version of Python you're using. Some syntax in Python 3.x, used for scripting in ArcGIS Pro, is different from the Python 2.x used for scripting in ArcMap, for example.
Esri online help
Esri maintains their entire help system online, and you'll find most of their scripting topics in the arcpy section.
Another section, which you should visit repeatedly, is the Tool Reference, which describes every tool in the toolbox and contains Python scripting examples for each. If you're having trouble understanding what parameters go in or out of a tool, or if you're getting an error back from the geoprocessing framework itself, try the Tool Reference before you do a random Internet search. You will have to visit the Tool Reference in order to be successful in some of the course projects and quizzes.
Python online help
The official Python documentation is available online. Some of it gets very detailed and takes the tone of being written by programmers for programmers. The part you'll probably find most helpful is the Python Standard Library reference, which is a good place to learn about Python's modules such as "os", "csv", "math," or "random."
Printed books, including your textbook
Programming books can be very hit or miss. Many books are written for people who have already programmed in other languages. Others proclaim they're aimed at beginners, but the writing or design of the book may be unintuitive or difficult to digest. Before you drop $40 on a book, try to skim through it yourself to see if the writing generally makes sense to you (don't worry about not understanding the code--that will come along as you work through the book).
The course text Python Scripting for ArcGIS is a generally well-written introduction to just what the title says: working with ArcGIS using Python. There are a few other Python+ArcGIS books as well. If you've struggled with the material, or if you want to do a lot of scripting in the future, I may recommend picking up one of these. Your textbook can come in handy if you need to look at a very basic code example, or if you're going to use a certain type of code construct for the first time, and you want to review the basics before you write anything.
A good general Python reference is Learning Python by Mark Lutz. We previously used this text in Geog 485 before there was a book about scripting with ArcGIS. It covers beginning to advanced topics, so don't worry if some parts of it look intimidating.
Esri forums and other online forums
The Esri forums are a place where you can pose your question to other Esri software users, or read about issues other users have encountered that may be similar to yours. There is a Python Esri forum that relates to scripting with ArcGIS, and also a more general Geoprocessing Esri forum you might find useful.
Before you post a question on the Esri forums, do a little research to make sure the question hasn't been answered already, at least recently. I also suggest that you post the question to our class forums first, since your peers are working on the same problems, and you are more likely to find someone who's familiar with your situation and has found a solution.
There are many other online forums that address GIS or programming questions. You'll see them all over the Internet if you perform a Google search on how to do something in Python. Some of these sites are laden with annoying banner ads or require logins, while others are more immediately helpful. Stack Exchange is an example of a well-traveled technical forum, light on ads, that allows readers to promote or demote answers depending on their helpfulness. One of its child sites, GIS Stack Exchange, specifically addresses GIS and cartography issues.
If you do post to online forums, be sure to provide detailed information on the problem and list what you've tried already. Avoid posts such as "Here's some code that's broken and I don't know why" followed by dozens of lines of pasted-in code. State the problem in a general sense and focus on the problem code. Include exact error messages when possible.
People on online forums are generally helpful, but expect a hostile reception if you make them feel like they are doing your academic homework for you. Also, be aware that posting or copying extensive sections of Geog 485 assignment code on the internet is a violation of academic integrity and may result in a penalty applied to your grade (see section on Academic Integrity in the course syllabus).
Class forums
Our course has discussion boards that we recommend you used to consult your peers and instructor about any Python problem that you encounter. I encourage you to check them often and to participate by both asking and answering questions. I request that you make your questions focused and avoid pasting large blocks of code that would rob someone of the benefit of completing the assignment on their own. Short, focused blocks of code that solve a specific question are definitely okay. Code blocks that are not copied directly from your assignment are also okay.
I monitor all discussion boards closely; however, sometimes I may not respond immediately because I want to give you a chance to help each other and work through problems together. If you post a question and wind up solving your own problem, please post again to let us know and include how you managed to solve the problem in case other students run into the same issue.
Consulting the instructor
I am available to help you at any point in the course, and my goal is to respond to any personal message or e-mail within 24 hours on weekdays (notice the obvious problem if you have waited to begin your assignment until 24 hours before it's due!). I am happy to consult with you through e-mail, video conference, or whatever technology is necessary to help you be successful.
I ask that you try some of the many troubleshooting and help resources above before you contact me. If the issue is with your code and I cannot immediately see the problem, the resources we will use to find the answer will be the same that I listed above: the debugger, printing geoprocessing messages, looking for online code examples, etc. If you feel unsure about what you're doing, I'm available to talk through these approaches with you. Also, in cases where you feel that you cannot post a description of the problem without including a lot of code that may give away part of the solution to an assignment, feel free to send your code and problem description directly to me via Canvas mail.
Practice exercises
Before trying to tackle Project 2, you may want to try some simple practice exercises, particularly if the concepts in this lesson were new to you. Remember to choose File > New in Spyder to create a new script (or click the empty page icon). You can name the scripts something like Practice1, Practice2, etc.
Find the spaces in a list of names
Python String objects have an index method that enables you to find a substring within the larger string. For example, if I had a variable defined as name = "James Franklin" and followed that up with the expression name.index("Fr"), it would return the value 6 because the substring "Fr" begins at character 6 in the string held in name. (The first character in a string is at position 0.)
For this practice exercise, start by creating a list of names like the following:
beatles = ["John Lennon", "Paul McCartney", "Ringo Starr", "George Harrison"]
Then write code that will loop through all the items in the list, printing a message like the following:
"There is a space in ________'s name at character ____." where the first blank is filled in with the name currently being processed by the loop and the second blank is filled in with the position of the first space in the name as returned by the index method. (You should obtain values of 4, 4, 5 and 6, respectively, for the items in the list above.)
This is a good example in which it is smart to write and test versions of the script that incrementally build toward the desired result, rather than trying to write the final version in one fell swoop. For example, you might start by setting up a loop and simply printing each name. If you get that to work, give yourself a little pat on the back and then see if you can simply print the positions of the space. Once you get that working, then try plugging the name and space positions into the larger message.
Practice 1 Solution
Convert the names to a "Last, First" format
Build on Exercise 1 by printing each name in the list in the following format:
Last, First
To do this, you'll need to find the position of the space just as before. To extract part of a string, you can specify the start character and the end character in brackets after the string's name, as in the following:
name = "James Franklin"
print (name[6:14])  # prints Franklin
One quirky thing about this syntax is that you need to specify the end character as 1 beyond the one you really want. The final "n" in "Franklin" is really at position 13, but I needed to specify a value of 14.
One handy feature of the syntax is that you may omit the end character index if you want everything after the start character. Thus, name[6:] will return the same string as name[6:14] in this example. Likewise, the start character may be omitted to obtain everything from the beginning of the string to the specified end character.
Practice 2 Solution
Convert scores to letter grades
Write a script that accepts a score from 1-100 as an input parameter, then reports the letter grade for that score. Assign letter grades as follows:
A: 90-100
B: 80-89
C: 70-79
D: 60-69
F: <60
Practice 3 Solution
Create copies of a template shapefile
Imagine that you're again working with the Nebraska precipitation data from Lesson 1 and that you want to create copies of the Precip2008Readings shapefile for the next 4 years after 2008 (e.g., Precip2009Readings, Precip2010Readings, etc.). Essentially, you want to copy the attribute schema of the 2008 shapefile, but not the data points themselves. Those will be added later. The tool for automating this kind of operation is the Create Feature Class tool in the Data Management toolbox. Look up this tool in the Help system and examine its syntax and the example script. Note the optional template parameter, which allows you to specify a feature class whose attribute schema you want to copy. Also note that Esri uses some inconsistent casing with this tool, and you will have to call arcpy.CreateFeatureclass_management() using a lower-case "c" on "class." If you follow the examples in the Geoprocessing Tool Reference help, you will be fine.
To complete this exercise, you should invoke the Create Feature Class tool inside a loop that will cause the tool to be run once for each desired year. The range(...) function can be used to produce the list of years for your loop.
Practice 4 Solution
Clip all feature classes in a geodatabase
The data for this practice exercise consists of two file geodatabases: one for the USA and one for just the state of Iowa. The USA dataset contains miscellaneous feature classes. The Iowa file geodatabase is empty except for an Iowa state boundary feature class.
Your task is to write a script that programmatically clips all the feature classes in the USA geodatabase to the Iowa state boundary. The clipped feature classes should be written to the Iowa geodatabase. Append "Iowa" to the beginning of all the clipped feature class names.
Your script should be flexible enough that it could handle any number of feature classes in the USA geodatabase. For example, if there were 15 feature classes in the USA geodatabase instead of three, your final code should not need to change in any way.
Practice 5 Solution
Project: Batch reprojection tool for vector datasets
Some GIS departments have determined a single, standard projection in which to maintain their source data. The raw datasets, however, can be obtained from third parties in other projections. These datasets then need to be reprojected into the department's standard projection. Batch reprojection, or the reprojection of many datasets at once, is a task well suited to scripting.
In this project, you'll practice Python fundamentals by writing a script that re-projects the vector datasets in a folder. From this script, you will then create a script tool that can easily be shared with others.
The tool you will write should look like the image below. It has two input parameters and no output parameters. The two input parameters are:
- A folder on disk containing vector datasets to be re-projected.
- The path to a vector dataset whose spatial reference will be used in the re-projection. For example, if you want to re-project into NAD 1983 UTM Zone 10, you would browse to some vector dataset already in NAD 1983 UTM Zone 10. This could be one of the datasets in the folder you supplied in the first parameter, or it could exist elsewhere on disk.
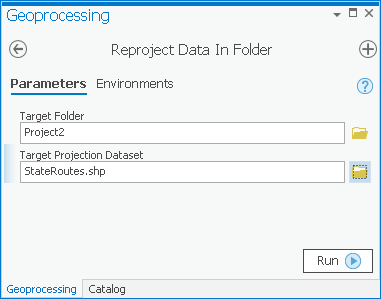 Figure 2.1 The Project 2 tool with two input parameters and no output parameters.Credit: The Python Programming Language
Running the tool causes re-projected datasets to be placed on disk in the target folder.
Requirements
To receive full credit, your script:
- must re-project shapefile vector datasets in the folder to match the target dataset's projection;
- must append "_projected" to the end of each projected dataset name. For example: CityBoundaries_projected.shp;
- must skip projecting any datasets that are already in the target projection;
- must report a geoprocessing message telling which datasets were projected. In this message, the dataset names can be separated by spaces. In the message, do not include datasets that were skipped because they were already in the target projection. This must be a single message, not one message per projected dataset. Notice an example of this type of custom message below in the line "Projected . . . :"
 Figure 2.2 Your script must report a geoprocessing message telling which datasets were projected.Credit: The Python Programming Language
 - Must not contain any hard-coded values such as dataset names, path names, or projection names.
- Must be made available as a script tool that can be easily run from ArcGIS Pro by someone with no knowledge of scripting.
Successful completion of the above requirements is sufficient to earn 90% of the credit on this project. The remaining 10% is reserved for "over and above" efforts which could include, but are not limited to, the following:
- Your geoprocessing message of projected datasets contains commas between the dataset names, with no extra "trailing" comma at the end.
- User help is provided for your script tool. This means that when you open the tool dialog and hover the mouse over the "i" icon next to each parameter, help appears in a popup box. The ArcGIS Pro Help can teach you how to do this.
You are not required to handle datum transformations in this script. It is assumed that each dataset in the folder uses the same datum, although the datasets may be in different projections. Handling transformations would cause you to have to add an additional parameter in the Project tool and would make your script more complicated than you would probably like for this assignment.
Sample data
The Lesson 2 data folder contains a set of vector shapefiles for you to work with when completing this project (delete any subfolders in your Lesson 2 data folder—you may have one called PracticeData—before beginning this project). These shapefiles were obtained from the Washington State Department of Transportation GeoData Distribution Catalog, and they represent various geographic features around Washington state. For the purpose of this project, I have put these datasets in various projections. These projections share the same datum (NAD 83) so that you do not have to deal with datum transformations.
The datasets and their original projections are:
- CityBoundaries and StateRoutes - NAD_1983_StatePlane_Washington_South_FIPS_4602
- CountyLines - NAD_1983_UTM_Zone_10N
- Ferries - USA_Contiguous_Lambert_Conformal_Conic
- PopulatedPlaces - GCS_NorthAmerican_1983
Deliverables
Deliverables for this project are as follows:
- the source .py file containing your script;
- the .tbx file containing your script tool;
- a short writeup (about 300 words) describing how you approached the project, how you successfully dealt with any roadblocks, and what you learned along the way. You should include which requirements you met, or failed to meet. If you added some of the "over and above" efforts, please point these out so the grader can look for them.
Tips
The following tips can help improve your possibility of success with this project:
- Do not use the Esri Batch Project tool in this project. In essence, you're required to make your own variation of a batch project tool in this project by running the Project tool inside a loop. Your tool will be easier to use because it's customized to the task at hand.
-
There are a lot of ways to insert "_projected" in the name of a dataset, but you might find it useful to start by temporarily removing ".shp" and adding it back on later. To make your code work for both a shapefile (which has the extension .shp) and a feature class in a geodatabase (which does not have the extension .shp), you can use the following:
rootName = fc if rootName.endswith(".shp"): rootName = rootName.replace(".shp","")In the above code, fc is your feature class name. If it is the name of a shapefile it will include the .shp . The replace function searches for any string ".shp" (the first parameter) in the file name and replaces it with nothing (symbolized in the second parameter by empty quotes ""). So after running this code, variable rootName will contain the name of the feature class name without the ".shp" . Since replace(...) does not change anything if the string given as the first parameter does not occur in fc, the code above can be replaced by just a single line:
rootName = fc.replace(".shp","")You could also potentially chop off the last four characters using something likerootName = fc[:-4]
but hard-coding numbers other than 0 or 1 in your script can make the code less readable for someone else. Seeing a function like replace is a lot easier for someone to interpret than seeing -4 and trying to figure out why that number was chosen. You should therefore use replace(...) in your solution instead.
- To check if a dataset is already in the target projection, you will need to obtain a Spatial Reference object for each dataset (the dataset to be projected and the target dataset). You will then need to compare the spatial reference names of these two datasets. Be sure to compare the Name property of the spatial references; do not compare the spatial reference objects themselves. This is because you can have two spatial reference objects that are different entities (and are thus "not equal"), but have the same name property.
You should end up with a line similar to this:if fcSR.Name != targetSR.Name:
where fcSR is the spatial reference of the feature class to be projected and targetSR is the target spatial reference obtained from the target projection shapefile.
- If you want to show all the messages from each run of the Project tool, add the line: arcpy.AddMessage(arcpy.GetMessages()) immediately after the line where you run the Project tool. Each time the loop runs, it will add the messages from the current run of the Project tool into the results window. It's been my experience that if you wait to add this line until the end of your script, you only get the messages from the last run of the tool, so it's important to put the line inside the loop. Remember that while you are first writing your script, you can use print statements to debug, then switch to arcpy.AddMessage() when you have verified that your script works, and you are ready to make a script tool.
- If, after all your best efforts, you ran out of time and could not meet one of the requirements, comment out the code that is not working (using a # sign at the beginning of each line) and send the code anyway. Then explain in your brief write-up which section is not working and what troubles you encountered. If your commented code shows that you were heading down the right track, you may be awarded partial credit.
Python code samples for students wanting more examples
Practice exercises for Lesson 2
Lesson 2 Discussion Forum
Lab Course

What is a Lab course?
A lab course provides the setting for students to gain "hands-on" research experience while working through course material online.
What are the affordances of this model?
An online lab course shifts the traditional teacher/ student/ classroom paradigm to afford students the opportunity to utilize simulators and tools to manipulate actual data that is related to the topics the students are learning. Interactive lab activities help students engage with data and related tools to manipulate and practice course concepts, learning and committing new ideas to long-term memory.
Things to pay attention to:
Consider procedures that you would like your students to practice, as well as various data types and related tools that will help your learners gain the practical experience they need to prepare for their future careers. The online lab provides a setting in which to scaffold the learning of your students with your handpicked activities. The following pages are from the beginning of a lesson. Note the structured layout of the material, providing students with clear learning objectives and instructions for working with relevant research data and tools in this lesson.
We look forward to working with you!
Contact us directly or visit the Dutton Website to learn more!
Introduction to Earth 103
Welcome to Earth 103: Earth in the Future!
Tim Bralower wanted to create a course that could earn students a lab credit without needing "formal" lab equipment.
Students complete 8 labs using Google Earth. First, students are given a worksheet that walks them through the steps to complete the practice lab. This prepares them for the graded version of the lab. The practice labs foster student readiness, so they know how to make all of the adjustments in Google Earth. Then, when they need to complete the graded version, their acquired knowledge helps them work through the lab material in Canvas. Instead of turning in lab reports, students complete the graded version of the lab worksheet and then answer the questions in a Canvas Quiz.
Module 8: Water Resources and Climate Change
Video: Earth 103 Water Module (2:04)
Today, there are more than a billion people living without access to clean drinking water and that's really hard for us to imagine on the east coast of the United States, where there is water everywhere. Today, I'm standing in a stream near Lemont, Pennsylvania. And if I were here a hundred years ago, I would have readily taken a sample of this water and drunk it. But I’m not quite so sure about that today. There are factories around, there's farms around, and this water is probably not quite good enough to drink. This stream behind me is a tributary to the Chesapeake, and ultimately this water ends up in the Chesapeake Bay, and if I can't drink this water here in rural Pennsylvania, can you imagine what it's like by the time this water gets to the Chesapeake? It would definitely be a bad decision to drink the water flowing into the Chesapeake Bay today.
The other part about being on the east coast of the United States is we're in a lush region, and climate change here is forecasted to make this region maybe a little bit more lush and a little bit higher rainfall in the future. We'll never have a problem with access to drinking water in this part of the world. But if we go out to the western part of the U.S., climate change forecasts predict that the region will become a lot drier, and communities out west in the U.S. are going to have to make really tough decisions as to how they manage their water resources. Such tough decisions have already been made in places around the world such as Australia, where devastating droughts over the last two decades have led rivers to virtually reverse course, and communities have had to make very tough decisions about how they manage their water resources.
So, in this module, we'll learn a lot about how water behaves on the surface of the planet, what is going to happen in the future with climate change, and the choices communities are going to face with dwindling water resources. Now, enjoy it, and please get started.
Introduction
There is a new generation of super-rich, highly influential people who are starting to invest massive amounts of money and influence in truly important causes. Bill and Melinda Gates in global health, Warren Buffett in reproductive health and food, the Jolie-Pitts in community development, and the Katrina recovery effort. Now, enter Matt Damon and Gary White, who have co-founded water.org, an organization dedicated to developing and delivering solutions to the global water crisis. Visit water.org, and you will find an impressive array of information and programs. Here are direct facts from that site that convey the magnitude of the current global water emergency.
- Nearly 1 billion people are living without accessible water
- 2.5 billion without adequate sanitation
- 440 million school days lost
- 220 million hours each day are spent collecting water
- 3.7 miles walked each day by women and children
- 4100 children under five die each day from a preventable water-related illness
- 3.4 million people die each year from a preventable water-related disease
More than any other resource, with the exception of food, water is crucial for human survival. Ancient civilizations were repeatedly forced to deal with the threat of diminishing water supply. Now, climate change presents a new threat by causing the supply and distribution of water to change over the coming decades and centuries. This situation will be made significantly more dire by explosive population growth in parts of the world where water is scarce and by pollution that will continually limit the supply of clean drinking water. The IPCC (2007) stated the situation very clearly: “Water and its availability and quality, will be the main pressures on, and issues for, societies and the environment under climate change.” The latest 2022 report stresses the need for adaptation. This will be much easier in the developed world than in developing countries, where resources are limited.
Because groundwater systems recover very slowly from human impacts, remediation can be extremely difficult and expensive. In this module, we begin by examining the distribution and behavior of water close to the Earth’s surface; next, we consider how climate change will alter the supply of water and how population growth will change the demand; finally, we present management strategies that will hopefully preserve the supply of water for humans around the globe.
Ancient civilizations developed in some of the driest realms of the planet. Populations in Egypt and Mesopotamia (an area that includes parts of modern Iran, Iraq, Syria, and Turkey) learned how to survive in an arid environment. For example, ancient Egyptians and Mesopotamians constructed an extensive network of canals to transport water away from the Nile River for irrigation. Shadufs, which are contraptions consisting of buckets at the end of a boom which could be lowered with a rope, were used to haul water out of the canals and onto the fields. These civilizations routinely had to live with highly irregular precipitation, consisting of periods when large amounts of rainfall flowed through the canals and flooded large areas, alternating with times of almost no rainfall.
Examples of Ancient Civilizations
As the population has increased, and especially with the rise of industry in developed nations, so has demand for water soared. Moreover, industry has increased competition, often for the cleanest drinking water supplies.
Nowhere has the interplay between the increasing demand and limited supply of water been more complicated than in the desert southwest of the US. The city of Los Angeles receives a meager 38 cm (15 in) of rain a year. Yet, the city has the highest water usage in California and some of the highest use rates in the country. You would never know by looking at the number of golf courses and car washes and the abundance of lush, green lawns that the city is located in a desert. The same is true for Las Vegas, which receives significantly lower rainfall.
Los Angeles uses much more water than it receives from precipitation and, thus, it imports water from the northern part of California and from states to the east via the Colorado River. In fact, much of the development of Los Angeles was fueled by this supply of water from the Owens Valley in the Sierra Nevada and the Colorado River to the east. Water from the Colorado River began to flow into Los Angeles in the 1920s and 1930s and included the construction of Parker Dam and the Colorado River Aqueduct.
Water Supply and Demand
The growth of other cities that lie in arid locations closer to the Colorado River, including Denver and Phoenix, will likely lead to bitter litigation over water rights in the southwest in the coming decades. Overseas, countries in arid parts of the globe, for example, Turkey, Iraq, and Syria have also had major disputes about water rights and management. Turkey, which lies at the source of the Tigris and Euphrates rivers, has constructed dams on both rivers for irrigation purposes as well as for hydroelectricity, and this has led to long conflicts with countries downriver including Syria and Iraq.
With projections for the increasingly rapid growth of world population and coupled demand for water for drinking and agriculture, as well as for industry, maintaining a clean water supply looks to be one of the grand challenges of the 21st century. The goals of this module are to learn about how water is cycled on the Earth’s surface and how climate change coupled with the growth of the population will accentuate the global water crisis.
Goals and Learning Outcomes
Goals
On completing this module, students are expected to be able to:
- describe the processes that affect the flow of water in aquifers;
- explain how human activity is impacting the quality of water;
- predict how climate change will affect water supply in different locations;
- propose strategies to cope with an increasingly thirsty planet.
Learning Outcomes
After completing this module, students should be able to explain the following concepts:
- the uneven distribution of water on Earth’s surface
- how water is cycled near the Earth’s surface
- behavior of water in aquifers
- the concepts of permeability, porosity, water table
- causes of land subsidence
- causes of cone of depression and groundwater contamination
- arsenic groundwater contamination crisis
- cause of saltwater incursion
- climate change predictions for water supply
- drought and its consequences in different parts of the globe
- water management, including desalinization
- the growing battle over water in the western US
Assignments Roadmap
Below is an overview of your assignments for this module. The list is intended to prepare you for the module and help you to plan your time.
| Action | Assignment | Location |
|---|---|---|
| To Do |
|
|
Distribution of Water on the Earth's Surface
Introduction
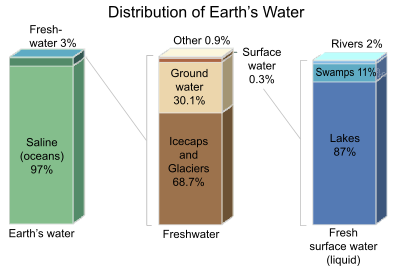
The distribution of water on the Earth’s surface is extremely uneven. Only 3% of water on the surface is fresh; the remaining 97% resides in the ocean. Of freshwater, 69% resides in glaciers, 30% underground, and less than 1% is located in lakes, rivers, and swamps. Looked at another way, only one percent of the water on the Earth’s surface is usable by humans, and 99% of the usable quantity is situated underground.
All one needs to do is study rainfall maps to appreciate how uneven the distribution of water really is. The white areas on the map below had annual rainfall under 400 mm for the last year, which makes them semi-arid or arid. And, remember, projections are for significant aridification to occur in many dry regions and for more severe rainfall events to characterize wet regions.
The Water Cycle
The following video provides a schematic summary of the water cycle.
Video: The Water Cycle (1:23) This video is not voice narrated.
The hydrologic cycle describes the large-scale movement of water between reservoirs including the ocean, rivers and lakes, the atmosphere, ice sheets, and underground storage or groundwater.
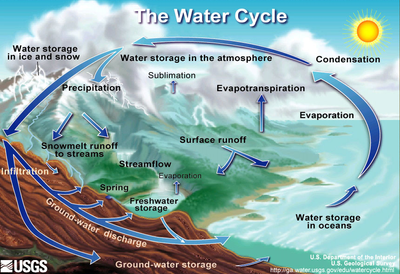
Water evaporates from bodies of water such as the ocean and lakes to form clouds. The moisture in clouds ultimately falls as rain or snow, some of which returns back to the ocean, lakes, and rivers. The remainder percolates into the soil, where it reacts with organic material and minerals and ultimately moves downwards to form groundwater. The amount that percolates depends strongly on evaporation as well as soil moisture, as shown in the video below.
Video: NASA Land Globe Animation (1:00) This video is not voice narrated.
As rain and snow fall to earth over the land, the increase in water competes with the loss of water due to daylight evaporation.
Precipitation: 0.01 to 10 millimeters per hour in steps of (0.01, 0.1, 1, 10)
Different kinds of soil retain different amounts of water in the ground, so the flow of rivers and the filling of underground aquifers can be hard to predict.
Rate of change of total land water: -1.5 to 1.5 grams per square meter per second in steps of (0.5)
Freshwater used for drinking, agriculture, and industry derives dominantly from rivers, lakes, and groundwater, with the latter reservoir accounting for approximately 30 percent of freshwater on the earth’s surface by % of potable (i.e., safe drinking) water. In the US, 86% of households derive water from public suppliers, and 14% supply their own water from wells. Nevertheless, households utilize only one percent of water extracted, the remaining 99% of water is supplied to industry (4%), agriculture (37% compared to 69% worldwide), and thermoelectric power plants (41%). Water use in most areas of the US has increased substantially over the last century.
Check Your Understanding
Lab 8: Stream Flow
Download this lab as a Word document: Lab 8: Stream Flow (Please download required files below.)
In this lab, we will observe the impact of precipitation on stream flow and flooding. The practice and graded sequence of steps are identical. Please go through the following sequence of questions for the practice, check your answers in the Practice Lab, then take the Graded Lab when ready.
Practice Questions
The US Geological Survey maintains the water watch website, which shows the current state of stream flow, drought, flood, and past flow and runoff. We will focus on stream flow data, and you will be required to summarize national trends. The data are expressed as percentiles over normal stream flow for the date of interest. The site has an animation builder that allows you to observe changes in stream flow over short periods and intervals back to 1999. The animations show both regular stream flow and flood stage locations.
Observe the flood and stream flow animations for the following intervals, and describe what you see in terms of major floods and general stream flow. (You can toggle back and forth between these two kinds of animations using the Map Type menu on the animation panel; Real-Time is general stream flow, while the Flood maps show black triangles for places where the streams are actually flooding above their banks.)
Using the USGS animation builder, answer the following practice questions:
- Between 1st July and 31st August 2010 — which region of the US experienced the most flooding? Use the map below of regions in the US to help you answer this question. Note, this is the first part of a two-part question.
- When do the major floods occur, between 1st July and 31st August 2010? Note, this is the second part of a two-part question.
- How does the July and August 2010 flooding relate to precipitation anomalies? To figure this out, go to the Federal Ministry of Transport, Building and Urban Affairs website and set up the visualization parameters according to this screenshot:
 GPCC VisualizerCredit: U. Schneider, P. Finger, E. Rustemeier, M. Ziese, S. Hänsel. “GPCC Visualizer tool”. Global Precipitation Climatology Center, DWD, Deutscher Wetterdienst, Offenbach a. M., Germany, May 2022 .
This will show you precipitation anomalies relative to the monthly mean for the 1950-2000 period, in millimeters per month. Then review the months of June, July, and August, comparing these images with the flood occurrences. During June, July and August 2010, the increase in flooding coincided with ________________? - In what region do major floods happen in August 2011? (Refer to the map in Question 1 to see which states are in which regions.)
- How does the timing and location of August 2011 flooding relate to hurricane activity in the Atlantic? (Hint: Do a Google search for 2011 Atlantic hurricane season). The peak flooding in August 2011 coincides with the landfall of which hurricane?
- Where are the major floods in early December 2010?
- Are the December 2010 floods in the eastern portion of the country more likely related to a prolonged period of high precipitation, a hurricane, or a brief, strong storm system moving through the area?
- What is the relationship between the December 2010 floods in the western part of the country to ENSO? December 2010 was during a La Niña event. Go to the National Weather Service Climate Prediction Center to see what the typical pattern of precipitation is for the US during a La Niña event.
If you run your cursor along the column of letters on the left side, you can see the maps of precipitation anomalies for 3-month periods, so you could look at the maps for NDJ (November, December, January) and see what the typical precipitation anomaly is. For more explanation of these maps, click on the link in the upper right of the window that says "Information on Data, Methods, and Interpretation."
December 2010 was a La Niña year. During a La Niña year, the southern US experiences _______precipitation and the northern US experiences ______precipitation.
In the second part of the lab, in Google Earth, we will observe discharge (in cubic feet per second) for various points along the Mississippi during the devastating floods of 2011. Stream gages are planted in the middle of the river, and the gage measures the volume of water passing through a known volume during a known time. The units are in cubic feet per second.
River Height and Discharge
Please load the Google Earth Mississippi River Stream Gages Updated kmz file. Make sure you look at the dates correctly as well as the discharge axis scale. Please answer the following questions: - Roughly when is peak discharge at Winona, Minnesota (give your answer in month date format. e.g., November 05 for November 5th).
- Roughly when is peak discharge at St. Louis, Missouri (give your answer in month date format. e.g., November 05 for November 5th).
- What is the peak discharge (in cubic feet per second) at Winona? (to nearest 50,000 cubic feet per second). Just give a number.
- What is the peak discharge (in cubic feet per second) at St Louis (to nearest 50,000 cubic feet per second)? Just give a number.
- Generally, is stream flow increasing up or down river?
- Why does discharge increase so abruptly at St. Louis? (Hint: Look at the Google Earth Map in the St. Louis area very closely.)
A. Because of runoff from the city
B. Because the Missouri River flows in at that point
C. Because the river triples in width
D. Because the river deepens significantly
Stop- Are you ready to submit your lab?
Are you sure you are ready to take the graded lab for credit? Stop and think before clicking again.

If you have completed your worksheet and Practice Lab, click next to enter and submit your responses.
If you have not not completed your worksheet and Practice Lab, please do that first and come back in.