Based on the animation of the Greenhouse Effect on the previous screen, respond to the question below:
The concentration of greenhouse gases in the atmosphere has been changing over the past 150 years. Since pre-industrial times atmospheric concentrations of the gases have increased:
- CO2 has climbed over 31 percent.
- CH4 has climbed over 151 percent.
- N2O has climbed 17 percent.
Scientists have confirmed that this is primarily due to human activities, which include burning coal, oil, and gas, and cutting down forests.

Check this out!
Instructions: Click on the greenhouse gas in the left column below to see:
- What percentage of that gas accounts for the total greenhouse emissions in the United States.
- Its source of emission
As you can see, energy related CO2 and CH4 accounts for 90 percent of the total greenhouse gas emissions in the United States. This highlights the impact of energy use on the environment.
How Has CO2 Concentration Changed?
The table below shows the change in greenhouse gas concentration between Pre-Industrial times and 2010, as well as the Atmospheric Lifetime and Global Warming Potential.
| Greenhouse Gases | Pre-Industrial Concentration (PPBV) | Concentration (2010 (PPBV) | Atmospheric Lifetime (years) | Global Warming Potential (GWP) |
|---|---|---|---|---|
| Carbon dioxide (CO2) | 278,000 | 390,000* | Variable | 1 |
| Methane (CH4 | 715 | 1810.5 | 12 | 25 |
| Nitrous oxide (N2O) | 270 | 322.5 | 114 | 298 |
| CFC-12 | 0 | 0.533 | 100 | 10900 |
| HCFC-22 | 0 | 0.208 | 12 | 1810 |
| Perfluoromethane (CF4)** | 0 | 0.07 | 50,000 | 6,500 |
| Sulfur hexa-floride (SF6) | 0 | 0.007 | 3,200 | 22,800 |
*Recent CO2 concentration (390.5 ppm) is the 2011 average taken from globally averaged marine surface data given by the National Oceanic and Atmospheric Administration Earth System Research Laboratory.
**2005 data
Source: CDIAC.org

Atmospheric lifetime is the period of time during which a gas changes and is either transformed or removed from the atmosphere.
GWP is an index defined as the cumulative radiative forcing (infrared radiation absorption) between the present and some chosen time horizon caused by a unit mass of gas emitted now, expressed relative to a reference gas such as CO2, as is used here. GWP is an attempt to provide a simple measure of the relative radiative effects of different greenhouse gases.
Try This!
Instructions: In the graph below, observe how CO2 concentration in the atmosphere has changed over the past 50 years. Based on your observations, answer the questions that follow.
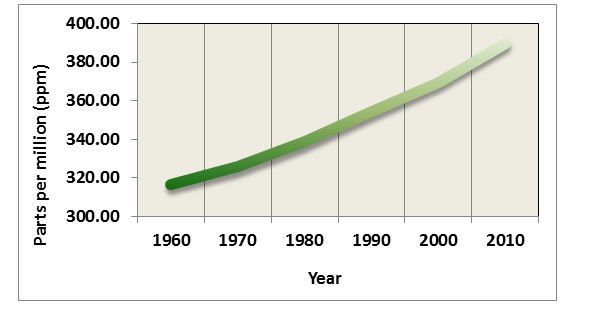
Data from the graph above was obtained from ice core samples of trapped air. More specifically, ice in the Polar Regions traps air from that particular time period, and then new ice is deposited over the previously deposited ice, trapping more air from the past. Thus, the analysis of ice core samples provides the composition of past air, which can be used to determine the past temperatures.
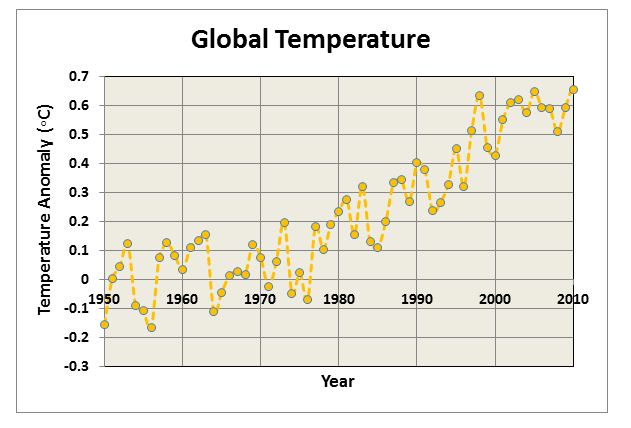
The increase in the greenhouse gases between 1950 and 2010 is believed to have caused an increase in the global temperature. The mean increase in the global temperature over the past one century is about 1 degree Fahrenheit.
Instructions: Review the graph below, showing the Annual mean for the Global surface temperature between years 1960 and 2010. The annual mean will show the detailed fluctuations.

Since 1880, about when the industrial age first started, the average increase in global temperature has been 1 degree Fahrenheit.
Not only has there been an increase in temperatures with the increase of greenhouse gasses, there has also been an increase in CO2 emissions from fossil fuels – this has been apparent over the last 150 years (since about 1850).
The graph below depicts data from ice core samples showing temperature and CO2 concentrations in the atmosphere from 400,000 years ago to about the year 2000.
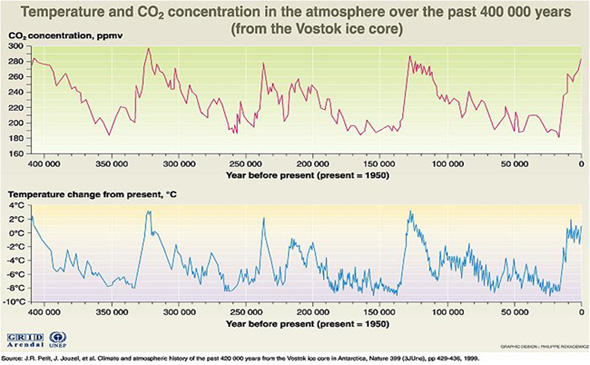
Based on the graph above, it can be determined that during periods of time where there was no human activity:
- The average global temperature increase was 2 degrees Celsius or 4 degrees Fahrenheit.
- The average temperature decrease was 8 degrees Celsius or 17 degrees Fahrenheit.