Geosciences: Lakagígar Eruption
Introduction
Location: Eastern Volcanic Zone, Iceland
Eruption Dates: 1783-84
Volcano Type: Fissure Eruption
Volcano Explosivity Index (VEI): 6
Background and Learning Objectives
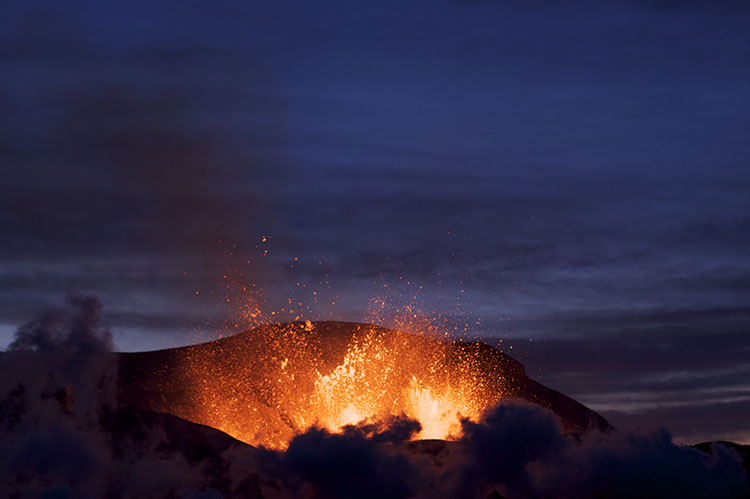
In this module, you will learn about the devastating basaltic fissure eruption of Lakagígar (Laki Fissures), also known as the Skaftar Fires eruption, which took place between June 1783 and February 1784. The sequence of events and resulting destruction was recorded in great detail by Jón Steingrímsson, a priest in a nearby village who observed the eruption as it occurred. Much of what we know of the eruption and its aftermath comes from the writings of Steingrímsson and his contemporaries, combined with modern observations of the tephra deposits. Although Lakagígar was by no means a small eruption – it produced ~15 km3 of basaltic lava and tephra – what made the eruption particularly deadly was the large mass of volcanic gases and aerosols released into the atmosphere. Some of these aerosols remained in the upper atmosphere, reflecting the sun’s radiation and causing global mean temperatures to drop, while some fell out as acid rain, destroying crops and livestock. Most of the estimated 9,000 deaths in Iceland and as many as 20,000 worldwide that have been attributed to the eruption resulted from famine and disease, which were widespread across western Europe in 1784.
This said week, and the two prior to it, more poison fell from the sky than words can describe: ash, volcanic hairs, rain full of sulfur and salt peter, all of it mixed with sand. The snouts, nostrils, and feet of livestock grazing or walking on the grass turned bright yellow and raw. All water went tepid and light blue in color and gravel slides turned gray. All the earth's plants burned, withered and turned gray, one after the another, as the fire increased and neared the settlements.
- Rev. Jón Steingrímsson, Fires of the Earth, The Laki Eruption (1783-1784)
Upon completing this module, you will be able to:
- Describe the difference between tephra and lava
- Distinguish between Strombolian, Hawaiian, and phreatomagmatic eruption styles
- Explain how mantle convection drives plate tectonics
- Explain how decompression beneath a mid-ocean ridge causes mantle melting
- Identify two ways in which volcanic gases can result in human casualties after an eruption has ended
- Calculate the total mass of volatiles released during an eruption
- Collect data and calculate standard deviation from the mean
What is due for Module 2?
This module will take us one week to complete. Please refer to the Course Syllabus for specific time frames and due dates. Specific directions for the assignment below can be found within this module.
| REQUIREMENTS | ASSIGNMENT DETAILS |
|---|---|
| TO DO | Review all the Module 2 Material. |
| TO WATCH | BBC Volcano Live: Iceland Erupts [2] |
| DISCUSSION | Add your post and comments to the Module 2 Discussion in Canvas |
| QUIZ | Be sure to submit the Module 2 Quiz in Canvas |
| LAB ASSIGNMENT | Mentos and Diet Coke / Volcano Degassing |
Questions?
If you have any questions, please post them to our Questions? discussion forum (not e-mail) in Canvas. I will check that discussion forum daily to respond. While you are there, feel free to post your own responses if you, too, are able to help out a classmate.
Icelandic Volcanism
Before proceeding to the description of events at Lakagígar, please watch this video about Icelandic volcanism featuring the great David Attenborough. The footage will give you a sense of what a fire fountain emerging from a fissure looks like up close.
Video: David Attenborough on volcanoes, Filmed at Eldfell Heimaey (7:56)
[VOLCANO ERUPTING]
DAVID ATTENBOROUGH: I'm in Iceland. This fantastic funnel to the fire, rising 200 feet or so into the air behind me is Norter Rock. Fine ash is falling all around, there are gusts of choking poisonous gas, and it's so hot that this is just about as close as I could get.
The sheer weight of these molten [INAUDIBLE] of rock prevents them from being swept away by the gate of the veil. So there's little danger of them suddenly coming our way.
This is dramatic [INAUDIBLE], but perhaps most sinister is this tide of black slag that is slowly creeping over the surface of the land. In parts, it's red hot and molten and feels like [INAUDIBLE], but on the edges it's cold enough for me to be able to handle it. It's black, it's heavy and it's called basalt. And basalt like this has been welling up from deep in the Earth's crust ever since the beginning of the history of [INAUDIBLE].
A flow may travel for as much as 25 miles. Sometimes it moves no faster than a man can walk, but sometimes it races along at an extraordinary speed, 40 miles an hour, and nothing, nothing can stop it.
Sometimes so much lava is produced that it accumulates in flows 100 feet or so thick. Then the center layers of it cool exceptionally slowly and very evenly, and this is the result. Here at the John's Courseway in Ireland, the top of the lava flow has been eroded away for the eruptions took place 50 million years ago. The cooling contractions have produced the effect you can sometimes see in drying mud, though here the cracks extend to a much greater depth to produce six-sided columns about a foot and a half across.
Over the sea in the Hebrides, there's another lava flow that erupted at about the same time and formed the Fingal's Cave. The blanketing layer of lava that slowed down the cooling of the interior is still uneroded and beneath it the near perfect basalt columns rise almost 20 feet high.
Basalt that doesn't contain very much gas wells out from below almost quietly. But if the lava has been extruded under great pressure, it may be full of gas and then it behaves very different. Sometimes a flow sweeps down over a forest incinerating the trees in its path. Most dramatic of all, the lava sometimes wells up inside the deep crater and can't escape. Then it forms that most fieresome of nature's spectacles, a lava lake like this one in Outer Congo in Africa. This lava is at a temperature over 1000 degrees Centigrade, 2000 degrees Fahrenheit. The bubbles of gas that burst from its surface may be 50 feet across. Sometimes having got rid of much of its gas, like beer losing its fizz, it sinks back down the vast pipe from which it rose and returns to the lava chamber a mile or so below. But lava lakes fed by pipes are not common. Basalt will usually come to the surface of the Earth in a rather different way.
These Icelandic Volcanoes erupt from huge cracks or fissures which regularly open up in the line which runs right across the width of the island. When that line itself is only the Northern end of a huge line of weakness that runs for thousands of miles southwards from Iceland right around the side of the [INAUDIBLE].
Iceland lies between Norway and Greenland just South of the Artic Circle. The crack ridged over by lava, is for the most part under water which is why its existence wasn't known until the beginning of this century. From Iceland it runs midway between Europe and Africa to the East and the Americas to the West. In places it rises above the seas to form volcanic islands: the Azores, the Cape Verde, Ascension, Centilia, Tristan da Cunha. But below the surface the lava is continually erupting unseen by human eyes until only a few years ago.
The clouds of gas come from the lava itself, they're not steep. The pressure of the water of these depths prevents that from being produced. The heat is rapidly absorbed by the vastness of the ocean itself, so that the lava cools and congeals much more quickly than it would do in the air.
Events of May-July, 1783 (Southwest Fissures)
Note: the description of events given below is taken from contemporary written accounts, summarized and translated from the Icelandic by Thordarson and Self (Bulletin of Volcanology, v. 55, p. 233-263, 1993).
Weak seismic tremors were first reported in the areas around Laki Mountain and the Skafta River in mid-May, 1783. The seismic activity grew in intensity over the next several weeks, until people were so unsettled by it that they took to sleeping in tents outside of their homes. The first fissure opened at 9 AM on June 8, 1783, producing fire fountains that were visible from the nearby towns of Skaftártunga, Medalland, and Sída. By reconstructing the line of sight from Prestbakki over Mörtunga, a ranch mentioned by name in Steingrímsson’s account, it can be determined that these first fire fountains were located near Hnúta, at the southwest end of the Laki fissures. Strong earthquakes were felt again on June 9-11, and were followed by more fire fountaining a bit farther to the north (contemporary accounts say the second fires were to the north – most likely they were actually to the northeast, following the trend of the fissure). The eruptions of June 8 and June 10 produced tephra deposits up to 60 cm thick extending to the north and east, and lava flows extending southwest towards the Skaftá River Gorge. Another earthquake swarm on June 13 preceded the rupture of a third fire fountain on June 14. This event produced a significant amount of Pele’s hair, which we learned about in Module 1 [3]. Lava flows from the June 14 fissure followed a somewhat more southerly path before joining with the flows still emerging from the June 8 and June 10 fissures at the Skaftá River Gorge. An earthquake on June 23 was followed two days later by explosive fountaining that peaked on June 27-28, raining ash and tephra on nearby towns. Interaction with the shallow water table resulted in a phreatomagmatic eruption, producing a large tuff cone centered on the fourth fissure. Lava flows emerging from the mouth of the Skaftá River Gorge were more or less continuous from June 12-29, with a surge following the opening of each new fissure. The fifth and most sustained explosive event on the Laki fissures occurred between June 30 and July 25, 1783. The initiation of this stage is not well documented, but it is known that earthquakes occurred on June 30, and tephra fell on local villages July 9-10. It is believed that all of the first five fissures were fountaining during this time. A lava surge—the last to be reported—emerged from the Skaftá River Gorge July 13-14. Tephra fall and seismic activity continued intermittently through July 25. The fissure that opened during this episode bisected the western flank of the older Laki hyaloclastite mountain, from which Lakagígar takes its name.
Events of August 1783 - February 1784 (Northeast Fissures)
Eruptive activity northeast of Laki mountain commenced on July 29, 1783, marked by explosive phreatomagmatic activity. The phreatomagmatic eruption lasted 2-3 days, producing a second tuff cone. Lava flowed both to the south and to the north, ultimately entering the Hverfisfljót River Gorge to form a second flow channel that would drain the lavas produced by the northeast fissures. The lava flow rate reached a maximum of 4 km/day between August 3-7, continuing at a lower rate until the next surge on September 1 (preceded by an earthquake swarm on August 23). Another earthquake swarm on September 26 was accompanied by intense volcanic activity, and both the Skaftá and Hverfisfljót rivers dried up during this time. Another fissure opened October 24-29, delivering a final surge of lava to the Hverfisfljót River Gorge. Effusive eruption continued at a diminished rate until February 7, 1874.
Video: Fissure eruption at Eyjafjallajokull, Iceland, in 2010 (0:47)
Styles of Basaltic Eruption
Basaltic liquids are characterized by low viscosities and relatively low volatile contents, such that basaltic eruptions tend to be more effusive than explosions. However, this doesn’t mean that basaltic lavas always flow quietly from the Earth. Explosive basaltic eruptions and fire fountains can send volcanic tephra tens to hundreds of meters into the air – sometimes more than a kilometer! The table below explains the eruptive styles observed at Lakagígar; it is by no means exhaustive.
Styles of Basaltic Eruption at Lakagígar
Two types of tephra are found today at Lakagígar, providing physical evidence of the styles of volcanism during the 1783-84 eruption. The two tephra types are classified by Thordarson and Self (1993) as strombolian and phreatomagmatic. The strombolian tephra is most common and is characterized by a glassy skin covering the surface of each clast (lapillus), indicating that it was still partially molten as it was falling. These lapilli in fact could be the products of either strombolian or hawaiian style volcanism. The phreatomagmatic tephra has no glassy skin and is entirely vesiculated, indicating that it was completely fragmented upon eruption.
Video: Eruption Animation (0:19)
Check Your Understanding
Question - Multiple Choice
What style of volcanism is shown in the movie above?
Click for answer.
This is an example of a strombolian eruption, characterized by short bursts of lava fountaining.
Background: Mantle convection, decompression melting, and mid-ocean ridges
Iceland is unique in that it is the only place in the world where a mid-ocean ridge protrudes above sea level. Iceland straddles the Mid-Atlantic Ridge, with the North American Plate to the west and the Eurasian Plate to the east, and ~2 cm/yr relative motion in opposing directions. Much, although probably not all, of the magmatism at Iceland is a result of mantle decompression beneath this divergent plate boundary.
Mantle Convection and Plate Tectonics
In Module 1, we learned that tectonic plates move across Earth’s surface relative to a more or less fixed reference frame of mantle plumes. So what are these plates, and why do they move? The Earth’s lithosphere – which consists of the crust and the rigid upper portion of the mantle – is broken up into 15 major plates, plus several micro-plates. The tectonic plates move with respect to one another – some moving apart at divergent boundaries, some coming together at convergent boundaries, and some sliding past each other at transform boundaries. The lithospheric plates ride on top of the flowing, plastic mantle asthenosphere.
The geothermal gradient inside the Earth is such that temperature increases with depth. The higher temperatures at the core-mantle boundary (~2,900 km depth) relative to the lithosphere-asthenosphere boundary (~100-200 km depth) drive convection in the plastic, flowing asthenosphere. This works very similarly to water convecting in a pot that’s being heated on the stove – hot fluid is less dense and therefore it rises, while the dense cooler fluid sinks. Just remember that the “fluid” in the mantle is actually a flowing solid; it is more viscous and flows much more slowly than water in a pot – at a rate of millimeters per year. Most geoscientists agree that there is a close relationship between mantle convection and plate tectonics, although it remains unclear to what extent the convecting mantle “drags” the lithospheric plates along its surface, or if instead the sinking of lithospheric plates at subduction zones serves to initiate convection cells in the mantle. In the most general sense, we can imagine that tectonic plates move away from each other at places where the mantle is rising, and together at places where the mantle is sinking.
New oceanic crust is more or less continuously being formed at mid-ocean ridges, which are a type of divergent plate boundary. It was mentioned above that the North American and Eurasian plates are moving away from each other at ~2 cm/yr at Iceland. As it turns out, this is a pretty representative average spreading rate for the Mid-Atlantic Ridge, which means that if you were to fly from John F. Kennedy International Airport in New York to London’s Heathrow Airport today, the trip would be 1 meter longer than if you had taken the same flight 50 years ago!
Check Your Understanding
Question 1 - Short Answer
The central Pacific Ocean is spreading at a rate of ~5 cm/yr. How many years does it take for the distance between Mexico City and Hawaii to increase by 1 meter?
Click for answer.
20 Years
Question 2 - Short Answer
Now let’s scale it up to geologic timescales. At a spreading rate of 5 cm/yr, how much would the distance between Hawaii and Mexico City increase in 100 million years? Give your answer in kilometers.
Click for answer.
5,000 km
Question 3 - Multiple Choice
How does this distance compare to the distance between New York and Los Angeles?
Click for answer.
a little bit more - about 1.25 times as far.
Decompression Melting
In Module 1, we learned how the mantle sometimes melts as a result of a thermal anomaly (“hot spot”) that elevates the local geotherm above the mantle solidus. A close look at the diagonal orientation of the mantle solidus on a pressure-temperature diagram suggests that the mantle should also be able to melt under the influence of a pressure anomaly. That is, a rapid decrease in pressure can cause the mantle to melt, even without an increase in temperature. We call this kind of melting adiabatic – or, more commonly, decompression melting. Decompression melting commonly occurs at divergent plate boundaries, where two tectonic plates are moving away from each other. Mid-ocean ridges are the classic example, but adiabatic melting also occurs during continental lithospheric extension and in some mantle plumes.
Check Your Understanding
According to the diagram above, at approximately what depth does adiabatic melting begin?
Click for answer.
Melting begins where the adiabat intersects the solidus, at about 125 km depth.
Iceland is unique in that many researchers believe that a mantle plume is rising up through the Mid-Atlantic Ridge here. Thus melting at Iceland probably involves both high-temperature melting due to a thermal anomaly and decompression melting related to the divergent boundary. This may explain why eruption rates are so high (a significant eruption occurs once every 2-3 years), and why it is the only place on Earth where a mid-ocean ridge is exposed above sea level. The relative travel times of seismic waves beneath Iceland (seismic waves travel more slowly through hot or partially molten materials) have been used to map a narrow anomaly extending to at least 400 km depth, which many believe to be evidence of an Icelandic mantle plume. However, it is important to keep in mind that 400 km depth is still only the uppermost part of the asthenosphere, nowhere near the 2,900 km depth of the core-mantle boundary (which is generally believed to be the origin of hot mantle plumes). Some scientists believe that the plume does extend into the deep mantle, but cannot be imaged at depth because it is so narrow that it cannot be resolved using seismic imaging techniques.
Death, destruction, and degassing from the 1783-84 eruption of Lakagígar
The Skaftar Fires eruption was one of the five deadliest eruptions of the past 250 years. More than 9,000 people are estimated to have died within Iceland, nearly all due to starvation and disease in the months that followed the eruption itself. This accounts for ~20% of the population of Iceland at the time of the eruption, but the devastation was not limited to the island. Approximately 10,000-20,000 additional deaths across Europe in 1784 are attributed to respiratory ailments, a severe winter, and failed crops, which very likely were exacerbated by - if not entirely a result of - the Lakagígar eruption.
The Icelandic word móðuharðindin, meaning “mist hardships”, is used to describe the difficult times following the Lakagígar eruption. Acid rain destroyed crops and about three quarters of the island’s livestock. Animals that grazed on plants or drank from rivers contaminated with volcanic fluorine developed skeletal fluorosis, making it painful to eat or move. Sulfur is a minor component of the Earth’s mantle that tends to be concentrated in basaltic magmas. When basalt erupts as lava above the surface, the large pressure decrease allows the sulfur to be released in the form of sulfur dioxide (SO2) – the process is similar to the way carbon dioxide is released from a bottle of soda when you reduce the pressure by removing the lid. Scientists estimate that ~122 megatons of SO2 were released during the Lakagígar eruption. Upon combining with water in the atmosphere, this would have been converted to ~200 megatons of atmospheric aerosols, which were predominantly H2SO4. A little less than 20% of these aerosols are released from the lava flows and remain close to the surface as a local haze, while the remaining ~80% are carried up into the lower stratosphere by the eruption column (fire fountains and phreatomagmatic events) and transported over long distances by atmospheric circulation.
Of the total aerosols that were produced during the Lakagígar eruption, almost 90% would have fallen out as acid rain (mostly over Europe), with a little over 10% remaining in the upper atmosphere and circulating for several years. Aerosols in the upper atmosphere increase the Earth’s albedo (percent of the Sun’s energy that is reflected into space before reaching the surface), resulting in global cooling, usually on the order of ~1˚C, lasting for months or years. This effect is referred to as volcanic winter, and may last right through the summer growing season and into the next year. Coming on the heels of an unusually hot summer, the winter of 1784 was one of the coldest and longest winters on record in much of Europe and North America. Crop yield was extremely poor, and thousands of people died of starvation.
Benjamin Franklin: Politician, Inventor, Climatologist
In addition to being a father of the American Revolution, Ambassador to France, First Postmaster General of the United States, Governor of Pennsylvania, and inventor of the lightning rod, Franklin stove, and bifocal glasses, Benjamin Franklin was also an amateur meteorologist and oceanographer. Franklin observed that the severely cold winter of 1784 was preceded by an unusual haze, and he was the first to suggest that atmospheric contamination from volcanic eruptions might reduce the intensity of the sun’s energy reaching the Earth, resulting in winter weather so cold as to pose a hazard to society. The theory excerpted below was originally written as a letter and subsequently presented at a reading in 1784. In the letter, Franklin suggests that the “dry fog” observed in Europe and North America may have originated from Hecla (sic). Hekla, an Icelandic volcano, erupted in 1766 and not again until 1845. The eruption Franklin is referring to in his letter is almost certainly that of Lakagígar.
METEOROLOGICAL IMAGINATIONS and CONJECTURES
by BENJAMIN FRANKLIN.
During several of the summer months of the year 1783, when the effect of the sun's rays to heat the earth in these northern regions should have been greater, there existed a constant fog over all Europe, and great part of North America. This fog was of a permanent nature; it was dry, and the rays of the sun seemed to have little effect towards dissipating it, as they easily do a moist fog, arising from water. They were indeed rendered so faint in passing through it, that when collected in the focus of a burning glass they would scarce kindle brown paper. Of course, their summer effect in heating the earth was exceedingly diminished. Hence the surface was early frozen; Hence the first snows remained on it unmelted, and received continual additions. Hence the air was more chilled, and the winds more severely cold.
Hence perhaps the winter of 1783-4, was more severe, than any that had happened for many years.
The cause of this universal fog is not yet ascertained. Whether it was adventitious to this earth, and merely a smoke, proceeding from the consumption by fire of some of those great burning balls or globes which we happen to meet with in our rapid course round the fun, and which are sometimes seen to kindle and be destroyed in passing our atmosphere, and whose smoke might be attracted and retained by our earth; or whether it was the vast quantity of smoke, long continuing to issue during the summer from Hecla in Iceland, and that other volcano which arose out of the sea near that island, which smoke might be spread by various winds, over the northern part of the world, is yet uncertain . It seems however worth the enquiry, whether other hard winters, recorded in history, were preceded by similar permanent and widely extended summer fogs. Because, if found to be so, men might from such fogs conjecture the probability of succeeding hard winter, and of the damage to be expected by the breaking up of frozen rivers in the spring; and take such measures as are possible and practicable, to secure themselves and effects from the mischiefs that attended the last.
Published in Memoirs of the Literary and Philosophical Society of Manchester, 1789, (pp. 373-377). T. Cadwell in the Strand: London.
Lab Activity: Mentos and Magma
In Part 1 of this lab activity, you will conduct the famous "Mentos and Diet Coke eruption", under more-or-less controlled experimental conditions. In Part 2, you will make some degassing calculations of your own. First, you will calculate the amount of CO2 released from a 2-liter bottle of Diet Coke. Then you will apply the same principles to calculate the amount of SO2 released during the 1783-84 eruption of Lakagígar.
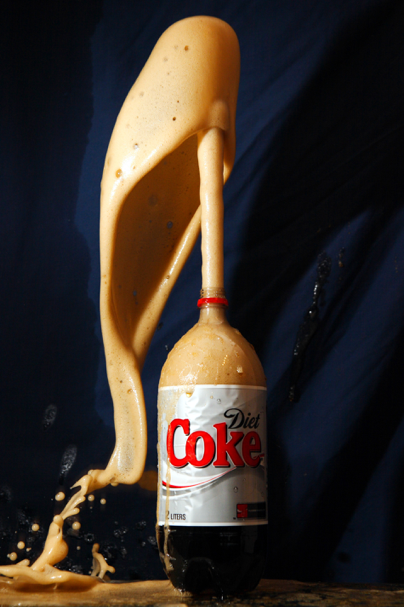
Part 1: Mentos and Diet Coke Eruption
Materials
- One pack of mint Mentos
- One two-liter bottle of Diet Coke
- Paper tube made by rolling a half-sheet of paper loosely around the Mentos roll and securing with tape – or you can just use the Mentos label
- Index card or other piece of thin cardboard
- Measuring tape
- Towels, water (to clean up)
Before You Begin
This is going to be messy. I strongly recommend that you perform this experiment outside. If you can’t go outside, you can do it in the bathtub or shower using only one or two Mentos. You can also use soda water in place of Diet Coke. The fountain won’t be as high, but it will be easier to clean up! Make sure you have plenty of water on hand to rinse down the area after your experiment.
Method
- Slowly open the 2 liter bottle of Diet Coke.
- Load the paper tube with four Mentos.
- Place the index card over one end of the tube and invert it.
- Set the card and the tube with the Mentos inside on top of the open mouth of the bottle, making sure the opening of the tube lines up with the mouth of the bottle.
- Quickly remove the index card, allowing the Mentos to drop into the bottle
- Step back quickly!
- Record the height of the geyser
- Optional: repeat using a new bottle of Diet Coke and more Mentos – how high can you go?
- Enter your data on the spreadsheet provided. Once we have data for the entire class, we will do some statistical analysis on our results.
Pointers
- Determining the height can be a little tricky in the moment. It helps to have two people – one to load the bottle, and one to observe. Or set up a video camera and record your experiment so you can estimate the height after the fact.
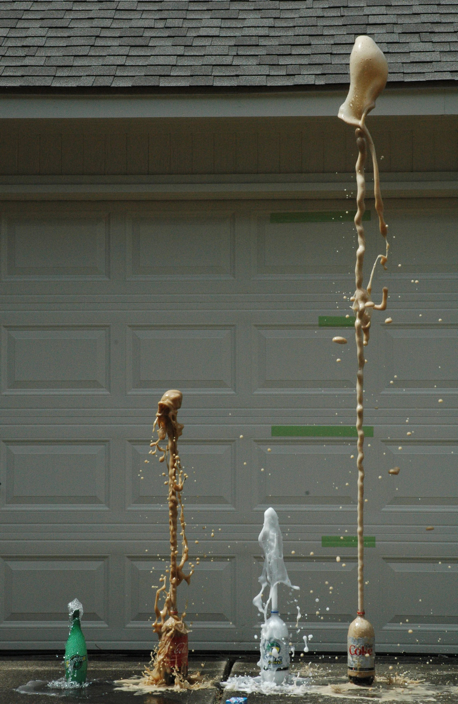
- If you can, the best way to determine fountain height is to make markers at one-foot intervals on a wall, tree, or pole (see green tape markers on garage door in image below). You can use masking tape or chalk to make the marks. This is easier than trying to hold up a measuring tape.
- Or, you can use a person of known height for a reference. Was the geyser waist-high? Chest-high? Above the head?
- It’s best to put the bottle on a flat surface if possible so it doesn’t tip over.
- Make sure the Mentos can fall freely from the tube before you begin. If the tube is wet or crushed, the Mentos can get stuck inside. If this happens, make a new tube.
- Try not to shake the bottle before you open it, or you will lose some CO2 before the experiment begins. Also, it’s difficult to get the Mentos to go down into a bottle that’s already foaming over.
Just for Fun
If you have someone to help you (or a trusty tripod), record a video of your eruption and turn it in! I’ll make a compilation of “greatest hits” for the website.
Video: Diet Coke & Mentos | MythBusters (1:57)
NARRATOR: The Mythbusters are going to have a blast.
ADAM: The most common theory about what's going on in this reaction between the candy and the soda is what's called nucleation. Basically the idea is that the surface of the candy is covered with microscopic pits and lots of more surface area than you can actually see and each little pit, each little corner provides what's called a nucleation site or a place where carbon dioxide bubble can form and escape.
NARRATOR: Look at a Mentos close up and it's like the surface of the Moon and that might be the candy key. Drop one in cola and every tiny crater provides a site where a CO2 molecule can change to gas. Because Mentos are so pitted the theory is that millions of CO2 bubbles are formed in a very short space of time, and because the candy sinks and this rapid release of gas happens at the bottom of the cola you get that famous fountain.
To test this nucleation theory they're going to start with a control. One regular mint Mentos dropped in soda water and sure enough it gets the bubbly party started. Now to do a comparison.
JAMIE: These two candies are made by the same manufacturer and as far as I'm aware even using the same process, but the colored version of this actually has a glazing over it. It's a wax coating or a sealer that inhibits the nucleation process that the other one achieves quite readily.
NARRATOR: The shiniest surface should lower the nucleation sites meaning less of an immediate eruption.
JAMIE: That's not doing anything more than the wall of the plastic bottle itself.
NARRATOR: Sure enough with the smooth mentos there ain't no Wiz with the fizz. The Mythbusters can say they finally cracked the case of the candy and cola cascade.
Video: Science of Mentos - Diet Coke explosions explained (1:26)
The fountain of foam produced when you drop mentos into diet coke has been seen millions of times on YouTube. Until now there's not been a scientific explanation. A study in the US has identified the two main factors involved. They turn out to be one the roughness of the surface of the sweet and two how fast it plummets to the base of the bottle. Students compared the effects of fruit and mint Mentos as well as various other ingredients. Here they are testing sound. previous theories put the reaction down to the acid in the coke or the gum arabic and gelatine in the sweets these explanations have not been properly tested. With no ph change occurring and acidic reaction was ruled out as a cause as was gum arabic following less impressive results when tested independently as can be seen here. Instead the fountain effect was explained by the rough dimply surfaces of the mentos encouraging carbon dioxide bubble growth. These are scanning electron microscope images of the mint Mentos on the left and fruit Mentos on the right. The scale bars represent lengths from 20 to 200 micrometers. Mentos are also fairly dense and sink rapidly quickly creating bubbles seed further bubbles as they rise.
[Music]
Video: Original Mentos Diet Coke Geyser - Cool Science Experiment (2:13)
MAN: This is really good. All right. So here's the setup. Mentos, and the reason we choose Mentos is because they have this chalky like quality to it.
WOMAN: Right.
MAN: What we want is.. we're just gonna put them into the test tube so they go down to the test tube like this. So there's your test tube got it. 13 Mentos is just in case you're counting. All right, so there it is. So now let me open this up here. And yours, you can open yours up as well all right okay. So and we're just using diet just because it's less sticky when it finally there's a disaster.
WOMAN: Oh when there is...
All right, so now here's what's going to happen. We put the card on. We turn the whole thing upside down we're gonna put it over the top. We're gonna position it so it's right over the top. You got it? Right there, okay. All right, now when we pull it out those are going to fall real fast and when they do all of the bubbles that are inside are going to rush to them and we might see a little eruption. Are you ready? Alright so we're going to go three, two, one pull ready three, two, one pull good ...ahh!
Tell me that's not awesome. So sorry look at you you! Wasn't that fun? That was fine that's the best I have ever seen! Is that are.. you good? Alright so. So just ask them is it better for diet or regular go ahead and ask?
WOMAN: Is it better for diet or regular?
MAN: Let's go find out. Come on let's go works in a big way it does not let you you go there I'm going go here 'cause you that's this is, this is the regular. All right.
Okay we're good. Alright so you remember then the carbon dioxide is coming out. Alright hey so this is ... you're okay alright so turn it over and remember they're gonna come rush into it. So let's do it together. Ready three, two, one, pull...
Awesome! Mine didn't even fall in ... get out of the way I'll do this with me so here we go. Three, two, one .. now that is awesome! Is that great? So here, yeah you look great no you look awesome, and guess what I put it all on the website so a teacher can be amazing to learn about states of matter and gases. I'm so sorry, look at you, you're a mess.
The Science
A bottle of soda contains dissolved carbon dioxide (CO2) under pressure. When you remove the lid, the pressure is released, and the CO2 exsolves in the form of tiny bubbles. When exsolution occurs faster than the gas can escape, the soda gets whipped up into a foam that quickly overflows the confined volume of the bottle – if you have ever shaken or dropped a bottle of soda before opening it, you have probably observed this effect yourself. In this experiment, the Mentos encourage the rapid formation of bubbles by providing a nucleation site. In the absence of a nucleation site, the CO2 gas must overcome the surface tension of the liquid before it can form a bubble, which inhibits the process a bit, especially at the beginning. Mint-flavored Mentos have a pitted surface with lots of surface area, which provides plenty of nucleation sites for bubble growth. The more Mentos, the more nucleation – hence, a soda eruption! It is less clear why Diet Coke works better than regular Coke, but based on observation this seems to be the case. Some people have suggested a chemical reaction involving the artificial sweeteners. However, any carbonated beverage will produce a fountain when Mentos are added, some will just be more dramatic than others. Incidentally, fruit-flavored Mentos do not produce an eruption. This is because they have a smooth waxy coating that does not provide nucleation sites for bubble formation.
Lab Worksheet
Download the Excel Spreadsheet [7] to enter your experimental results
Download and complete the Worksheet for Lab 2: Degassing [8]
You will need to submit the results spreadsheet and the complete worksheet to the Module 2 Lab Assignment in Canvas.
Part 2a: Degassing Calculations
The idea here is to determine the mass of CO2 you released into the atmosphere during the first part of your experiment. Watch your unit conversions!
First, a few assumptions:
- We shall assume that the physical properties of Diet Coke are the same as those of water (H2O) at room temperature (20˚C)
- We shall assume that a typical soda contains ~0.5% CO2 by weight prior to being opened (in reality this may vary by quite a bit)
We start by determining the total mass of CO2 present at the beginning of the experiment (prior to opening the bottle). In order to do this, first you will need to determine the mass of Diet Coke. Use the graph below to determine the density of water at 20˚C; we will assume your Diet Coke has the same density. Note that 1 cm3 = 1 mL.

- Approximately how many grams of Diet Coke (water) are in a 2 liter bottle?
- Given that the concentration of CO2 in soda is ~0.5% by weight, how many grams of CO2 are in the bottle?
Solubility is the amount of a compound that will remain in solution under a given set of conditions. Use the graph below to estimate the solubility of CO2 in water at 20˚C and atmospheric pressure.

The amount of CO2 released is given by the total amount present prior to opening the bottle minus the amount retained after the degassing experiment.
- How many grams of CO2 will remain dissolved in our 2 liters of Diet Coke after the experiment is done?
- What was the mass of CO2 released?
Part 2b: Degassing of Lakagígar
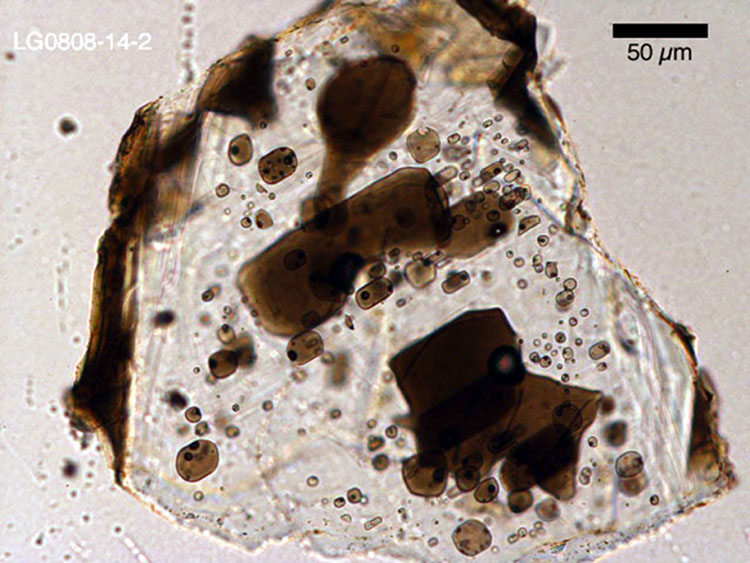
We can use the same approach to calculate the mass of SO2 released from the lava during the Lakagígar eruption. First, we need to estimate the mass of SO2 dissolved in the magma prior to eruption. But how does one determine the concentration of a volatile component prior to degassing, when all the lava and tephra samples we have are already degassed? The answer lies in tiny bits of glass trapped inside of crystals. We call these bits of glass melt inclusions, because they represent the magma that was present at the time the crystals formed. Once a melt inclusion has been overgrown by a crystal, the volatiles are trapped inside and cannot escape*.
The concentration of sulfur measured in melt inclusions from Lakagígar ranges from ~1200 to 1800 parts per million (ppm). We can use the best estimate of 1675 ppm from Thordarson et al., 1996. In order to convert this concentration into an equivalent mass of S, we need to multiply by the total mass of lava erupted. We can assume a best estimate of 15 km3 of lava erupted.
*In detail this is not entirely true – volatiles can still diffuse out through the solid crystals at high temperatures – but for the purposes of our calculations we can assume that they remain perfectly entrapped.
1. Assuming a basalt density of 2750 kg/m3, what is the total mass of lava erupted in megatons (109 kg)? Watch your units! Not only do you need to convert kilograms to megatons, but you also need to convert cubic kilometers to cubic meters.
Now multiply the mass of lava you just calculated by 1675/106 to get the mass of sulfur in the magma prior to degassing.
2. What is the total mass of sulfur before degassing?
Now, just as with the CO2 in Coke experiment, you will also need to estimate the mass of sulfur after degassing, which is determined by measuring the concentration of sulfur in the degassed tephra and lava. The best estimate given by Thordarson et al. is 205 ppm.
3. Using the same total mass of lava you used above, calculate the mass of sulfur remaining after degassing.
The difference between these two masses is the mass of sulfur released to the atmosphere.
4. What is the total mass of sulfur released to the atmosphere (in megatons)?
One last thing. The sulfur released to the atmosphere is not pure elemental sulfur, it is mostly in the form of SO2 gas. In order to convert the mass of S into the equivalent mass of SO2, you will need to multiply by the mass ratio of SO2 to S. You can use any periodic table (I like WebElements [11]) to calculate the molar mass of SO2. Then simply divide this by the molar mass of S, and you have the mass ratio. Multiply by the total mass of sulfur released, and you’re done!
5. What is the total mass of SO2 released to the atmosphere (in megatons)?
6. Thordarson et al. calculated 122.1 megatons of SO2 released. How close did your calculation come to theirs?
Summary and Final Tasks
Summary
In Module 2, we learned about fissure eruptions by studying the 1783-84 eruption of Lakagígar in Iceland. Hopefully you noticed that although the type of lava erupted here - basalt - is the same type of lava erupted in Hawaii, the style of volcanism during this eruption was very different from what we typically see at Kilauea today. This basaltic fissure eruption produced fountains of lava that shot high into the air, and more importantly, emitted massive amouts of volatlie gases and aerosols into the atmosphere, with grave consequences for thousands of people living in the Northern Hemisphere. We also learned about mantle convection, mid-ocean ridges, and decompression melting. For our hands-on experiment this week, we created Diet Coke and Mentos "volcanoes" and used a little math to calculate gas emissions.
Final Tasks
Congratulations! You have completed Module 2. Please return to the Assignments table on Page 1 to be sure you have completed all tasks.
Questions?
If you have any questions, please post them to our Questions? discussion forum (not e-mail) in Canvas. I will check that discussion forum daily to respond. While you are there, feel free to post your own responses if you, too, are able to help out a classmate.