Our Increasingly Urbanized Coasts and Sea Level
Currently, more than 10% of the world’s population (currently estimated at 634 million and growing) live on land that is within 10 meters in elevation from sea level. Some of the world’s most populated regions lie within this elevation range. Another way to view this is the fact that 75% of the world's cities are coastal. Coastal communities in the U.S. are home to 123 million people. In many regions of the world, migration to coastal population centers is occurring at a rapid pace. These low-lying cities include London, New York, Miami, and Tokyo, as well as Mumbai in India, and the rapidly growing megalopolis of Guangzhou in China, and other large cities we may rarely think about. Numerous smaller, little-known communities are equally precariously located but come into sudden focus when a disaster hits. Tacloban in the Philippines, which was devastated by Super Typhoon Haiyan in 2013, is a good example. Meanwhile, U.S. cities that we are very familiar with are also low-lying: Boston, Miami, and New York are all major U.S. cities facing a future that will require adaptation to more frequent flooding from the ocean.
We know that while populations have increased in cities close to coastlines, the sea level around the earth has also been rising at an increased pace. These two factors have contributed to an increased probability of inundation of coastal communities by storm surges, high tides, and other events. The measured global sea level rise has been well documented using worldwide tide gauge and satellite altimeter data. This shows that during the 20th century, global sea level rose at an increasing rate. Between 1880 and 2011, this rate was 0.07 inches (0.18 cm) per year. Between 1993 and 2011, the rate increased to 0.11 inches (0.28 cm) per year. This represents a 64% increase (US EPA). These seemingly small increments add up: sea level has risen by approximately 5 to 8 inches (13-20 centimeters) since 1900. The latest information shows that the rate of rise continues to accelerate: NASA Global Climate Change: Sea Level Latest Data (this is a VERY cool data portal, highly recommend you look at it!)
The most recent sea level rise projections from the Intergovernmental Panel on Climate Change indicate that sea levels could continue to rise another 39 inches (approximately 1 meter) by the end of this century. This may not seem like a huge amount, but communities that are currently at an elevation close to sea level are already seeing increased flooding and this problem will continue to get worse over the next few decades, so it is no longer just a nuisance, but a major issue to be tackled. There is a great deal of uncertainty in predictions of future sea level rise, so this also must be taken into account when considering the future of our coastal cities.
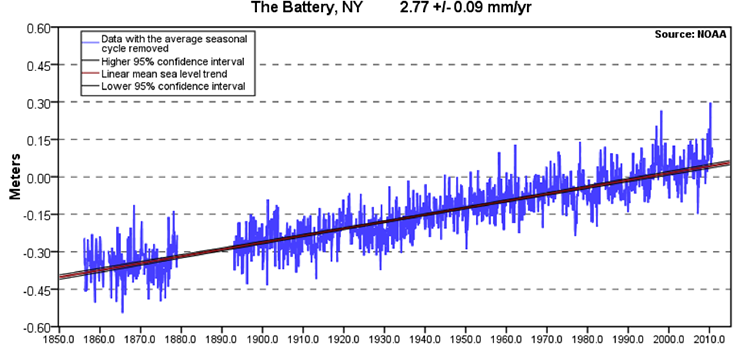
These rates are global averages and, in fact, sea level change varies greatly from place to place around the globe. Above is a data plot from the tide gauge at The Battery in southern Manhattan, NY, with mean sea level in meters plotted over time from 1850 to 2010 (and average rates in millimeters rise per year).
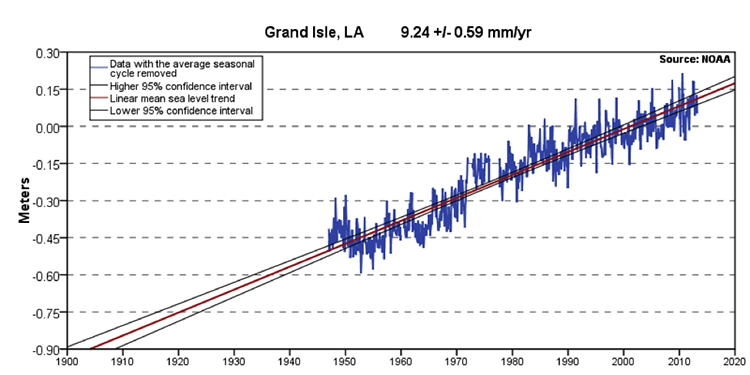
If subsidence (sinking of the land level) is factored in, a location’s relative sea level rise can be much higher than the global average. This is illustrated by comparing the tide gauge data for The Battery with that of Grand Isle, LA. (below), where subsidence of Mississippi River Delta sediment exacerbates sea level rise rates considerably – a difference in sea level rise of 6.47 mm/year between these two locations! We will explore these ideas further in later modules.
Sea Level Rise: The Uncertainty of Predicting Future Sea Levels
The following modules will explore in detail sea level changes in relation to coastal processes and hazards and their impacts on coastal communities. Here in Module 1, we will touch briefly on the topic of sea level rise so that we can think globally about coastal cities at risk from the hazards presented by sea level rise. You will learn about some of the controversies surrounding the prediction of future sea levels. The links we have provided will help to explain the ways in which the predictions are made. The sea level rise predictions used – now given to be approximately 1 meter by the year 2100 – were made using computer modeling. The models run by different groups have provided a range of predictions, underlining the complexity of predicting future sea levels. This is an issue that is the focus of intense research. Quantifying the contribution of the melting of the polar (Greenland and Antarctic) ice sheets to sea level rise has been a source of uncertainty as scientists worked to unravel the mechanisms at work. Scientists are now more confident in determining the contribution of the water flowing from the ice sheets, but it seems that the projected sea level rise rate increases as more is understood about the fate of the ice sheets. However, current research has given coastal managers an estimate of a 1-meter rise by 2100 to use in their planning for the protection of coastal communities in this century.
Storm Frequency and Intensity
Another factor that impacts the coastal hazard risks experienced by coastal communities, is storm frequency and intensity. The International Panel on Climate Change reports that predictive modeling suggests that storms could become more intense in the future. However, the frequency of storms may actually decrease. This quote from IPCC Climate Change, 2007 sums up the evidence for these predictions from modeling results:
“There is evidence from modeling studies that future tropical cyclones could become more severe, with greater wind speeds and more intense precipitation. Studies suggest that such changes may already be underway; there are indications that the average number of Category 4 and 5 hurricanes per year has increased over the past 30 years. Some modeling studies have projected a decrease in the number of tropical cyclones globally due to the increased stability of the tropical troposphere in a warmer climate, characterized by fewer weak storms and greater numbers of intense storms. A number of modeling studies have also projected a general tendency for more intense but fewer storms outside the tropics, with a tendency towards more extreme wind events and higher ocean waves in several regions in association with those deepened cyclones. Models also project a poleward shift of storm tracks in both hemispheres by several degrees of latitude”.