1.1 Building a Web Map
Several GIS technology vendors provide the means for non-programmers to create web maps without writing any code (e.g., Google's My Maps, CartoDB, ArcGIS Online), and the capabilities of these map authoring applications are increasing constantly. In this part of the lesson, we will explore Esri's ArcGIS Online (which I'll abbreviate as AGO hereafter).
- Follow this link to the Penn State home page at AGO. You'll need to authenticate through Penn State WebAccess if you haven't already today. Once logged in, you should see the Home tab selected for the Penn State organizational account.
If you completed GEOG 483, your first hands-on GIS project involved helping "Jen and Barry" find the best place to open an ice cream shop in a parallel universe where the cities and counties of Pennsylvania have different names. We're going to work with the data from that scenario again here (and later in the course), since it contains examples of each geometry type and some good attribute data for demonstration purposes.
- Download and unzip the Jen and Barry's data. (Even if you still have these shapefiles from an earlier course, you may want to download this copy since the shapefiles are zipped and ready for upload to AGO.)
This zip file contains a point shapefile (cities), a line shapefile (interstates) and two polygon shapefiles (recareas and counties). You can check out these shapefiles if you haven't encountered this scenario before, but hang on to the zip files since we'll be uploading them to AGO.
We're going to build a web map containing the Jen and Barry's data. The old Map Viewer made it possible to add a shapefile directly to the map, and for a while the new one did not but that functionality as been re-introduced. So we'll begin by creating hosted feature layers from the shapefiles you downloaded.
- Click on the Content tab, then on the New Item button in the upper left.
- Drag and drop the zipped cities shapefiles onto the large box that takes up the top half of the New Item dialog.
- AGO should recognize the contents of the zip as a shapefile. Accept the default option to both upload the data and create a hosted feature layer, then click Next.
- Assign a Title to the layer -- it should default to match that of the shapefile, though you're welcome to give it a different name. You can also specify a folder, tags, and a summary, if you wish. Click Save when done.
When the data has been uploaded, you should see a page of details about your new feature layer along with a number of buttons running down the right side of the page. In a real-world project, it would be a good idea to fill out the metadata on this page, especially the items marked REQUIRED.
- Click the top Open in Map Viewer button to add the data to a new web map.
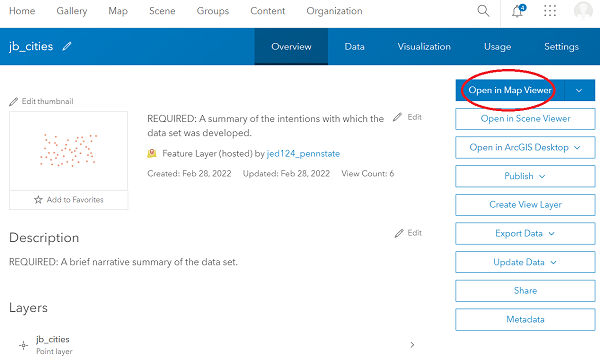
Figure 1.1 Opening a feature layer in the AGO Map Viewer
- AGO will display the cities using a single symbol by default. To modify the symbology, click on the name of your layer within the Layers panel or click the Options (3 dots) button followed by Show properties. The right side of the map should change to display various properties of your layer, in categories such as Information, Symbology, Appearance, etc.
Speaking of the "3 dots" button, note that this menu is where you'd go if you wanted to view the layer's attribute table or remove the layer from the map, among other options.
As in desktop software, you can create a thematic styling of your data in AGO. For example, you might choose to symbolize the Jen and Barry's cities based on the POPULATION field, selecting a style of Colors and Amounts (size) or Colors and Amounts (color). We won't do that here, instead sticking with the Location (single symbol) style, but let's modify that symbol.
- Expand the Symbology property group, if necessary, and click on Edit layer style.
- Next, click on Style Options, then click on the current symbol that was assigned by default. A panel of symbol properties should pop out on the left of the symbol.
Note that through this panel, you can choose from several symbol categories (Basic Shapes, Firefly, Government, etc.). You can also customize a number of other properties, such as size, rotation, transparency, fill color, and the symbol outline.
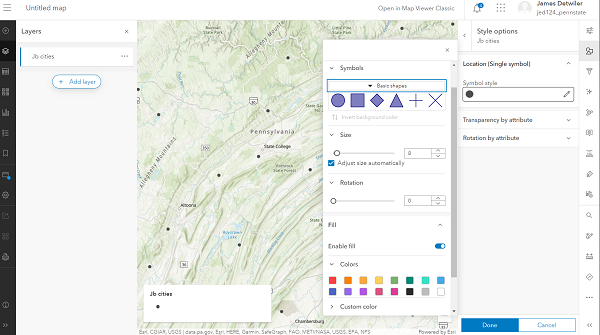
Figure 1.2 Changing layer symbology in AGO
- Select any icon that grabs you.
- To apply your change and wrap up your work with the layer's properties, click the X in the upper right of the symbol options panel, then click Done twice.
We're next going to add the other Jen and Barry's data, but first we should save this web map.
- About halfway down the black strip of buttons on the left side of the window, you should see a folder icon with a blue dot over it. (The blue dot indicates you have unsaved changes in this map.) Click this button, then on Save as.
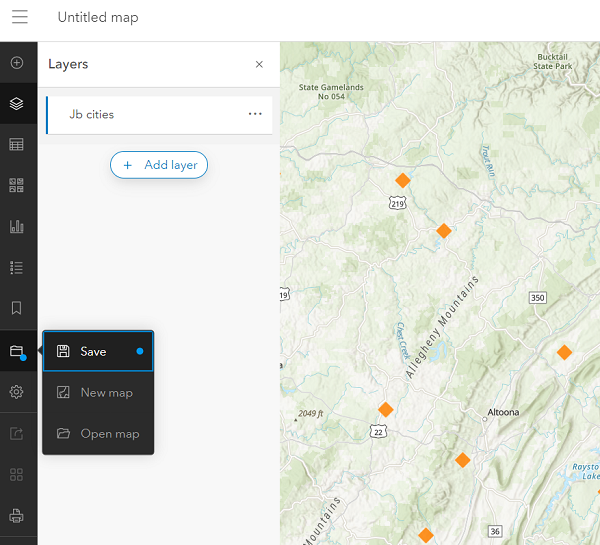
Figure 1.3 Saving the web map
- In the resulting Save map dialog, assign a Title of Jen and Barry - <your name or ID>. Optionally, add some tags and a summary, or change the folder where the map will be saved.
- Click Save map when finished. You should now see the title you assigned in the upper left of the window.
To add the interstates data, we need to import it to AGO through the Content tab as we did earlier for the cities.
- Return to the Content tab by clicking on the "hamburger" icon in the upper left of the window and choosing Content.
- Follow the steps used earlier to create hosted feature layers in your account from the interstates and counties shapefiles. You're welcome to also import the recareas, though you won't be asked to work with them in this walkthrough.
- Re-open the web map you saved earlier by returning to the Content tab, clicking on your web map and selecting Open in Map Viewer from its details page.
- On the Layers panel, click Add. You should be presented a list of layers in your AGO account.
- Locate your interstates layer and add it to the map by clicking the +Add button associated with that layer.
Let's symbolize this layer using values from its TYPE field.
- The layer's style settings should already be visible in the properties panel on the right side of the map. Under Choose Attributes, click the + Field button.
- Select the TYPE field, then click Add. Note that AGO intelligently applies the Unique symbols drawing style (based on the field holding text strings rather than numbers).
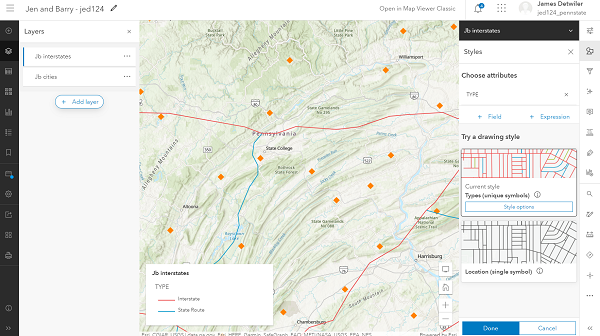
Figure 1.4 Displaying interstates by type - Click Style options. You should see a separate symbol for each of the two unique values in the TYPE field: State Route, Interstate, and Other.
- Modify the symbols to your liking. (A thicker line is intuitive for the Interstate features, a setting that can be made by changing the Width property.)
- Again, click X and Done twice when you're finished symbolizing the interstates layer.
- Following the same sort of procedure, add the counties layer to the map and set its symbology so that the county features are drawn using a hollow fill. (Polygon layers are symbolized with a fill color by default, but that can be disabled by clicking the No color button under the Fill Color heading.) You may also want to modify the outline properties.
Next, let's explore the pop-up windows that appear when the user clicks on a map feature.
- Click on one of the cities features to bring up a pop-up window.
Because the cities features overlap counties features, the pop-up results will include features from both layers. You should see text at the top of the window like "1 of 2" or "1 of 3" indicating this.
- Click on the right arrow to cycle through the pop-up results and note that the matching feature is highlighted on the map.
There are a number of improvements that could be made to the information displayed in this pop-up.
- Display the properties of the cities layer as you did earlier. It will probably default to showing the drawing styles.
- In the strip of buttons running along the right side of the window, click Pop-ups.
Values from columns in the layer's attribute table are displayed in the pop-up by enclosing the column within braces. Thus, the pop-up Title is set to display the value from the layer's NAME column using the expression {NAME}.
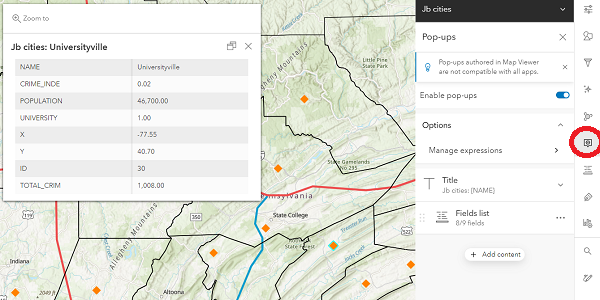
Figure 1.5 Configuring pop-ups
All of the layer's fields -- with the exception of FID -- will be included in the pop-up by default, but this can be customized.
- Click on Fields list, then on the x beside the ID, X, and Y fields, to exclude those fields from the pop-up content. Note that the pop-up that appears over the map is updated dynamically in response to your modifications.
- It's possible that the fields won't be listed in a logical order. Clicking on the 6 dots just to the left of the field name, click and drag the fields as necessary to order them as follows: NAME, POPULATION, UNIVERSITY, TOTAL_CRIM, CRIME_INDE.
There are other settings that can be applied to make the pop-up more human friendly. For example, some of the field names are abbreviated and/or include underscores. And the numeric fields display two digits after the decimal point, but that is meaningless for those fields.
- Looking again at the strip of buttons along the right, click on the Configure Fields button (one below the Popups button).
- Click on the TOTAL_CRIM field and in the panel that appears to the left, give it a new Display name and set the Significant digits property to 0 decimal places. Click Done to dismiss this panel.
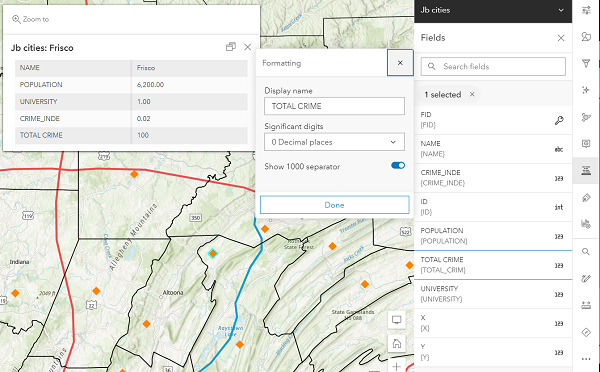
Figure 1.6 Making the pop-ups more user-friendly
Following a similar process, make similar improvements to other fields as appropriate. - Once done modifying the layer's settings, click on its entry in the Layers panel to toggle off its properties panel.
Test your changes by clicking once again on a cities feature.
Note that it is possible to customize pop-ups further (e.g., to string together values from multiple columns) or to display media such as images and charts.
Challenge → The UNIVERSITY field holds a 1 for cities that have a university and a 0 for cities that do not. This would be a bit more human-friendly if it displayed as Yes/No (or True/False). If you can work out how to implement such a change, feel free to share your solution in the Lesson 1 Discussion Forum.
We can also choose to utilize a different base map.
- In the strip of buttons running down the left side of the window, click on the Basemap button and choose one of the options. (A light base map is often preferable to a dark one, since your layers will stand out better.)
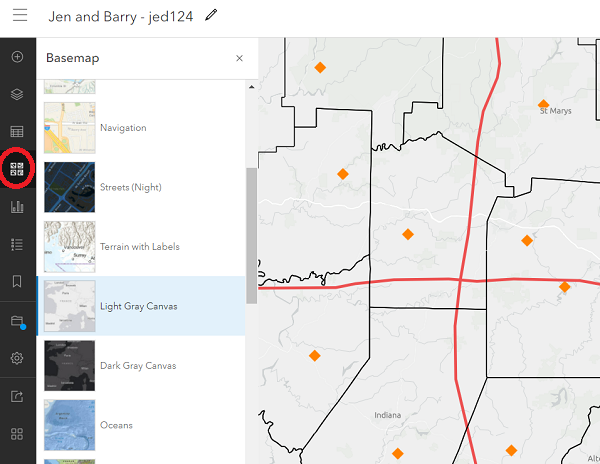
Figure 1.7 Changing the basemap
- Be sure to Save the changes you've made to your web map.
- Finally, make your map visible to others by clicking Share map (also on the left-hand toolbar).
- Set the map's visibility to Everyone (public), as we'll be embedding this map in a web page in a moment, then click Save.
Unless you also made the map's layers public -- the walkthrough didn't tell you to -- you should see a dialog warning you that they won't be visible, but also giving you a chance to rectify that.
- Click the Update sharing button to set sharing on the layers to public as well.
- To confirm that others will be able to see your map, try opening the URL in another browser (e.g., use Edge if you're currently working in Chrome).
In this section, we've been able to build a useful interactive web map without any programming. Move on to the next page to see how to take your ArcGIS Online map further -- still without programming -- by embedding it within a web page and using it as the basis for a web application.